. 2025 Mar 30;8(1):522.
doi: 10.1038/s42003-025-07906-2.

Stepwise recruitment of chaperone Hsc70 by DNAJB1 produces ordered arrays primed for bursts of amyloid fibril disassembly

Affiliations

Stepwise recruitment of chaperone Hsc70 by DNAJB1 produces ordered arrays primed for bursts of amyloid fibril disassembly

Jim Monistrol et al. Commun Biol. .

Abstract

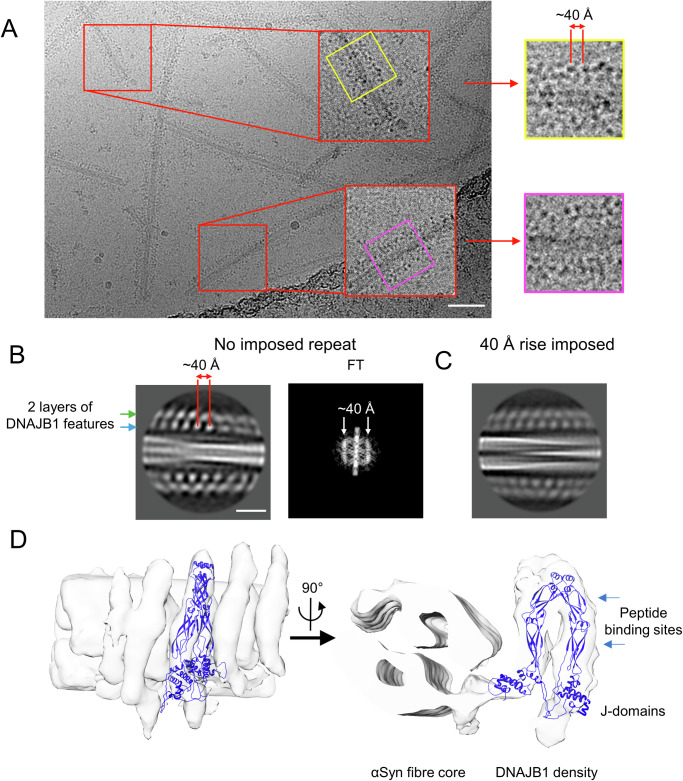
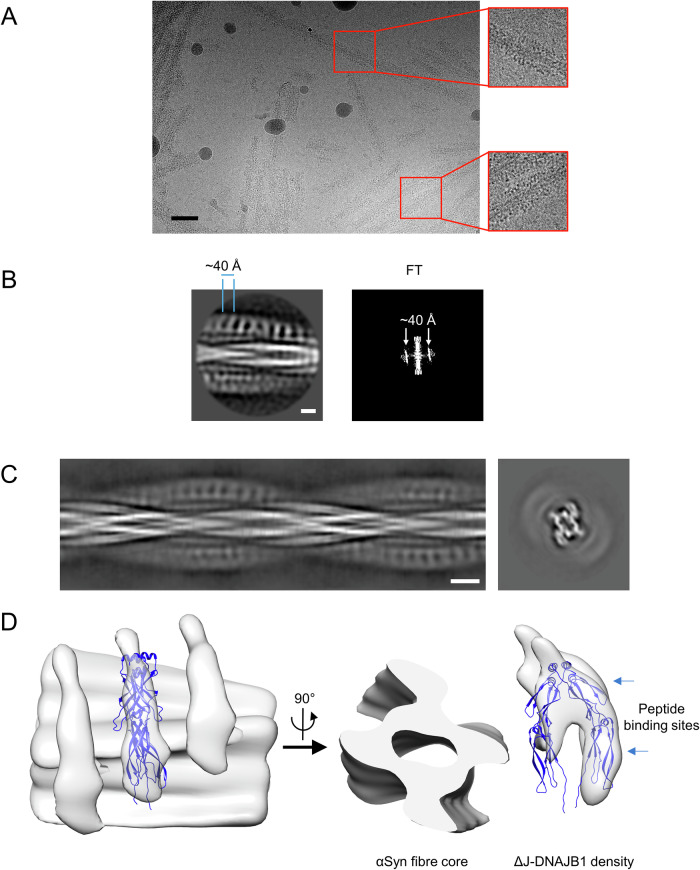
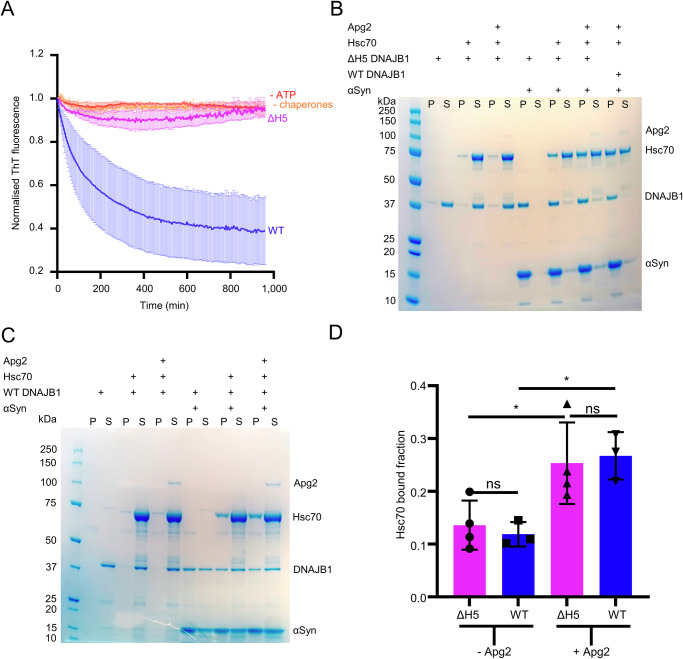
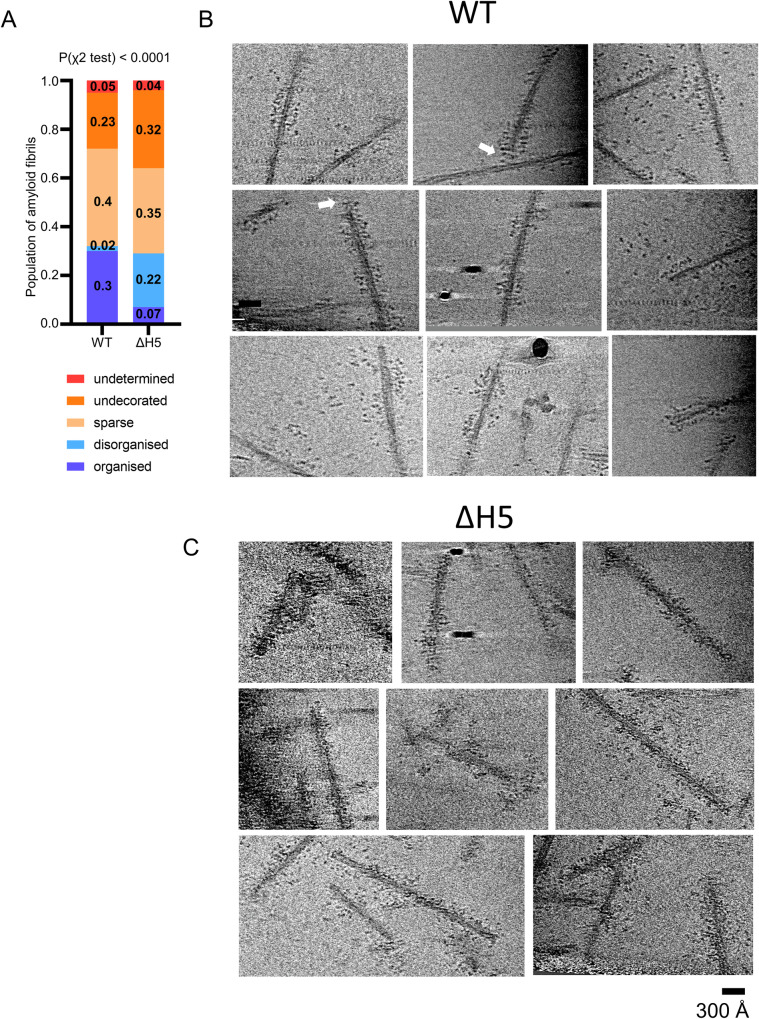
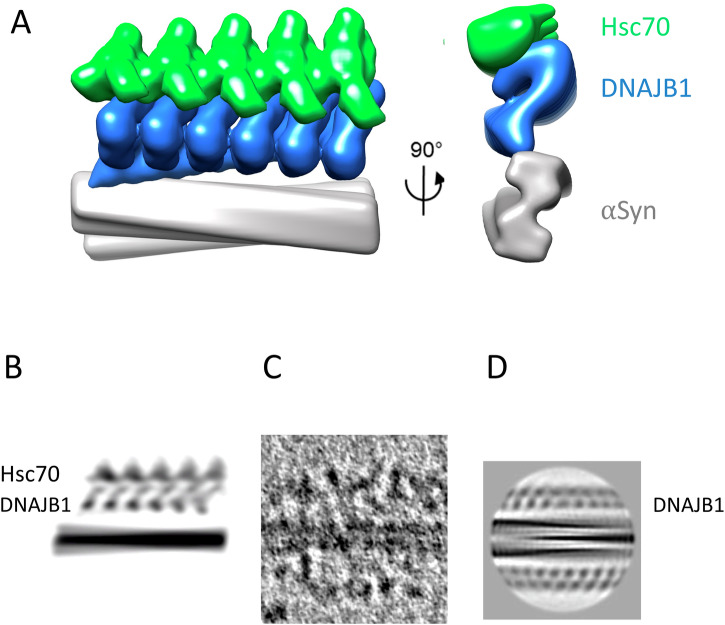
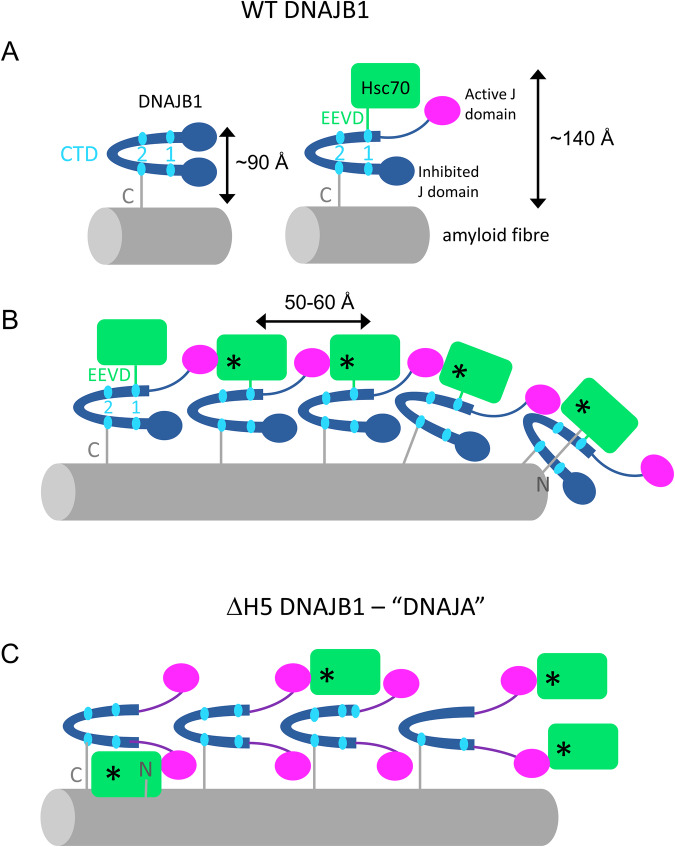
The Hsp70 chaperone system is capable of disassembling pathological aggregates such as amyloid fibres associated with serious degenerative diseases. Here we examine the role of the J-domain protein co-factor in amyloid disaggregation by the Hsc70 system. We used cryo-EM and tomography to compare the assemblies with wild-type DNAJB1 or inactive mutants. We show that DNAJB1 binds regularly along α-synuclein amyloid fibrils and acts in a 2-step recruitment of Hsc70, releasing DNAJB1 auto-inhibition before activating Hsc70 ATPase. The wild-type DNAJB1:Hsc70:Apg2 complex forms dense arrays of chaperones on the fibrils, with Hsc70 on the outer surface. When the auto-inhibition is removed by mutating DNAJB1 (ΔH5 DNAJB1), Hsc70 is recruited to the fibrils at a similar level, but the ΔH5 DNAJB1:Ηsc70:Apg2 complex is inactive, binds less regularly to the fibrils and lacks the ordered clusters. Therefore, we propose that 2-step activation of DNAJB1 regulates the ordered assembly of Hsc70 on the fibril. The localised, dense packing of chaperones could trigger a cascade of recruitment and activation to give coordinated, sequential binding and disaggregation from an exposed fibril end, as previously observed in AFM videos. This mechanism is likely to be important in maintaining a healthy cellular proteome into old age.


Conflict of interest statement

Competing interests: The authors declare no competing interests.

Figures

Fig. 1
Fig. 1. Effect of salt on DNAJB1 binding to αSyn amyloid fibrils.
A Binding assay for WT DNAJB1 binding to αSyn amyloid fibrils in HKMD or HD buffer. Two controls without amyloid fibrils confirm that salt depletion does not cause precipitation of WT DNAJB1. A larger pellet band for DNAJB1 is observed in HD buffer in the presence of fibrils. S: supernatant, P: pellet. B Histogram of WT DNAJB1 bound fractions in each buffer (N = 3 independent experiments). A Shapiro–Wilk test was performed to check the normality of the data, followed by an unpaired t test (P = 0.0016). Mean DNAJB1 binding values with SD are shown. C Cryo micrograph of αSyn amyloid fibrils fully decorated by WT DNAJB1 in HD buffer. Scale bar, 500 Å. D ThT assay showing that pre-incubation of WT DNAJB1 and αSyn amyloid fibrils in HD buffer does not alter the disaggregation activity. The assay was performed in disaggregation buffer (Table 2). Mean normalised ThT fluorescence is shown with SEM. E Binding assay showing the reversibility of the binding when the salts are added back. The proteins were incubated twice in HD buffer (HD condition), twice in HKMD buffer (HKMD condition) or once in HD buffer and once in HKMD buffer (HD/HKMD buffer). F Histogram of the WT DNAJB1 bound fraction in each condition shown in (E) (N = 3 independent experiments). A Shapiro–Wilk test was performed to check the normality of the data, followed by a one-way ANOVA with Tukey’s multiple comparisons test (P = 0.0004 between HD and HD/HKMD conditions, P = 0.0002 between HD and HKMD conditions). Mean DNAJB1 binding values with SD are shown.
Fig. 2
Fig. 2. The complex of αSyn amyloid fibrils and WT DNAJB1.
A Micrograph showing the fuzzy decoration of WT DNAJB1 on αSyn amyloid fibrils. DNAJB1 repeats, displayed as dark dots, are separated by 40 Å. Scale bar, 500 Å. B 2D class and FT showing the 40 Å repeat in WT DNAJB1 decoration, shown in reverse contrast. Scale bar, 100 Å. C 2D class with a 40 Å repeat imposed for the helical rise. The 2D class is similar to the one displayed in (B) with 2 layers of dots characterising WT DNAJB1 decoration on the fibril. D Reconstruction of the WT DNAJB1:αSyn fibril complex. The density corresponding to WT DNAJB1 was manually fitted with the crystal structure of the truncated human DNAJB1 lacking the J-domain and G/F linker (PDB: 3AGY) and the NMR structure of DNAJB1 J-domain (PDB: 1HDJ).
Fig. 3
Fig. 3. The complex of αSyn amyloid fibrils and ΔJ-DNAJB1.
A Micrograph showing the fuzzy decoration of ΔJ-DNAJB1 on αSyn amyloid fibrils. ΔJ-DNAJB1 repeats are discernible as dark dots. Scale bar, 50 nm. B 2D class and FT showing the 40 Å repeat in ΔJ-DNAJB1 decoration, shown in reversed contrast. Scale bar, 50 Å. C Side view of the aligned 2D classes and calculated cross-section. Scale bar, 100 Å. D 3D reconstruction of the ΔJ-DNAJB1: αSyn fibril complex. The density corresponding to ΔJ-DNAJB1 was fitted with the crystal structure of the truncated human DNAJB1 lacking the J-domain and G/F linker (PDB: 3agy) using Flex-EM. Scale bar, 50 Å.
Fig. 4
Fig. 4. ΔH5 DNAJB1 recruits Hsc70 to the fibrils at the same level as WT but is inactive in disaggregation.
A ThT assay showing that ΔH5 DNAJB1 cannot trigger the disaggregation of αSyn amyloid unlike WT DNAJB1. The control curves omitting ATP or chaperones are repeated from the ones shown in Supplementary Fig. 7. Mean normalised ThT fluorescence is shown with SEM. B Binding assay showing that ΔH5 DNAJB1 can recruit Hsc70 at the same level as WT DNAJB1 in the presence of Apg2. ΔH5 DNAJB1 also enhances Hsc70 recruitment in the presence of Apg2. C Binding assay showing that Apg2 can enhance Hsc70 recruitment in the presence of WT DNAJB1. D Histogram of the Hsc70 recruitment to the amyloid fibrils as a function of Apg2 and WT or ΔH5 DNAJB1 in each condition shown in (B) and (C) (N = 3 independent experiments). A Shapiro–Wilk test was performed to check the normality of the data, followed by a one-way ANOVA with Tukey’s multiple comparisons test (*P = 0.0142, **P = 0.0014). Mean Hsc70 binding values with SD are shown.
Fig. 5
Fig. 5. Structural comparison by cryo tomography of WT and ΔH5 DNAJB1 chaperone complexes on αSyn amyloid fibrils.
A Plot of blinded counting of densely bound regions on the fibril segments, categorised as either organised or disorganised; sparsely bound regions, unbound, or undetermined. The fraction of organised regions is significantly higher in the WT complex (P(χ2 test) < 0.0001). Fractional values are shown in the plot and the data are tabulated in Table 1. B Tomogram slices of examples of the WT complexes, showing the arrays of chaperones spiralling around the fibrils, with rows of globular densities at the ends of stalks extending from the fibril surface. White arrows indicate examples of the chaperone decoration bending around a fibril end. The maximum diameter of the decorated fibrils is ~390 Å. C Tomogram slices of ΔH5 DNAJB1 complexes, showing a less organised binding, with the chaperones more irregularly distributed at different radii. The maximum diameter also reaches 390 Å, but much less consistently than in the WT system. All tomogram slices are averages of 5 sections. Scale bar, 300 Å.
Fig. 6
Fig. 6. Model of Hsc70 binding and activation.
A A schematic model of Hsc70 binding to the αSyn:DNAJB1 complex. An alpha fold model of Hsc70:DNAJB1 J-domain was placed on the outside of the complex with the outer J-domain removed from the fitted DNAJB1 model, avoiding clashes. The Hsc70 orientation is arbitrary but it is not possible to place it any closer to the αSyn N termini, because of the presence of the DNAJB1. The model is shown in side and end views. Hsc70 is too bulky to pack every 40 Å as for DNAJB1 and is spaced at 50 Å. The 40 residue long flexible linker to the activated J domain can accommodate a wide range of positions for the Hsc70. B Projected density of the model for comparison to the tomogram section in (C). C Tomogram section of the full chaperone system bound to an αSyn fibril. D Class average of αSyn:DNAJB1 reversed in contrast from Fig. 2 (protein density dark) for comparison. The approximate locations of DNAJB1 and Hsc70 layers are indicated with text labels. Panels (BD) are shown approximately to the same scale.
Fig. 7
Fig. 7. Cartoon showing proposed cooperative, 2-step mechanism of JDP recruitment of Hsc70 into active clusters for disaggregation.
A WT DNAJB1 binds to the flexible C-terminus of αSyn via its CTD2 site. Then, the EEVD motif of Hsc70 binds CTD1 and releases the J domain, which is proposed to activate an Hsc70 (*) on the adjacent DNAJB1 dimer. This could create a localised cloud of consecutive, actively recycling Hsc70s corresponding to the ordered arrays seen by cryo-ET. B The Hsc70s are packed with a spacing of ~50–60 Å along the fibril and extend out >~100 Å from the fibril surface, suggesting that they bind preferentially to the outer subunit of DNAJB1. Only the Hsc70 in complex with DNAJB1 at the fibril end can approach closely enough to interact with the N-terminus of αSyn. The binding follows the helical path of the fibril structure, omitted here for clarity. ATPase cycling is catalysed by Apg2, which is also omitted from the cartoon. It is present at up to 10% of the amount of Hsc70 but is not seen bound to the fibrils in the binding assays. C In the ΔH5 mutant system mimicking a class A JDP, all J-domains are already released. Therefore, Hsc70 appears to bind more randomly at all radii, suggesting that it can bind with equal probability to either DNAJB1 subunit. The resulting complexes are not active in disaggregation.

References

    1. Goedert, M., Jakes, R. & Spillantini, M. G. The synucleinopathies: twenty years on. J. Parkinsons Dis.7, S53–S71 (2017). - PMC - PubMed
    1. Cremades, N. et al. Direct observation of the interconversion of normal and toxic forms of α-synuclein. Cell149, 1048–1059 (2012). - PMC - PubMed
    1. Chartier-Harlin, M. et al. α-synuclein locus duplication as a cause of familial Parkinson’s disease. Lancet364, 1169–1171 (2004). - PubMed
    1. Lesage, S. et al. G51D α-synuclein mutation causes a novel Parkinsonian-pyramidal syndrome. Ann. Neurol.73, 459–471 (2013). - PubMed
    1. Polymeropoulos, M. H. et al. Mutation in the α-synuclein gene identified in families with Parkinson’s disease. Science276, 2045–2047 (1997). - PubMed

MeSH terms

LinkOut - more resources