. 2025 Mar 30;5(1):95.
doi: 10.1038/s43856-025-00812-y.

Preclinical extracellular matrix-based treatment strategies for myocardial infarction: a systematic review and meta-analysis

Affiliations

Preclinical extracellular matrix-based treatment strategies for myocardial infarction: a systematic review and meta-analysis

Atze van der Pol et al. Commun Med (Lond). .

Abstract

Background: Administrating extracellular matrix (ECM) to restore cardiac function post-myocardial infarction (MI) shows promise, however study variability obscures its true impact. We therefore conducted a systematic review and meta-analysis of preclinical studies to assess the effects of ECM treatments on cardiac function and tissue homeostasis post-MI.

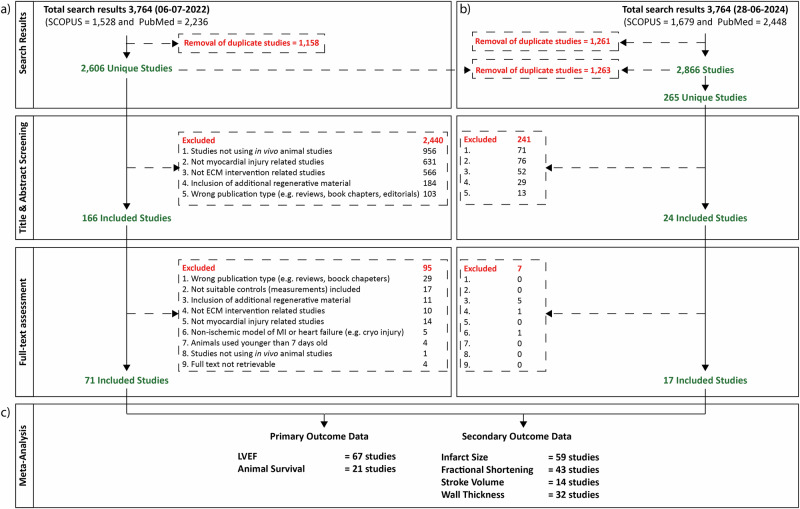
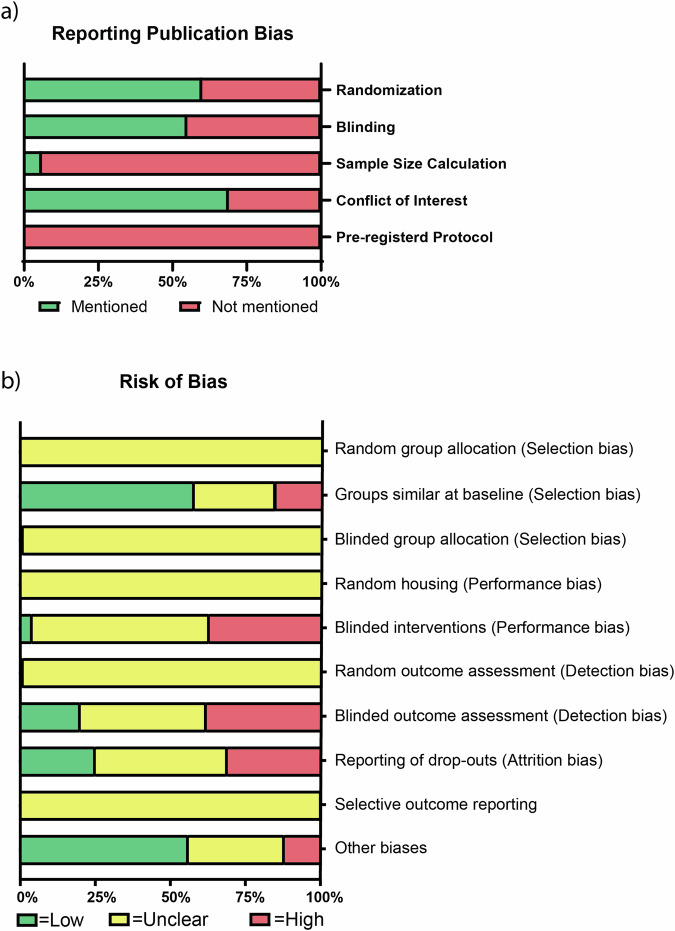
Methods: We searched PubMed and SCOPUS from inception to June 28, 2024, for animal studies describing ECM treatment post-MI (pre-registered on PROSPERO, CRD42022368400). Random effects meta-analyses compared ECM treatment to controls regarding left ventricular ejection fraction (LVEF), fractional shortening, infarct size, stroke volume, and left ventricular wall thickness. Subgroup analyses examined the influence of sex, species, ECM source, and administration method. Funnel plots and Egger's regression assessed publication bias.

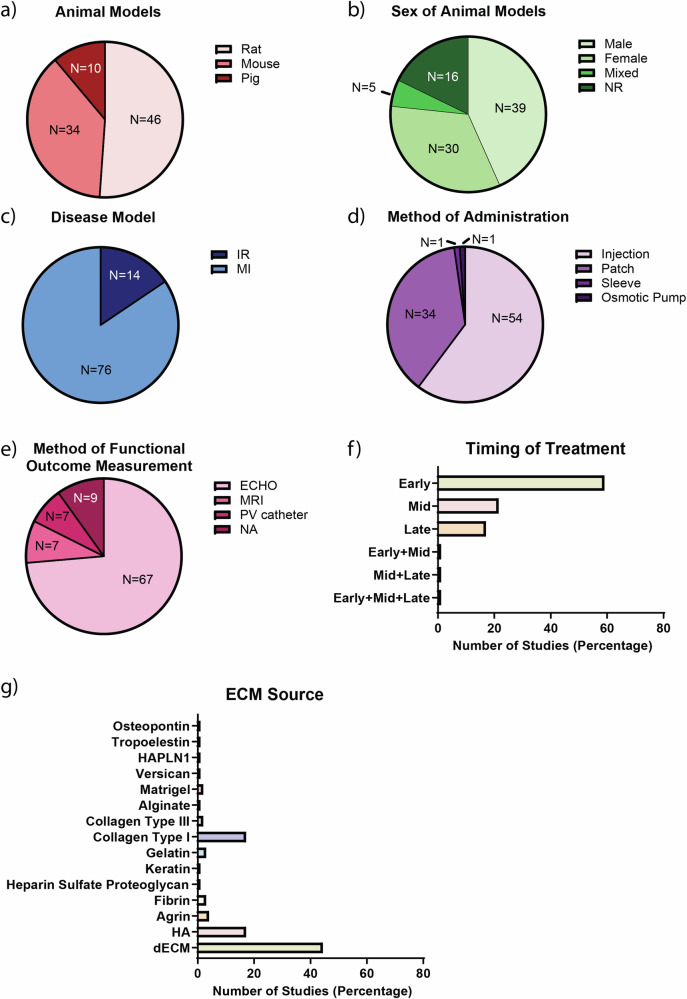
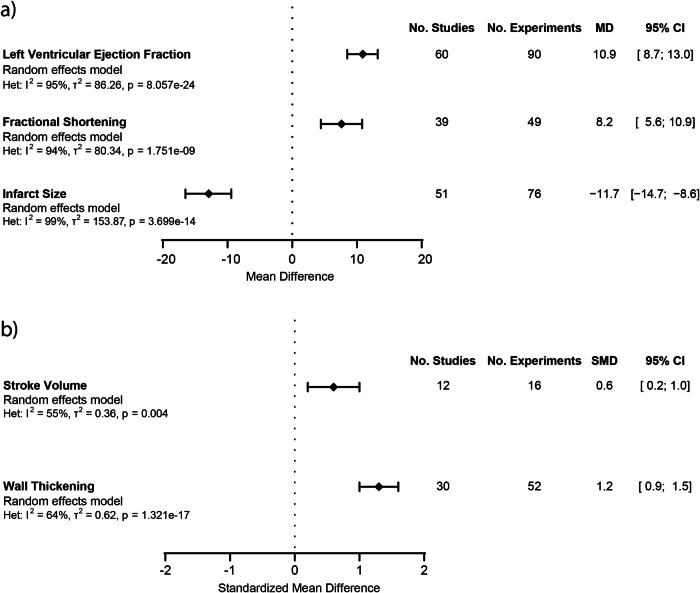
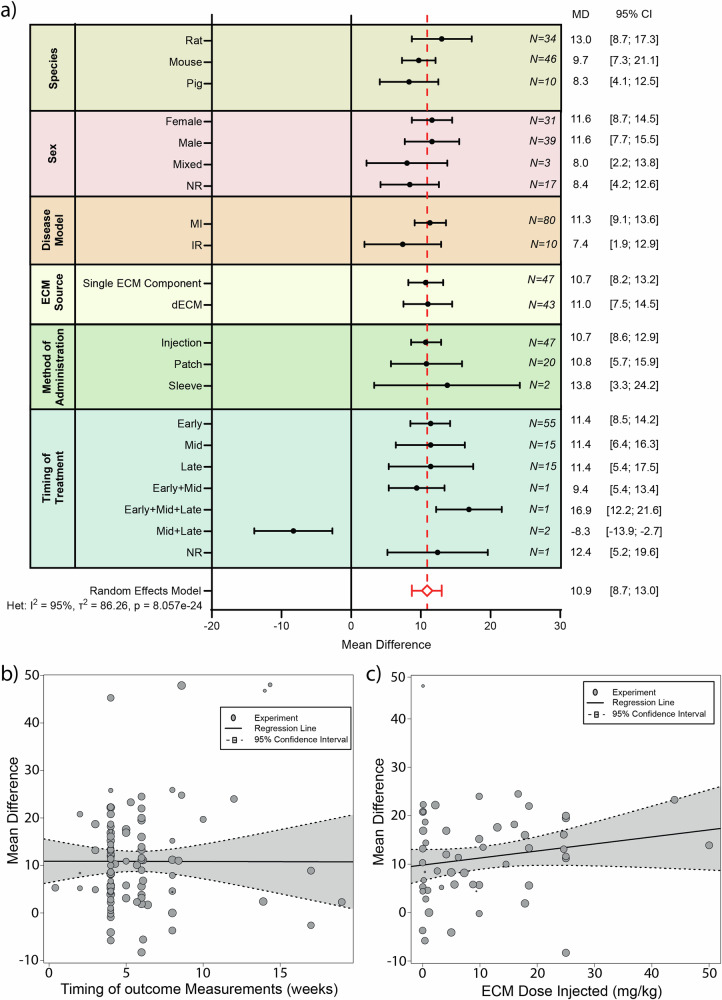
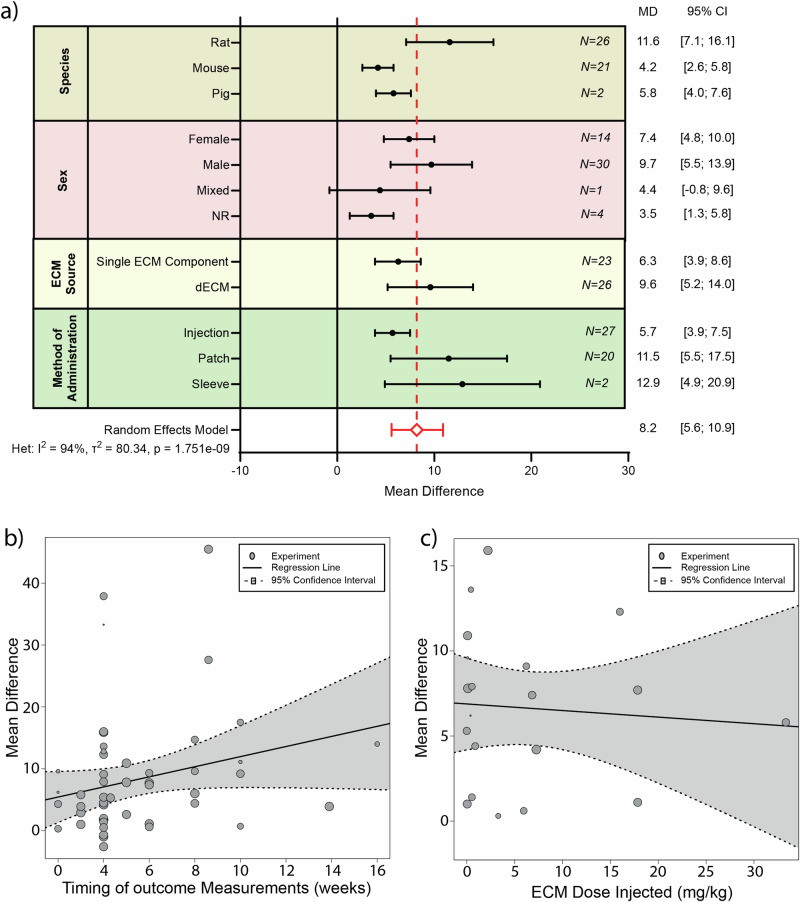
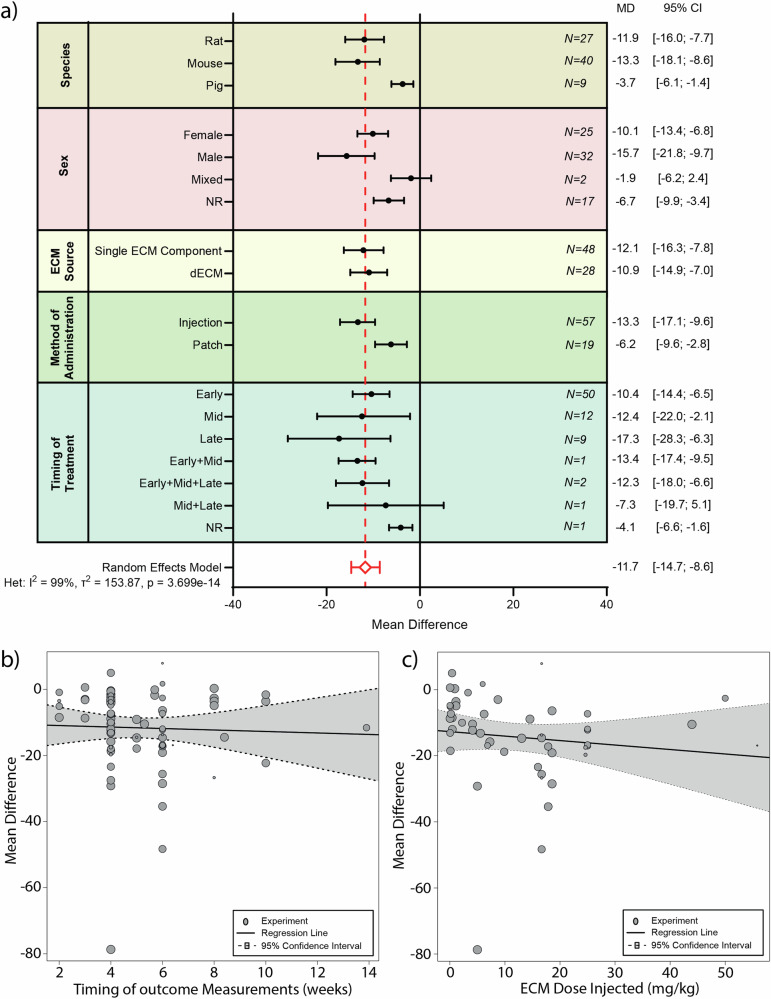
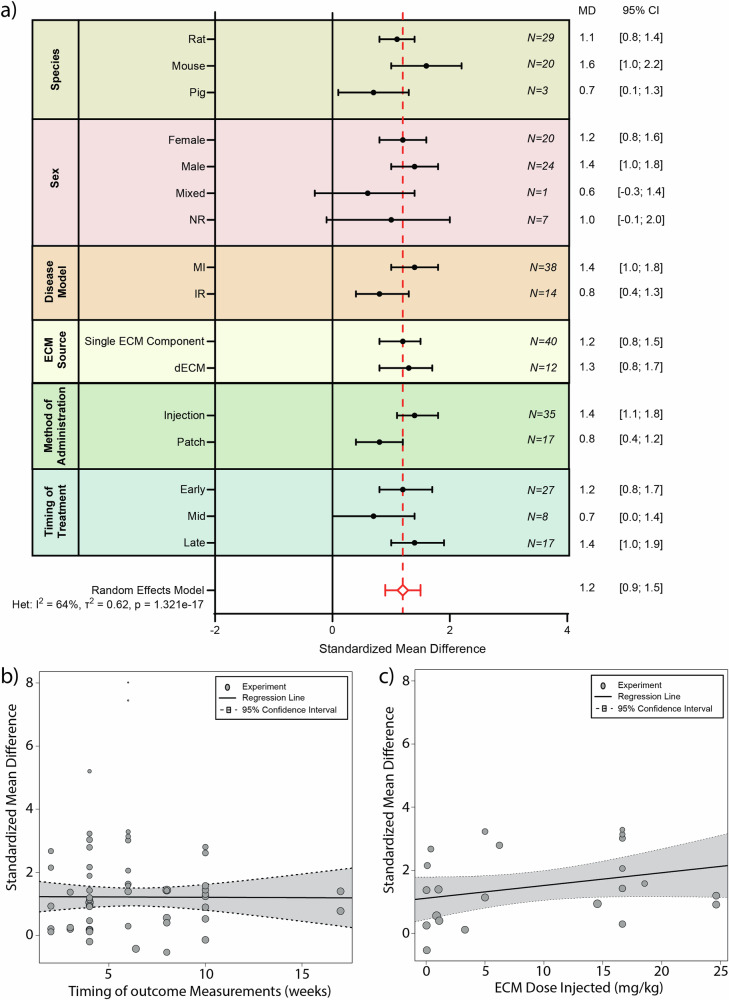
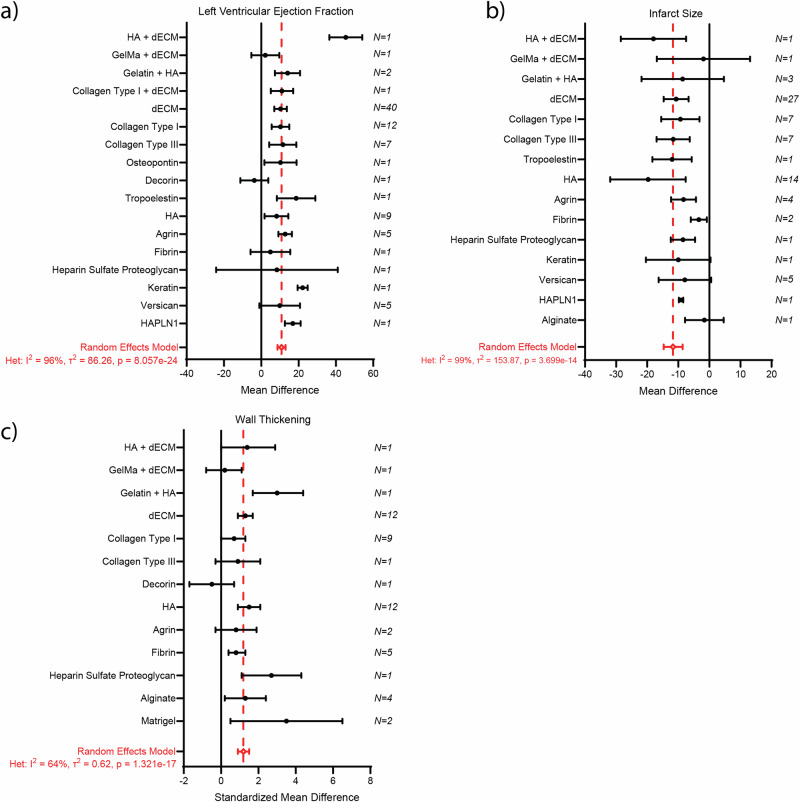
Results: We identify 88 articles which meet our inclusion criteria. These studies describe the use of rats (51%), mice (38%), and pigs (11%). 44% of studies use males, 34% females, 5% both sexes, and 17% did not report sex. Most studies employ permanent MI models (85%) over ischemia reperfusion models (15%), and deliver ECM via intramyocardial injection (59%), cardiac patch (39%), cardiac sleeve (1%), or osmotic pump (1%). Our meta-analysis demonstrates that ECM treatment significantly improves LVEF (MD: 10.9%, 95% CI: [8.7%;13.0%]; p = 8.057e-24), fractional shortening (MD: 8.2%, 95% CI: [5.6%; 10.9%]; p = 1.751e-09), stroke volume (SMD 0.6, 95% CI: [0.2;1.0], p = 0.004), left ventricular wall thickening (SMD 1.2, 95% CI: [0.9; 1.5], p = 1.321e-17), while reducing infarct size (-11.7%, 95% CI: [-14.7%;-8.6%], p = 3.699e-14). We find no significant differences between the various subgroups and no indication of publication bias.

Conclusions: ECM-based treatments significantly enhance cardiac function and tissue homeostasis in preclinical post-MI models, supporting further research toward clinical translation.

Plain language summary

A heart attack leads to loss of cells that control heartbeat and the formation of unhealthy scar tissue that can cause heart failure. Traditional treatment strategies focusing on replacing cell loss show limited improvement in heart function. Recent approaches to restore the balance in heart tissue by supplying a healthy support structure, known as the extracellular matrix, show promising results. However, differences in study design make it hard to determine effectiveness across groups. By analysing studies in animal models thoroughly, we find that treatments involved in supplying healthy support structure significantly improve heart function in preclinical models by improving the heart’s ability to pump blood and reduce scar tissue formation, regardless of species, sex, or the source of the extracellular matrix. These findings provide a strong foundation for future research focused on improving the support matrix of the heart to restore heart function.


Conflict of interest statement

Competing interests: The authors declare no competing interests.

Figures

Fig. 1
Fig. 1. PRISMA flow chart of study selection process.
a The systematic search in SCOPUS and PubMed of the 6th of July 2022, yielded 2606 unique publications. After title and abstract screening, and full-text assessment 2535 articles were excluded based on the exclusion criteria, and 71 were included. b The systematic search in SCOPUS and PubMed of the 28th of June 2024, yielded 265 new unique publications. After title and abstract screening, and full-test screening, an additional 17 studies were included. Data from 88 articles (see Supplementary Reference List) were extracted and included in downstream meta-analysis. c Meta-analyses were performed for the effect of ECM treatment on our primary outcomes (Left Ventricular Ejection Fraction – LVEF, 67 studies; Animal Survival, 21 studies) and secondary outcomes (Infarct size, 59 studies; Fractional Shortening, 43 studies; Stroke Volume, 14 studies; Wall Thickness, 32 studies).
Fig. 2
Fig. 2. Study characteristics of all included studies.
Percent distribution of (a) animal models, (b) sex of animal models, (c) disease models, (d) method of administration, (e) method of functional outcome measurement, (f) timing of treatment, and (g) ECM source. For timing of treatment “Early” denotes treatment administration within the 1st day following implementation of infarction, “Mid” treatment within 7 days, and “late” treatment administration after 7 days. N number represents number of studies. ECM extracellular matrix, NR not reported, IR ischemia reperfusion, MI myocardial infarction, ECHO echocardiography, MRI magnetic resonance imaging, PV pressure-volume, NA not applicable, HAPLN1 Hyaluronan And Proteoglycan Link Protein 1, HA hyaluronic acid, dECM decellularized extracellular matrix.
Fig. 3
Fig. 3. Reporting of key Quality indicators and Risk of Bias.
a Reporting of five quality indicators in the 88 included studies. 60% of studies reported the use of any form of randomization, 55% reported the use of blinding, and 6% reported a sample size calculation. In addition, 69% of the studies reported a conflict of interest statement, while not a single study reported using a pre-registered study protocol. b Using SYRCLE’s risk of bias tool, the risk of selection, performance, detection, attrition and other biases was assessed for the 88 studies included in this systematic review. The proportion of studies, expressed as a percentage, which have a low, unclear, or high risk of bias within the various bias categories.
Fig. 4
Fig. 4. Meta-analysis showing the effect of ECM treatment compared to control.
a The effect of ECM treatment on left ventricular ejection fraction, fractional shortening, and infarct size, expressed as pooled mean difference (MD) between ECM treatment groups and controls. b The effect of ECM treatment on stroke volume and wall thickening, expressed as pooled standardized difference (SMD) between ECM treatment groups compared to controls. Error bars represent the 95% confidence interval (CI). Data were pooled using a random effects model. No. Studies is the number of included studies that described the outcome data and were included in the meta-analysis. No. Experiments is the number of specific experiments described within the studies of which outcome data were included in the meta-analysis.
Fig. 5
Fig. 5. Subgroup analysis of various influencing factors on LVEF following ECM treatment.
a Subgroup analysis showing pooled estimates (black symbols) per stratum for the variables species, sex, disease model, ECM source, method of ECM administration and timing of ECM treatment [Early (< 1day post-MI), Mid ( = 1-7days post-MI), Late (> 7days post-MI)]. The overall pooled mean difference (MD) from a random effects model, is shown by a red dotted line and a diamond (respectively). Error bars represent 95% confidence interval (CI). N represents the number of experiments within each subgroup. b Meta-regression timing of outcome measurement and (c) ECM dose. NR not reported, MI myocardial infarction, IR ischemia reperfusion, ECM extracellular matrix, dECM decellularized extracellular matrix.
Fig. 6
Fig. 6. Subgroup analysis of various influencing factors on Fractional Shortening following ECM treatment.
a Subgroup analysis showing pooled estimates (black symbols) per stratum for the variables species, sex, ECM source, method of ECM administration. The overall pooled mean difference (MD) from a random effects model, is shown by a red dotted line and a diamond (respectively). Error bars represent 95% confidence interval (CI). N value represents the number of experiments within each subgroup. b Meta-regression for timing of outcome measurement. c Meta-regression for ECM dose. NR not reported, ECM extracellular matrix, dECM decellularized extracellular matrix.
Fig. 7
Fig. 7. Subgroup analysis of various influencing factors on Infarct Size following ECM treatment.
a Subgroup analysis showing pooled estimates (black symbols) per stratum for the variables species, sex, ECM source, method of ECM administration and timing of ECM treatment [Early (< 1day post-MI), Mid (= 1–7days post-MI), Late (>7days post-MI)]. The overall pooled mean difference (MD) from a random effects model, is shown by a red dotted line and a diamond (respectively). Error bars represent 95% confidence interval (CI). N represents the number of experiments within each subgroup. Meta-regression for timing of outcome measurement (b) and ECM dose (c). NR not reported, ECM extracellular matrix, dECM decellularized extracellular matrix.
Fig. 8
Fig. 8. Subgroup analysis of various influencing factors on Wall Thickening following ECM treatment.
a Subgroup analysis showing pooled estimates (black symbols) per stratum for the variables species, sex, disease model, ECM source, method of ECM administration, and timing of ECM treatment [Early (<1day post-MI), Mid (= 1-7days post-MI), Late (>7days post-MI)]. The overall pooled standardized mean difference (SMD) from a random effects model, is shown by a red dotted line and a diamond (respectively). Error bars represent 95% confidence interval (CI). N represents the number of experiments within each subgroup. Meta-regression for timing of outcome measurement (b) and ECM dose (c). NR not reported, MI myocardial infarction, IR ischemia reperfusion, ECM extracellular matrix, dECM decellularized extracellular matrix.
Fig. 9
Fig. 9. Subgroup analysis for ECM source (individual components).
Subgroup analysis for individual ECM components effect on left ventricular ejection fraction (a) Infarct size (b) and wall thickness (c). For each ECM component, black symbols represent the mean difference (MD) or standard mean difference (SMD). The overall pooled MD or SMD from a random effects model is shown by red dotted line and diamond (respectively). Error bars represent the 95% confidence interval (CI). N is the number of independent comparisons (studies) within each subgroup. ECM extracellular matrix, HA hyaluronic acid, dECM decullarized extracellular matrix, HAPLN1 Hyaluronan And Proteoglycan Link Protein 1.

Similar articles

References

    1. Tsao, C. W. et al. Heart Disease and Stroke Statistics—2022 Update: A Report From the American Heart Association. Circulation145, e153–e639 (2022). - PubMed
    1. McDonagh, T. A. et al. 2021 ESC Guidelines for the diagnosis and treatment of acute and chronic heart failure. Eur. Heart J.42, 3599–3726 (2021). - PubMed
    1. Porrello, E. R. et al. Transient regenerative potential of the neonatal mouse heart. Science (1979)331, 1078–1080 (2011). - PMC - PubMed
    1. Ye, L. et al. Early Regenerative Capacity in the Porcine Heart. Circulation138, 2798–2808 (2018). - PubMed
    1. Humeres, C. & Frangogiannis, N. G. Fibroblasts in the Infarcted, Remodeling, and Failing Heart. JACC Basic Transl. Sci.4, 449–467 (2019). - PMC - PubMed

LinkOut - more resources