. 2024 Nov 28;12(4):nwae438.
doi: 10.1093/nsr/nwae438. eCollection 2025 Apr.

Out-of-Africa migration and clonal expansion of a recombinant Epstein-Barr virus drives frequent nasopharyngeal carcinoma in southern China

Affiliations

Out-of-Africa migration and clonal expansion of a recombinant Epstein-Barr virus drives frequent nasopharyngeal carcinoma in southern China

Xinyi Zhang et al. Natl Sci Rev. .

Abstract

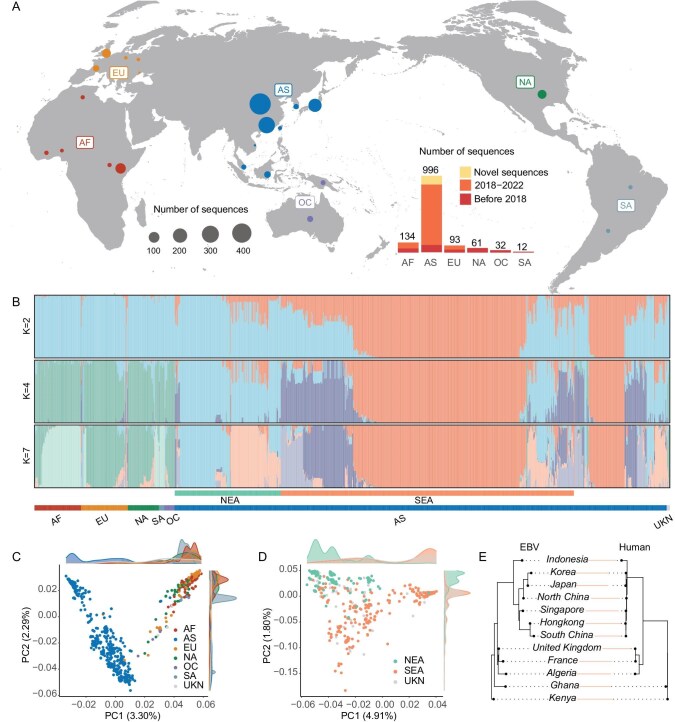
While Epstein-Barr virus (EBV) infection is ubiquitous globally, a high-risk EBV subtype associated with the extremely high incidence of nasopharyngeal carcinoma (NPC) was found in southern China, but the evolution history of EBV in humans and the origin of this high-risk subtype remains enigmatic. By obtaining one of the largest datasets of EBV genomes across the world, we found that EBV had an evolutionary history matching the out-of-Africa migration of humans. Within the high-risk subtype from southern China, we identified a rapidly expanding clonal strain originating from a recombination event between EBV strains from northern and southern Chinese around 4000 years ago, followed by strong Darwinian evolution with a fitness advantage of 4%. The clonal strain has almost doubled the risk for NPC compared to the high-risk subtype and explained around 66% of the NPCs, representing the highest risk factor for NPC identified so far. Taken together, we unraveled a strong co-evolution history between EBV and humans where human migration and admixture triggered subsequent recombination and expansion of a highly advantageous EBV strain, leading to a cancer epidemic in southern China.

Keywords: Epstein-Barr virus; Nasopharyngeal carcinoma; co-evolution, adaptation; out-of-Africa migration; recombination.


Figures

Figure 1.
Figure 1.
Population structure and history of EBV. (A) Distribution of EBV strains across the world. The inset plot displays the sample-size distribution across time and geography. Sequences with unknown geographic origin were omitted from the plot. (B) Population structure analysis of all the type 1 strains (n = 1205) with varying number of population groupings (K = 2,4, or 7). Strains were labeled with their geographic origin. AF: Africa, EU: Europe, NA: North America, SA: South America, OC: Oceania, AS: Asia, UKN: Unknown geography, NEA: North East Asia, SEA: South East Asia. (C) Principal component analysis (PCA) of the type 1 EBV strains. The first two components explaining 3.30% and 2.29% of the total variance, respectively. Strains were labeled according to their geographic origin. (D) Principal component analysis (PCA) of the type 1 strains from East Asia. Strains from northern and southern China were labelled in different colors. (E) Maximum likelihood tree of the EBV populations (left) and humans (right) constructed using TreeMix. The two trees had minor differences in topology with a Robinson-Fould distance of 2. Review drawing number: GS 京 (2025) 0056号.
Figure 2.
Figure 2.
The geographic distribution and the risk association of clonal strain. (A) Reconstructed phylogenetic tree from Gubbins after filtering putative recombinant regions (see Methods). A heatmap representing the pairwise similarity between all strains is shown. A group of highly similar sequences (denoted as the clonal clade) is identified (in red block). High risk strain is defined as strains carrying C-C-T alleles at position 162215, 162476 and 163364. (B) Frequencies of the clonal strain in healthy individuals across East Asia. (C) The odds ratio of NPC risk for the clonal, NC-HRS as well as other strains in the population. (D) The geographic distribution of NPC incidence (age-standardized incidence rate or ASR) across East Asia (see Methods). Review drawing number: GS 京 (2025) 0056号.
Figure 3.
Figure 3.
The recombination history of the clonal strain. (A) Sequence comparison between the clonal clade and all the other sequences. The phylogenetic relationship on the left is the same as presented in Fig. 2A, but with the clonal clade collapsed as a red triangle. Three distinctive clades (clonal clade C1, subgroup of southern strains S1 and a subgroup of northern strains N1) are labelled on the phylogenetic tree. Heatmap of rank values of the sequence similarity to the clonal strain are plotted. Regions with high similarity (i.e. high rank values) are boxed in black rectangles. Repeat regions were marked on the top panel. (B) Population differentiation (i.e. Fst) between the clonal clade (C1) and other subgroups (i.e. N1 and S1). The horizontal bar on top of the panel is the putative recombination track inferred from RDP with the blue color representing the S1 ancestry and orange color representing the N1 ancestry. (C) Output from RDP. The y-axis is the pairwise identity between three consensus sequences derived from C1, N1 and S1, while the x-axis is the coordinate of the genome. The same horizontal bar was plotted as in panel B.
Figure 4.
Figure 4.
The timing of the clonal clade. (A) The substitution rate estimates (s/s/y) under different parameter settings. The models are specified as ‘clock model’_‘population prior’ where clock models can be strict clock (SC) or optimized relaxed clock (ORC) and population priors can be constant, exponential or Bayesian skyline (BS). The best-fit models are marked as *. (B) tMRCA (kyr) of all the type 1 EBV sequences under different parameter settings. (C) tMRCA of the clonal clade under different parameter settings. (D) The dated phylogeny with major nodes as well as calibration point labelled. (E) The folded site frequency spectrum of the EBV genomes in Hong Kong. The expected and observed values were plotted as discrete counts. The inset figures show the neutral distribution of Fu and Li's D* and F* values (95% CI are shaded in purple) and the observed values (as red vertical lines). (F) Frequency trajectories of the recombinant strain (i.e. C1) given the estimated time of origin (4095, CI = [2133, 6344]) and haploid selection model. The estimated selective coefficient was labelled with nearby different trajectories. (G) The prevalence of NPC cases as a function of the frequency of the clonal clade through time (in yellow, see Methods). The blue and red dashed lines represent the prevalence of NPC attributable to the clonal (red) and non-clonal strains (blue). (H) The population attributable fraction (PAF) of NPC due to the clonal strain (in red) and non-clonal strains (in blue) (see Methods).

References

    1. Young LS, Yap LF, Murray PG. Epstein-Barr virus: more than 50 years old and still providing surprises. Nat Rev Cancer 2016; 16: 789–802.10.1038/nrc.2016.92 - DOI - PubMed
    1. Bjornevik K, Cortese M, Healy BC et al. Longitudinal analysis reveals high prevalence of Epstein-Barr virus associated with multiple sclerosis. Science 2022; 375: 296–301.10.1126/science.abj8222 - DOI - PubMed
    1. Lanz TV, Brewer RC, Ho PP et al. Clonally expanded B cells in multiple sclerosis bind EBV EBNA1 and GlialCAM. Nature 2022; 603: 321–7.10.1038/s41586-022-04432-7 - DOI - PMC - PubMed
    1. Kanda T, Yajima M, Ikuta K. Epstein-Barr virus strain variation and cancer. Cancer Sci 2019; 110: 1132–9.10.1111/cas.13954 - DOI - PMC - PubMed
    1. Barrie W, Yang Y, Irving-Pease EK et al. Elevated genetic risk for multiple sclerosis emerged in steppe pastoralist populations. Nature 2024; 625: 321–8.10.1038/s41586-023-06618-z - DOI - PMC - PubMed

LinkOut - more resources