. 2025 Mar 1:27:1034-1047.
doi: 10.1016/j.csbj.2025.02.008. eCollection 2025.

VarMeter2: An enhanced structure-based method for predicting pathogenic missense variants through Mahalanobis distance

Affiliations

VarMeter2: An enhanced structure-based method for predicting pathogenic missense variants through Mahalanobis distance

Shiho Ohno et al. Comput Struct Biotechnol J. .

Abstract

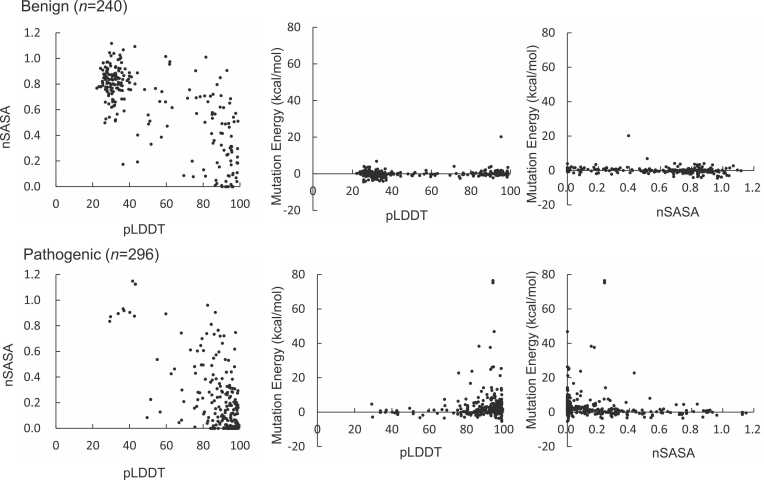
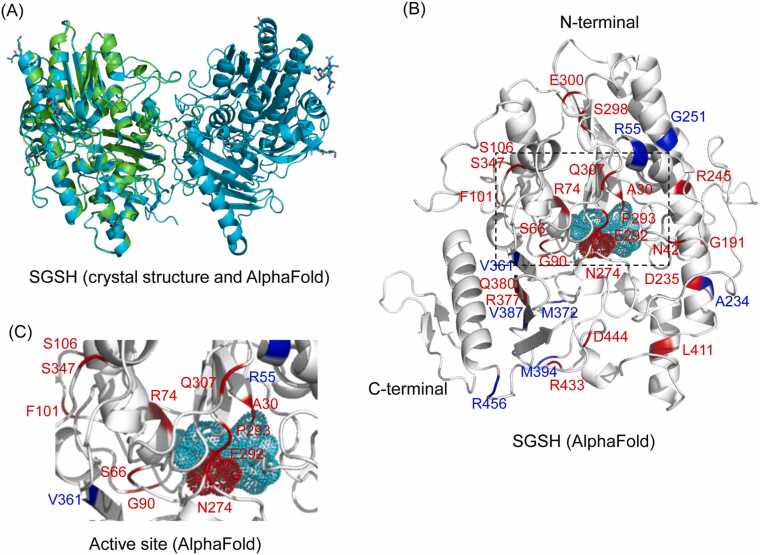
Various computational methods have been developed to predict the pathogenicity of missense variants, which is crucial for diagnosing rare diseases. Recently, we introduced VarMeter, a diagnostic tool for predicting variant pathogenicity based on normalized solvent-accessible surface area (nSASA) and mutation energy calculated from AlphaFold 3D models, and validated it on arylsulfatase L. To evaluate the broader applicability of VarMeter and enhance its predictive accuracy, here we analyzed 296 pathogenic and 240 benign variants extracted from the ClinVar database. By comparing structural features including nSASA, mutation energy, and predicted local distance difference test (pLDDT) score, we identified distinct characteristics between pathogenic and benign variants. These features were used to develop VarMeter2, which classifies variants based on Mahalanobis distance. VarMeter2 achieved a prediction accuracy of 82 % for the ClinVar dataset, a marked improvement over the original VarMeter (74 %), and 84 % for published missense variants of N-sulphoglucosamine sulphohydrolase (SGSH), an enzyme associated with Sanfillippo syndrome A. Application of VarMeter 2 to SGSH variants in our clinical database identified a novel SGSH variant, Q365P, as pathogenic. The recombinant Q365P protein lacked enzymatic activity as compared with wild-type SGSH. Furthermore, it was largely retained in the endoplasmic reticulum and failed to reach the Golgi, probably due to misfolding. Protein stability assays confirmed reduced stability of the variant, further explaining its loss of function. Consistently, the patient homozygous for this variant was diagnosed with Sanfilippo syndrome A. These results underscore the predictive power and versatility of VarMeter2 in assessing the pathogenicity of missense variants.

Keywords: Missense variant; Mutation energy; N-sulphoglucosamine sulphohydrolase; Pathogenicity; Solvent accessible surface area; pLDDT.


Conflict of interest statement

The authors declare that they have no known competing financial interests or personal relationships that could have appeared to influence the work reported in this paper.

Figures

None
VarMeter2 for the prediction of pathogenic missense variants
Fig. 1
Fig. 1
Distribution of benign and pathogenic variants by pLDDT score and by allele frequency. (A) Benign and pathogenic variants were grouped into four confidence levels: very low (pLDDT<50), low (50 90). (B) Benign and pathogenic variants were grouped into five levels of allele frequency (AF): AF< 0.000001, 0.000001  0.001. In (A) and (B), red bars indicate pathogenic variants; blue bars indicate benign variants.
Fig. 2
Fig. 2
Scatter plots of nSASA, mutation energy, and pLDDT for variants from the ClinVar dataset. Upper panels, benign variants (n = 240); lower panels, pathogenic variants (n = 296). Each plot illustrates the relationships between these three parameters, highlighting differences between benign and pathogenic variant behavior.
Fig. 3
Fig. 3
Conceptual diagram of variant classification using Mahalanobis distance. The means of three variables (mutation energy, nSASA and pLDDT) are calculated for the pathogenic (red) and benign (blue) groups, denoted as x®P,y®P,z®P and x®B,y®B,z®B, respectively. The Mahalanobis distances (DP and DB) are calculated for each data point xi,yi,zi using the inverse covariance matrix (see Materials and Methods). A variant is classified as pathogenic if DP < DB and as benign if DP > DB.
Fig. 4
Fig. 4
Prediction accuracy of VarMeter, VarMeter2, AlphaMissense, and CADD methods for the ClinVar dataset based on allele frequency. (A) Prediction accuracy for pathogenic variants (n = 296). (B) Prediction accuracy for benign variants (n = 240). (C) overall prediction accuracy for all variants (pathogenic and benign, n = 536).
Fig. 5
Fig. 5
Structural comparison and variant mapping of human SGSH. (A) Crystal structure of human SGSH dimer resolved at 2 Å resolution (PDB ID: 4MHX, cyan) and the 3D AlphaFold model of monomeric human SGSH (green). The AlphaFold model is superimposed on the A chain of the crystal structure for comparison. (B) AlphaFold model of monomeric wild-type SGSH with missense variants mapped onto the structure. The positions of pathogenic and benign variants are highlighted in red and blue, respectively. The active site residues of SGSH (D31, D32, C70 and D273) are shown as blue mesh, while N274 is shown as red mesh. (C) Detailed view of the SGSH active site from the AlphaFold model, corresponding to the dotted box in (B). The structure is depicted in cartoon representation; the figure was generated using PyMOL software.
Fig. 6
Fig. 6
Enzymatic activity of the wild-type and Q365P SGSH proteins. (A) SGSH mRNA levels in HEK293-WT and HEK293-Q365P cells stably expressing the respective wild-type and Q365P SGSH-FLAG fusion proteins, were analyzed by real-time PCR and normalized to GAPDH mRNA in the same sample. Expression levels are shown relative to those of control HEK293 cells (1.0) in which an empty vector was transfected. **p < 0.001 by one-way ANOVA followed by Tukey-Kramer test (n = 3). (B) Western blot analysis of wild-type (WT) and Q365P SGSH FLAG fusion proteins in the culture supernatant (sup) and cell lysate (CL) from HEK293-WT cells and HEK293-Q365P cells using anti-FLAG. For cell lysates, 10 µg of total protein was applied; for supernatants, 5 % of WT SGSH-FLAG or 5 % or 10 % of immuno-precipitated Q365P SGSH-FLAG was applied. (left) Representative Western blots. (right) Quantification of the protein bands in each cell lysate. Protein levels are shown relative to those of HEK293-WT cells (1.0). *p < 0.05 by Student’s t-test (n = 3). (C) Activity of the Q365P SGSH protein. (left) Western blot analysis using anti-FLAG of purified wild-type (WT) and Q365P SGSH FLAG fusion proteins used in the activity assay (n = 3). (middle) 4-MU production by Q365P SGSH is normalized by the protein amount used and shown relative to that of WT SGSH. Ratios are given as mean ± S.E. of three independent experiments. *p < 0.05 by Student’s t-test. (right top) Scheme of activity assay. Production of 4-MU after SGSH enzymatic reaction (16 h) using 4MU-GlcNS as a substrate, followed by α-glucosidase reaction (24 h). (right bottom) The fluorescence spectra of each sample are shown. The amount of 4-MU was determined from the fluorescence intensity at 445 nm. (D and E) Three-dimensional confocal images of the intracellular localization of wild-type (WT) and Q365P SGSH-FLAG fusion proteins in HEK293-WT cells and HEK293-Q365P cells, respectively. SGSH (green) and nucleus (blue) are labeled with anti-FLAG and Hoechst 33258, respectively. Cis-Golgi body (magenta in D) and endoplasmic reticulum (ER; magenta in E) are labeled with anti-GOLPH2 and anti-CANX, respectively. Colocalization of SGSH/GOLPH2 (D) or SGSH/CANX (E) is indicated in white in the second panels from the right. Surface rendering models of the colocalization image are shown in the rightmost panels. Scale bar: 10 µm. (F and G) Quantitative analysis of SGSH colocalization with Golgi and ER markers. The ratio of SGSH colocalizing with GOLPH2 (F) or CANX (G) to total SGSH in HEK293-WT cells and HEK293-Q365P cells is shown. **p < 0.001, n.s.: not significant by Student’s t-test. (H) CHX chase assay performed in HEK293-WT and HEK293-Q365P cells. Cells were incubated for 0 hours (untreated), 2, 4, and 8 hours (h) with 100 µg/mL of CHX. (Upper) Representative Western blot images of wild-type (WT) and Q365P SGSH-FLAG fusion proteins detected using anti-FLAG antibody. (Lower) Quantification of protein bands normalized to GAPDH and expressed relative to the 0-hour sample. *p < 0.05 by Student’s t-test (n = 3). (I) Stability of the wild-type (WT) and Q365P SGSH proteins. (left) SDS–PAGE analysis of SGSH proteins treated with trypsin. Black arrowhead indicates full-length SGSH; red arrowhead indicates the trypsin-resistant fragment. (right) Proportion of trypsin-resistant fragment remaining after trypsin digestion, calculated as the intensity of the trypsin digestion-resistant band relative to that of full-length SGSH in untreated samples. The values shown have been normalized to WT SGSH. ***p < 0.0001 by Student’s t-test (n = 3).
<b>Supplemental Movie S1.</b> Three-dimensional confocal image of a wild-type SGSH-expressing cell with visualization of the cis-Golgi body. SGSH protein, cis-Golgi body, and the nucleus are indicated in green, magenta, and blue, respectively. Movie corresponds to the image in Fig. 6D.
Supplemental Movie S1. Three-dimensional confocal image of a wild-type SGSH-expressing cell with visualization of the cis-Golgi body. SGSH protein, cis-Golgi body, and the nucleus are indicated in green, magenta, and blue, respectively. Movie corresponds to the image in Fig. 6D.
<b>Supplemental Movie S2.</b> Surface rendering model of a wild-type SGSH-expressing cell in which SGSH protein and GOLPH2 are colocalized. Colocalization is indicated in white; the nucleus is indicated in blue. Movie corresponds to the image in Fig. 6D.
Supplemental Movie S2. Surface rendering model of a wild-type SGSH-expressing cell in which SGSH protein and GOLPH2 are colocalized. Colocalization is indicated in white; the nucleus is indicated in blue. Movie corresponds to the image in Fig. 6D.
<b>Supplemental Movie S3.</b> Three-dimensional confocal image of a Q365P SGSH-expressing cell with visualization of the cis-Golgi body. SGSH protein, cis-Golgi body, and the nucleus are indicated in green, magenta, and blue, respectively. Movie corresponds to the image in Fig. 6D.
Supplemental Movie S3. Three-dimensional confocal image of a Q365P SGSH-expressing cell with visualization of the cis-Golgi body. SGSH protein, cis-Golgi body, and the nucleus are indicated in green, magenta, and blue, respectively. Movie corresponds to the image in Fig. 6D.
<b>Supplemental Movie S4.</b> Surface rendering model of a Q365P SGSH-expressing cell in which SGSH protein and GOLPH2 are colocalized scarcely. Colocalization is indicated in white; the nucleus is indicated in blue. Movie corresponds to the image in Fig. 6D.
Supplemental Movie S4. Surface rendering model of a Q365P SGSH-expressing cell in which SGSH protein and GOLPH2 are colocalized scarcely. Colocalization is indicated in white; the nucleus is indicated in blue. Movie corresponds to the image in Fig. 6D.
<b>Supplemental Movie S5.</b> Three-dimensional confocal image of a wild-type SGSH-expressing cell with visualization of the ER. SGSH protein, ER, and the nucleus are indicated in green, magenta, and blue, respectively. Movie corresponds to the image in Fig. 6E.
Supplemental Movie S5. Three-dimensional confocal image of a wild-type SGSH-expressing cell with visualization of the ER. SGSH protein, ER, and the nucleus are indicated in green, magenta, and blue, respectively. Movie corresponds to the image in Fig. 6E.
<b>Supplemental Movie S6.</b> Surface rendering model of a wild-type SGSH-expressing cell in which SGSH protein and CANX are colocalized. Colocalization is indicated in white; the nucleus is indicated in blue. Movie corresponds to the image in Fig. 6E.
Supplemental Movie S6. Surface rendering model of a wild-type SGSH-expressing cell in which SGSH protein and CANX are colocalized. Colocalization is indicated in white; the nucleus is indicated in blue. Movie corresponds to the image in Fig. 6E.
<b>Supplemental Movie S7.</b> Three-dimensional confocal image of a Q365P SGSH-expressing cell with visualization of the ER. SGSH protein, ER, and the nucleus are indicated in green, magenta, and blue, respectively. Movie corresponds to the image in Fig. 6E.
Supplemental Movie S7. Three-dimensional confocal image of a Q365P SGSH-expressing cell with visualization of the ER. SGSH protein, ER, and the nucleus are indicated in green, magenta, and blue, respectively. Movie corresponds to the image in Fig. 6E.
<b>Supplemental Movie S8.</b> Surface rendering model of a Q365P SGSH-expressing cell in which SGSH protein and CANX are colocalized. Colocalization is indicated in white; the nucleus is indicated in blue color. Movie corresponds to the image in Fig. 6E.
Supplemental Movie S8. Surface rendering model of a Q365P SGSH-expressing cell in which SGSH protein and CANX are colocalized. Colocalization is indicated in white; the nucleus is indicated in blue color. Movie corresponds to the image in Fig. 6E.

References

    1. Keskin Karakoyun H., Yuksel S.K., Amanoglu I., Naserikhojasteh L., Yesilyurt A., et al. Evaluation of AlphaFold structure-based protein stability prediction on missense variations in cancer. Front Genet. 2023;14 - PMC - PubMed
    1. David A., Sternberg M.J.E. Protein structure-based evaluation of missense variants: resources, challenges and future directions. Curr Opin Struct Biol. 2023;80 - PubMed
    1. Aoki E., Manabe N., Ohno S., Aoki T., Furukawa J., et al. Predicting the pathogenicity of missense variants based on protein instability to support diagnosis of patients with novel variants of ARSL. Mol Genet Metab Rep. 2023;37 - PMC - PubMed
    1. Jumper J., Evans R., Pritzel A., Green T., Figurnov M., et al. Highly accurate protein structure prediction with AlphaFold. Nature. 2021;596:583–589. - PMC - PubMed
    1. Varadi M., Anyango S., Deshpande M., Nair S., Natassia C., et al. AlphaFold protein structure database: massively expanding the structural coverage of protein-sequence space with high-accuracy models. Nucleic Acids Res. 2022;50:D439–D444. - PMC - PubMed

LinkOut - more resources