Factors associated with pulmonary complications after hepatectomy and establishment of nomogram: A real-world retrospective study
- PMID: 40160904
- PMCID: PMC11949397
- DOI: 10.4103/ija.ija_885_24
Factors associated with pulmonary complications after hepatectomy and establishment of nomogram: A real-world retrospective study
Abstract
Background and aims: Hepatectomy is currently the most effective way to treat liver diseases, and its safety has observably improved. However, the incidence of postoperative complications (POCs) remains high. Therefore, exploring the related influencing factors helps identify high-risk groups early and improve patient prognosis.
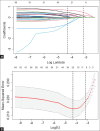
Methods: Clinical data were retrospectively collected from a real-world setting. Patients were divided into two groups based on the incidence of postoperative pulmonary complications (PPCs). Univariate analysis, LASSO regression, and logistic regression were applied to analyse the correlation between PPCs and perioperative indicators. A nomogram prediction model was constructed, whose discrimination, accuracy, and clinical effectiveness were evaluated.
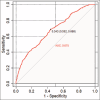
Results: The incidence of PPCs was 36.33% among the 1244 patients in this study. The total length of hospital stay and perioperative mortality in the PPCs group were markedly higher (P < 0.001) than in the non-PPCs group. Logistic regression showed that surgical method [odds ratio (OR) =2.469 (95% CI: 1.665, 3.748); P < 0.001], duration of surgery [OR = 1.003 (95% CI: 1.002, 1.005); P < 0.001], postoperative patient destination [OR = 1.453 (95% CI: 1.115, 1.893); P = 0.006], and postoperative international normalised ratio (INR) [OR = 2.245 (95% CI: 1.287, 4.120); P = 0.007] were independent risk factors of PPCs; the number of clamping [OR = 0.988 (95% CI: 0.980, 0.995); P = 0.001] was an independent protective factor of PPCs. The area under the receiver operating characteristic (ROC) curve was 0.675 (95% CI: 0.638, 0.703), the consistency index of the calibration curve was 0.675 (95% CI: 0.641, 0.703), and the Hosmer-Lemeshow goodness-of-fit test yielded P = 0.327.
Conclusions: In this study, the incidence of PPCs after hepatectomy was the highest. Our nomogram model can predict the probability of PPCs after hepatectomy.
Keywords: Factors; hepatectomy; nomogram; postoperative pulmonary complications; real-world study; univariate analysis.
Copyright: © 2025 Indian Journal of Anaesthesia.
Conflict of interest statement
There are no conflicts of interest.
Figures


Similar articles
-
Risk factors and predictive model for pulmonary complications in patients transferred to ICU after hepatectomy.BMC Surg. 2023 Jun 3;23(1):150. doi: 10.1186/s12893-023-02019-1. BMC Surg. 2023. PMID: 37270566 Free PMC article.
-
Development and validation of a nomogram for predicting pulmonary complications in elderly patients undergoing thoracic surgery.Aging Clin Exp Res. 2024 Oct 5;36(1):197. doi: 10.1007/s40520-024-02844-1. Aging Clin Exp Res. 2024. PMID: 39368046 Free PMC article.
-
Nomogram for predicting postoperative pulmonary complications in spinal tumor patients.BMC Anesthesiol. 2024 Feb 8;24(1):56. doi: 10.1186/s12871-024-02443-7. BMC Anesthesiol. 2024. PMID: 38331767 Free PMC article.
-
Analysis of postoperative pulmonary complications after gastrectomy for gastric cancer: development and validation of a nomogram.Front Surg. 2023 Dec 21;10:1308591. doi: 10.3389/fsurg.2023.1308591. eCollection 2023. Front Surg. 2023. PMID: 38186389 Free PMC article.
-
A Risk Prediction Nomogram Model for Postoperative Pulmonary Complications in Children Aged 0-6 years.Risk Manag Healthc Policy. 2025 Mar 29;18:1085-1097. doi: 10.2147/RMHP.S507147. eCollection 2025. Risk Manag Healthc Policy. 2025. PMID: 40177648 Free PMC article.
References
-
- Ford I, Norrie J. Pragmatic trials. N Engl J Med. 2016;375:454–63. - PubMed
-
- Sung H, Ferlay J, Siegel RL, Laversanne M, Soerjomataram I, Jemal A, et al. Global Cancer Statistics 2020: GLOBOCAN estimates of incidence and mortality worldwide for 36 cancers in 185 countries. CA Cancer J Clin. 2021;71:209–49. - PubMed
LinkOut - more resources
Full Text Sources
