. 2025 Feb 8;6(1):zpaf009.
doi: 10.1093/sleepadvances/zpaf009. eCollection 2025.

Tonic-clonic seizures induce hypersomnia and suppress rapid eye movement sleep in mouse models of epilepsy

Affiliations

Tonic-clonic seizures induce hypersomnia and suppress rapid eye movement sleep in mouse models of epilepsy

Ruizhi Wang et al. Sleep Adv. .

Abstract

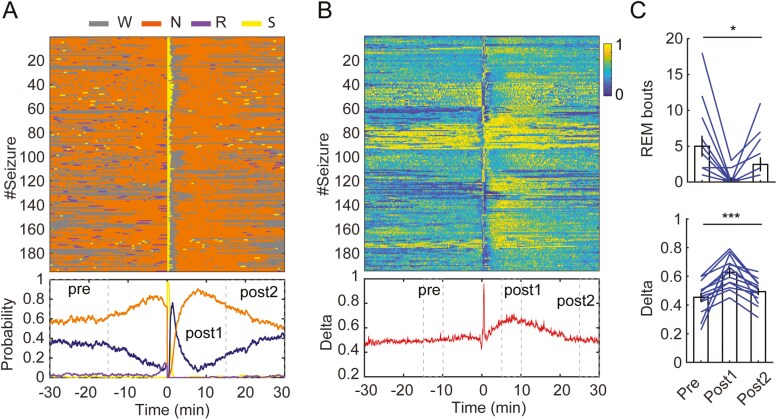
The reciprocal relationship between sleep and epilepsy has been reported by numerous clinical studies. However, the underlying neural mechanisms are poorly understood. Animal models of epilepsy are powerful tools to tackle this question. A lagging research area is the understudied sleep in epilepsy models. Here, we characterize sleep architecture and its relationship with seizures in a mouse model of sleep-related hypermotor epilepsy, caused by mutation of KCNT1. We demonstrated that nocturnal tonic-clonic seizures induce more non-rapid eye movement (NREM) sleep but suppress rapid eye movement (REM) sleep, resulting in altered sleep architecture in this mouse model. Importantly, the seizure number is quantitatively anticorrelated with the amount of REM sleep. Strikingly, this modulation of NREM and REM sleep states can be repeated in another mouse model of epilepsy with diurnal tonic-clonic seizures. Together, our findings provide evidence from rodent models to substantiate the close interplay between sleep and epilepsy, which lays the ground for mechanistic studies.

Keywords: EEG; Kcnt1; Sleep; epilepsy; tonic-clonic seizures.


Figures

Figure 1.
Figure 1.
Seizures in Kcnt1 mice occur during non-rapid eye movement (NREM) sleep. (A) Representative recording session showing seizures occurring during NREM sleep. From top to bottom: color-coded brain states, EEG power spectrogram (0–25 Hz), EMG amplitude in a Kcnt1 homozygous mouse. (B) Representative example showing EEG spectrogram, EEG trace, and EMG trace during a combinatorial seizure event, including tonic seizure (TS) and generalized tonic-clonic seizure (GTCS). (C) Box plot showing the distribution of seizure durations in Kcnt1 homozygous mice. The box plot indicates the range, interquartile range, and median (line inside the box). (D) EEG spectral power during early (the first half period, blue line) and late (the second half period, orange line) stages of seizures (195 evens used). The gray line indicates the averaged (Ave.) power during the whole seizure period. (E) Quantification of the probability of each brain state (W-wake, NR-NREM, and R-REM) prior to seizures in Kcnt1 homozygous mice (n = 14 animals). Data are mean ± SEM. ***p < 0.001 (one-way ANOVA with post hoc Tukey HSD test, p < 0.001 between W and NR, and p < 0.001 between NR and R).
Figure 2.
Figure 2.
Sleep alterations in Kcnt1 mice. (A) 24-hour zeitgeber time plots showing the total duration of wakefulness (left), non-rapid eye movement (NREM) sleep (middle), and rapid eye movement (REM) sleep time (right) per hour in Kcnt1 wild-type (WT), heterozygous (Het), and homozygous (Hom) mice. The top bars indicate the statistical significance at each ZT timepoint (one-way ANOVA). (B) Quantification of total time spent in wake, NREM, and REM sleep across 24 hours, 12-hour light phase, and 12-hour dark phase. (C) Quantification of the number of bouts of wakefulness, NREM sleep, and REM sleep across 24 hours, light phase, and dark phase. (D) Quantification of bout duration of wakefulness, NREM sleep, and REM sleep across 24 hours, light phase, and dark phase. Data are mean ± SEM (n = 29 for WT, n = 22 for Het, and n = 17 for Hom). n.s. not significant. *p < 0.05, **p < 0.01, ***p < 0.001 (one-way ANOVA).
Figure 3.
Figure 3.
Spectral analysis of sleep states in Kcnt1 mice. (A) Relative EEG power during non-rapid eye movement (NREM) sleep in Kcnt1 wild-type (WT), heterozygous (Het), and homozygous (Hom) mice. (B) Quantification of delta power (left, 0.5–4 Hz) and sigma power (right, 9–15 Hz) during NREM sleep. n.s. not significant, ***p < 0.001 (one-way ANOVA with post hoc Tukey HSD test; for Sigma power, p = 0.07 between WT and Het, p < 0.001 between WT and Hom, and p < 0.001 between Het and Hom) (C) Relative EEG power during rapid eye movement (REM) sleep in WT, Het, and Hom mice. (D) Quantification of theta power (left, 6–9 Hz) and delta power (right, 0.5–4 Hz) during REM sleep. EEG power was normalized to the total power in each mouse. Data are mean ± SEM (n = 29 for WT, n = 20 for Het, and n = 15 for Hom). ***p < 0.001 (one-way ANOVA with post hoc Tukey HSD test; for theta power, p < 0.01 between WT and Het, p = 0.001 between WT and Hom, p = 0.87 between Het and Hom; for delta power, p = 0.06 between WT and Het, p < 0.001 between WT and Hom, and p < 0.001 between Het and Hom).
Figure 4.
Figure 4.
Seizures in Kcnt1 mice modulate brain states. (A) Top, brain states (W-wake, N-NREM [non-rapid eye movement], R-REM [rapid eye movement], and S-seizure) aligned to the seizure onset in Kcnt1 homozygous mice (195 evens from 13 animals). Bottom, quantification of the probability of each brain state during the pre-seizure (30 minutes) and post-seizure (30 minutes) periods. Time 0 indicates the seizure onset. (B) Top, representative relative delta power during the 1-hour window centered around the seizures. Bottom, quantification of the averaged delta power over the time. (C) Top, quantification of the number of REM sleep bouts during the pre-seizure (15 minutes, pre) and two post-seizure periods (15 minutes each, post1 and post2) marked in A. Bars are mean ± SEM. Bottom, quantification of the average of relative delta power during the pre-seizure (5 minutes, pre), and two post-seizure periods (5 minutes each, post1 and post2) marked in B. Bars are mean ± SEM. n. s. indicates not significant, *p < 0.05, ***p < 0.001 (one-way ANOVA with post hoc Tukey HSD test; for REM bouts, p < 0.01 between pre and post1, p = 0.20 between pre and post2, p = 0.33 between post1 and post2; for delta, p < 0.001 between pre and post1, p = 0.60 between pre and post2, and p < 0.01 between post1 and post2).
Figure 5.
Figure 5.
Correlation between sleep and seizures in Kcnt1 mice. (A) Linear regression analysis of seizure numbers and the total duration of wakefulness (left, p = 0.64), non-rapid eye movement (NREM) sleep (middle, p = 0.85), and rapid eye movement (REM) sleep (right, p = 2.02e−5) in Kcnt1 homozygous mice (n = 17) including 12 male (M) and 5 female (F). (B) Linear regression analysis of seizure numbers and bout numbers (p = 0.5 for wake, p = 0.56 for NREM sleep, and p = 3.54e−6 for REM sleep). (C) Linear regression analysis of seizure numbers and bout durations (p = 0.46 for wake, p = 0.82 for NREM sleep, and p = 0.17 for REM sleep). Each data point indicates one mouse. R2 for linear regression was included in each plot. ***p < 0.001.
Figure 6.
Figure 6.
Modulation of brain states by seizures in GCaMP6s-DG mice. (A) Left top, schematic of experimental design showing viral injection of AAV9-CaMKII-GCaMP6s (G6s) or AAV9-CaMKII-GFP in the hippocampus. Left bottom, a representative EEG trace showing a seizure event. Right, representative fluorescent images showing viral expression of GCaMP6s (G6s) and GFP in the hippocampus. (B) Quantification of total time spent in wake, non-rapid eye movement (NREM), and rapid eye movement (REM) sleep across 24 hours, 12-hour light phase, and 12-hour dark phase in GCaMP6s (n = 12) and GFP (n = 11) mice. *p < 0.05, **p < 0.01, ***p < 0.001 (paired t-test). (C) Left, brain states (W-wake, N-NREM, R-REM, and S-seizure) centered around seizure events and the probability of each brain states during the pre-seizure (30 minutes) and post-seizure (30 minutes) periods in GCaMP6s-DG mice. Time 0 indicates the seizure onset. Right, relative delta power spectrum of brain activity during the 1-hour window centered around the seizures. (D) Top, quantification of the number of REM sleep bouts during the pre-seizure (15 minutes, pre), and two post-seizure periods (15 minutes each, post1 and post2) marked in C left. Bottom, quantification of the average of relative delta power during the pre-seizure (5 minutes, pre), and two post-seizure periods (5 minutes each, post1 and post2) marked in C right. Data are mean ± SEM. n. s. not significant, *p < 0.05, **p < 0.01 (one-way ANOVA with post hoc Tukey HSD test; for REM bouts, p < 0.05 between pre and post1, p = 0.18 between pre and post2, p = 0.46 between post1 and post2; for delta, p < 0.01 between pre and post1, p = 0.39 between pre and post2, and p = 0.08 between post1 and post2).
Figure 7.
Figure 7.
Correlation between sleep and seizures in GCaMP6s -DG mice. (A) Linear regression analysis of seizure numbers and the total duration of wakefulness (left, p = 0.0193), NREM sleep (middle, p = 0.0118), and REM sleep (right, p = 0.00003) in GCaMP6s-DG mice (n = 12). (B) Linear regression analysis of seizure numbers and bout numbers (p = 0.248 for wake, p = 0.474 for NREM sleep, and p = 0.0002 for REM sleep). (C) Linear regression analysis of seizure numbers and bout durations (p = 0.0152 for wake, p = 0.272 for NREM sleep, and p = 0.988 for REM sleep). Each data point indicates one mouse. R2 for linear regression was included in each plot. ***p < 0.001.

Similar articles

References

    1. Krutoshinskaya Y, Coulehan K, Pushchinska G, Spiegel R.. The reciprocal relationship between sleep and epilepsy. J Pers Med. 2024;14(1):118. doi: https://doi.org/10.3390/jpm14010118 - DOI - PMC - PubMed
    1. Derry CP, Duncan S.. Sleep and epilepsy. Epilepsy Behav. 2013;26(3):394–404. doi: https://doi.org/10.1016/j.yebeh.2012.10.033 - DOI - PubMed
    1. Nobili L, Frauscher B, Eriksson S, et al.Sleep and epilepsy: a snapshot of knowledge and future research lines. J Sleep Res. 2022;31(4):e13622. doi: https://doi.org/10.1111/jsr.13622 - DOI - PMC - PubMed
    1. Roliz AH, Kothare S.. The interaction between sleep and epilepsy. Curr Neurol Neurosci Rep. 2022;22(9):551–563. doi: https://doi.org/10.1007/s11910-022-01219-1 - DOI - PubMed
    1. Lanigar S, Bandyopadhyay S.. Sleep and epilepsy: a complex interplay. Mo Med. 2017;114(6):453–457. doi: https://doi.org/10.1212/wnl.23.12.1335 - DOI - PMC - PubMed

LinkOut - more resources