[Preprint]. 2025 Mar 16:2025.03.12.642906.
doi: 10.1101/2025.03.12.642906.

Focal Infrared Neural Stimulation Propagates Dynamical Transformations in Auditory Cortex

Affiliations

Focal Infrared Neural Stimulation Propagates Dynamical Transformations in Auditory Cortex

Brandon S Coventry et al. bioRxiv. .

Abstract

Significance: Infrared neural stimulation (INS) has emerged as a potent neuromodulation technology, offering safe and focal stimulation with superior spatial recruitment profiles compared to conventional electrical methods. However, the neural dynamics induced by INS stimulation remain poorly understood. Elucidating these dynamics will help develop new INS stimulation paradigms and advance its clinical application.

Aim: In this study, we assessed the local network dynamics of INS entrainment in the auditory thalamocortical circuit using the chronically implanted rat model; our approach focused on measuring INS energy-based local field potential (LFP) recruitment induced by focal thalamocortical stimulation. We further characterized linear and nonlinear oscillatory LFP activity in response to single-pulse and periodic INS and performed spectral decomposition to uncover specific LFP band entrainment to INS. Finally, we examined spike-field transformations across the thalamocortical synapse using spike-LFP coherence coupling.

Results: We found that INS significantly increases LFP amplitude as a log-linear function of INS energy per pulse, primarily entraining to LFP β and γ bands with synchrony extending to 200 Hz in some cases. A subset of neurons demonstrated nonlinear, chaotic oscillations linked to information transfer across cortical circuits. Finally, we utilized spike-field coherences to correlate spike coupling to LFP frequency band activity and suggest an energy-dependent model of network activation resulting from INS stimulation.

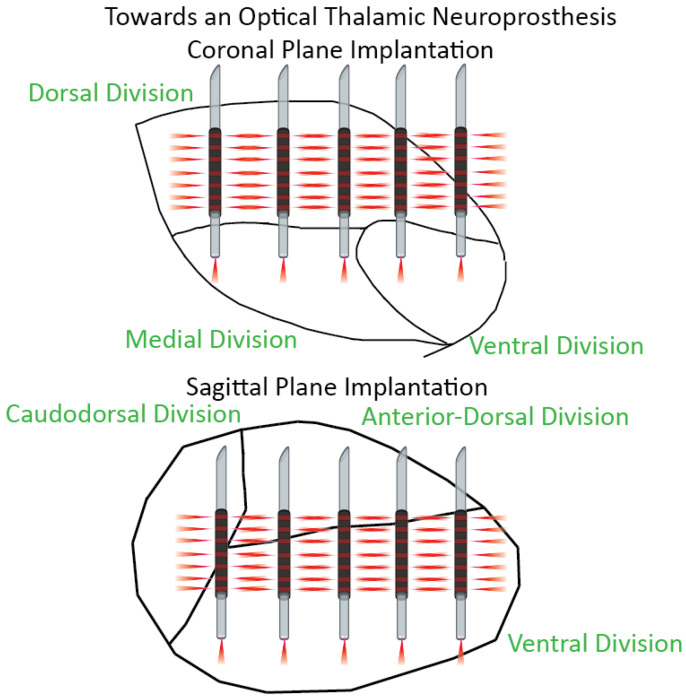
Conclusions: We show that INS reliably drives robust network activity and can potently modulate cortical field potentials across a wide range of frequencies in a stimulus parameter-dependent manner. Based on these results, we propose design principles for developing full coverage, all-optical thalamocortical auditory neuroprostheses.

Keywords: Chaos; Cochlear Implant; Cortex; Deep Brain Stimulation; Infrared Neural Stimulation; Thalamocortical Circuits; Thalamus.


Conflict of interest statement

Disclosures BSC is an unpaid scientific consultant for BECATech Inc for work unrelated to the present study. BSC also holds provisional patents in neural spectral decomposition methods. The other authors declare no conflicts of interest for the data presented in this study.

Figures

Fig. 1
Fig. 1
Schematic representation of stimulation and recording preparation. A. Rats were implanted with planar microwire arrays into layer III/IV of auditory cortex. Spacing of recording electrodes is schematized in this figure. Infrared optrodes were implanted into the medial geniculate body of auditory thalamus. Activation of thalamocortical loops was controlled by laser energy per pulse and interpulse stimulation intervals. B. Local field potential (LFP) recordings were made concurrently across all channels. Propagation of cortical waves was analyzed across all channels. Figure was crafted using tools from BioRender (www.biorender.com).
Fig. 2
Fig. 2
LFP amplitude is driven by increases in INS laser energy-per-pulse and interpulse stimulus intervals. A.) Example LFPs demonstrate increased LFP amplitudes with increased INS laser energy. B.) Bayesian hierarchical linear regression quantifies modulation of LFP N1-P2 RMS voltages. Posterior predictive checks reveal log-log transformed models produced models that best fit observed data. Significance was assessed following Bayesian convention with maximum a priori (MAP) reported. Regression slope parameters were considered significant if posterior distribution 95% highest density interval (HDI) did not contain zero. Credible interval (CI) bounds are given on either side of the HDI boundary. The 0-significance boundary is demarcated by a dotted orange line. Linear regression posterior parameter distributions show that increases in INS laser pulse energy and ISI drive significantly larger N1-P2 amplitudes. There was no evidence of laser energy-ISI interaction. Model errors were significantly above 0 but remained small.
Fig. 3
Fig. 3
Thalamic INS stimulation predominantly drives activation of β and γ LFP bands with increases in applied energy. A. Example time-frequency band decomposition calculated using the fast continuous wavelet transform. Analysis was performed by comparing dB changes in evoked LFP band power responses from baseline band power during stimulus onset (time of stimulus on to 100 ms after conclusion of INS stimulus train) and stimulus offset (end of stimulus onset window to end of trial). B. INS activation primarily drives increases in β, low γ, and high γ power bands during onset windows. Responses were graded, showing further power increases with increases in INS energy per pulse. Regression lines are shown as the maximum a priori (MAP, solid orange line) with 95% credible intervals (dashed orange line) describing uncertainty in the estimation of the MAP regression. C. Offset responses suggest mild decreases in β and low γ powers from baseline as a function of applied energy, suggesting a mild post-stimulus inhibition after INS. This was not found in the high γ band (MAP slope HDI overlaps 0, Table I). Regression results from all LFP bands for onset and offset windows are summarized in Table I. D. β, low γ, and high γ correlations show increases in between band correlations from baseline and subthreshold activation with correlations generally increasing with increased INS energy per pulse. E. Pairwise offset β and low γ,and high γ correlated band power did not significantly change as a function of applied INS.
Fig. 4:
Fig. 4:
Analysis of INS interpulse stimulation interval tMTFs. Power contained in LFP responses at ISI frequencies was calculated through Fourier analysis with tMTFs calculated as the change of ISI frequency power in stimulation response window from baseline. tMTFs were calculated for binned INS energy per pulse values of A. 0-0.5 mJ, B. 0.5-1mJ, C. 1-1.5 mJ, D. 1.5-2 mJ, E. 2-2.5 mJ, F. 2.5-3 mJ, G 3-3.5 mJ, and H. > 3.5 mJ. Significantly modulated responses are given in Table II.
Fig. 5:
Fig. 5:
Observation of chaotic dynamics in LFP responses is correlated to stimulation to LFP information transfer. 0-1 Chaos tests were used to assess the criticality of recorded LFPs and plotted vs mutual information of stimulus to response. Silhouette methods were used to determine the optimal number of K-means clusters (K=2). Results show a bifurcation point at stimulus-response mutual information > 0.4 bits suggest a fundamental firing state changes for neurons displaying critical, chaotic dynamics at baseline to mixed chaos responses. Mixed chaos responses are suggestive of temporally precise adaptation to changing sensory stimulation.
Fig 6:
Fig 6:
Spike rates vs LFP N1-P2 magnitude correlations. A.) Regression parameter distributions suggest a significant intercept term greater than zero with LFP N1-P2 RMS amplitudes showing increases with log spike firing rates and decreases with log ISI. B.) Scatter plot of spike rate and N1-P2 LFP RMS amplitudes across all ISI values. C-E.) Regressions for spike rate, N1-P2 amplitude correlations for 1ms ISI (C), 5 ms ISI (D), and 50 ms ISI (E). Regressions are reported as MAP parameter estimates with shaded regions representing the 95% credible interval.
Fig. 7:
Fig. 7:
Spike-field coherence (SFC) regressions create a model of network entrainment from INS stimulation. A. α, β, and γ SFC regressions as a function of INS energy per pulse. All regression fits represent the mean estimate of regression parameters, with MAP parameter values and 95% HDIs given in table III and IV. SFCs in α and high-γ bands show linear behavior as a function of natural log increases in INS energy per pulse. SFCs in the β and low-γ band show log-linear behavior in higher energies which deviates at lower energies, suggestive of a nonlinear jump discontinuity. To account for this discontinuity, piecewise linear spline regressions with 1 joint knot were performed. β SFCs showed no significant increase below INS energies of 0.125 mJ with linear increases after 0.125 mJ. Similarly, low γ activity showed no significant increases in coherence below INS energies of 0.15 mJ per pulse with log-linear increases in response to increases in INS energy above 0.15 mJ. Vertical grey lines denote the point of knot discontinuity. B. Graphical model of INS network recruitment of the auditory thalamocortical circuit. INS recruitment of the auditory thalamocortical circuit is characterized by two distinct regimes: a low energy regime characterized by thalamic recruitment of Layer III/IV excitatory projections and PV-interneurons and a high energy regime characterized by further excitatory recruitment with recruitment of Layer V/VI feedback projections and interneurons of all types.
Fig. 8:
Fig. 8:
A proposed full coverage INS-based thalamic neuroprostheses. A. Coronal implantation plane provides minimal coverage of ventral MGB with larger coverage of nonlemniscal auditory regions. B. Sagittal implantation routes would provide large INS coverage of lemniscal auditory pathways with adequate coverage of nonlemniscal regions which can either remain unused or serve as a route to account for auditory modulation and control.

Similar articles

References

    1. Wells J. et al., “Application of infrared light for in vivo neural stimulation.,” Journal of biomedical optics 10(6), 064003 (2005) [doi:10.1117/1.2121772]. - DOI - PubMed
    1. Richter C.-P. et al., “Neural stimulation with optical radiation.,” Laser & photonics reviews 5(1), 68–80 (2011) [doi:10.1002/lpor.200900044]. - DOI - PMC - PubMed
    1. Coventry B. S. et al., “Characterization and closed-loop control of infrared thalamocortical stimulation produces spatially constrained single-unit responses,” PNAS Nexus 3(2), pgae082 (2024) [doi:10.1093/pnasnexus/pgae082]. - DOI - PMC - PubMed
    1. Brown W. G. A. et al., “Whole cell patch clamp for investigating the mechanisms of infrared neural stimulation.,” Journal of visualized experiments : JoVE(77), e50444 (2013) [doi:10.3791/50444]. - DOI - PMC - PubMed
    1. Cayce J. M. et al., “Infrared neural stimulation of thalamocortical brain slices,” IEEE Journal on Selected Topics in Quantum Electronics 16(3), 565–572 (2010) [doi:10.1109/JSTQE.2009.2032424]. - DOI

Publication types

LinkOut - more resources