[Preprint]. 2025 Mar 13:2025.03.10.642317.
doi: 10.1101/2025.03.10.642317.

Preventing neuropathy and improving anti-cancer chemotherapy with a carbazole-based compound

Affiliations

Preventing neuropathy and improving anti-cancer chemotherapy with a carbazole-based compound

Lauriane Bosc et al. bioRxiv. .

Abstract

Advances in cancer treatment have led to a steady increase in the rate of disease remission. However, while many treatment-related adverse effects gradually resolve after therapy, chemotherapy-induced peripheral neuropathy (CIPN) often persists, with no means of prevention or direct treatment available. Herein, we present Carba1, a novel bi-functional carbazole that mitigates neuropathy through two distinct mechanisms. First, by interacting with tubulin, Carba1 reduces the required dose of taxanes, widely used chemotherapy drugs notorious for their toxic side effects, including CIPN. Second, Carba1 activates nicotinamide phosphoribosyltransferase (NAMPT), the rate-limiting enzyme in the NAD salvage pathway, triggering a metabolic rewiring that enhances the resilience of neurons and Schwann cells against chemotherapy-induced toxicity. We demonstrate the neuroprotective efficacy of Carba1 both in vitro, against neurotoxicity induced by paclitaxel (PTX), cisplatin, and bortezomib, and in vivo in a rat model of PTX-induced neuropathy. Importantly, we establish that Carba1 does not compromise the therapeutic efficacy of PTX nor promotes tumor growth. Comparative analyses of Carba1 derivatives further suggest the potential of designing compounds with either dual synergistic and neuroprotective activity or exclusive neuroprotective properties. Altogether, our findings position Carba1 as a promising therapeutic candidate for preventing CIPN, with the potential, if successfully translated to clinical settings, to improve both the quality of life and treatment outcome for cancer patients.


Conflict of interest statement

Competing interests: L.B. and L.L. are co-founders of Saxol SAS and co-inventors, with PD and PS, of the European patent # 24305705.6 “Carbazole derivatives used as neuroprotectants and in the treatment of disorders with reduced NAD metabolism”. The other authors declare that they have no competing interests in relation to the work described.

Figures
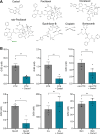
Fig. 1.
Fig. 1.. Carba1 synergizes only with chemotherapeutic agents that bind to the taxane site on tubulin
(A) Chemical structures of the compounds tested. (B) Effects of selected chemotherapeutic agents – Paclitaxel (PTX), Docetaxel (DTX), nab-Paclitaxel (nab-PTX), Epothilone-B (Epo-B), Cisplatin (Cis), Bortezomib (Bort) - on viability of HeLa cells alone or in combination with Carba1. Cells were incubated for 72 h with the indicated concentrations of the drugs with or without 12 μM of Carba1. The percentage of viable cells was calculated following a Prestoblue assay and shown as GI50 (50% of growth inhibition) of the drug when applied alone (grey) or in combination with Carba1 (blue). Data are presented as mean ± SEM of at least 3 independent experiments.* p< 0.05, ** p<0.005, ***p<0.0005, ns non-significant, t-Test.
Fig. 2.
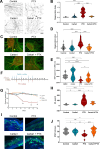
Fig. 2.. Carba1 prevents PTX-induced neuropathy in vitro and in vivo
(A) Representative images of neurofilament staining in axons of adult mouse DRG neurons at 12 days in vitro (DIV) treated for 72 hours with Dimethylsulfoxide (DMSO, Control), 50 nM of paclitaxel (PTX), 12 μM of Carba1or their combination as indicated. Scale bar, 50 μm. (B) Quantification of the effect of the different treatments on axonopathy, by the degeneration index. Data are pooled from 3 experiments (n = 16 to 55 neurites per condition for each experiment). **** p<0.0001, ANOVA. (C) Representative images of mouse dorsal root ganglia (DRG) explants (DIV 14) at 7 days in differentiation medium to allow Schwann cell myelination. DRG explants were treated for 72 hours with DMSO (Control), 12 μM of Carba1, 500 nM of paclitaxel (PTX), or their combination as indicated. Neurons were stained with anti-β3-tubulin (TUBB3, green) and anti-myelin basic protein (MBP, red) antibodies. Scale bar, 100 μm. (D) Quantification of the effect of the different treatments on axons of DRG explants, as assessed by the degeneration index calculated as explained in the material and methods section. **** p<0.0001, ANOVA. (E) Quantification of the effect of the different treatments on myelination, represented as the ratio between the sum of the number of MBP segments and the axonal (TUBB3) area, calculated from 5 random fields per DRG explant from at least 3 different experiments. * p = 0.018, *** p<0.001, Mann-Whitney test. (F) Illustration of the experimental design for the rat model of PTX-induced neuropathy. Carba1 (50 mg/kg, blue arrows) was injected two days (day 0 and 1) before PTX (5 mg/kg, red arrows) administrations in combination or not with Carba1 at the indicated time points. (G) Effects of Carba1 on tactile allodynia in a rat model of PTX-induced neuropathy. Behavioral assessments were performed at day 0 (basal values) and at day 2, 4, 7, 11 and 14. Control animals (black curves) received vehicle injections. The response of the animals injected with Carba1 (blue curve), PTX (red curve) and Carba1 together with PTX (orange curve) are shown at the indicated times. The results are presented by the mean ± SEM (n = 12 per group); *** p < 0.001 PTX vs. Control; ### p < 0.001 PTX vs Carba1+PTX, ANOVA for repeated measures followed by a post hoc Tukey test. (H) Concentrations of neurofilament light chain (NfL) in rat blood samples collected on day 15, before euthanasia of rats used in the experiment shown in F/G. * p=0.014, **** p<0.0001, ANOVA. (I) Representative confocal images of intraepidermal nerve fibers (IENFs) from fixed rat hindpaw biopsies collected on day 15. IENFs (white arrows) were immunolabeled with PGP9.5 (green) and project from subepidermal fascicles across the epidermal-dermal junctions. Scale bar, 100 μm. (J) Quantification of IENF densities from hind paw biopsies. Diagrams represent mean ± SEM calculated from individual rat IENF densities from each group (black points), n = 12 rats/group. ** p<0.01, *** p<0.001, ****p<0.0001, ns non-significant, ANOVA.
Fig. 3.
Fig. 3.. Preventive effect of Carba1 on cisplatin- and bortezomib-induced neuropathies
(A) Representative images of neurofilament staining in axons of adult mouse DRG neurons (DIV 12) treated for 72 h with DMSO (Control), 12 μM of Carba1, 10 μM of Cisplatin (Cis), 100 nM of Bortezomib (Bort), or a combination of the drugs with Carba1 as indicated. Scale bar, 50 μm. (B) Quantification of the degree of axonopathy in DRG neurons treated as in (A) by degeneration index. Data are pooled from 3 independent experiments (8 fields per condition for each experiment). ** p<0.01, **** p<0.0001, ANOVA. (C) Quantification of the effect of DMSO (Control) or Cisplatin (Cis, 10 μg/ml) in combination with 1 μM, 5 μM, 10 μM Carba1 on the number of rat embryonic DRG neurons. ** p<0.01, ANOVA. (D) Quantification of the degree of myelination in rat embryonic DRG neurons treated as in (C) and stained for MBP. ** p<0.005, ANOVA.
Fig. 4.
Fig. 4.. Effect of Carba1 on cell metabolism
(A) Score plot from OPLS-DA multivariate modelling of the NMR metabolic profiles of cells treated for 2 h with 12 μM Carba1 (blue points) or DMSO (Control, grey points). N=18, with 9 replicates per sample class; 1 predictive +3 orthogonal components; R2Y=0.95; Q2=0.59). (B) Associated OPLS-DA back-scaled loadings. Insert: same plot, additional region [5, 9.5 ppm] (C) Effect of Carba1 treatment on the abundance of NAD+ (left) and GTP (right). * p< 0.05, t test. (D) Measurement of NAD(P)H accumulation in HeLa cells. The intensity of the NAD(P)H autofluorescent signal was quantified in living cells and normalized to the cell area. Data represent the mean ± SEM of 3 independent experiments, with a minimum of 40 cells per condition.**** p<0.0001, ANOVA.
Fig. 5.
Fig. 5.. Carba1 targets NAMPT
(A) Carba1 and NAT, but not P7C3 relieve the cytotoxicity caused by the NAMPT inhibitor FK866 on HeLa cells. Viability dose-effect curves of FK866 in the presence of increasing doses of Carba1 (left), NAT (middle) and P7C3 (right). Data represent the mean ± SEM from 3 independent experiments. (B) In vitro dose-dependent activation of NAMPT by Carba1 and NAT but not P7C3. A triply coupled NAMPT assay was performed in the presence of the indicated doses of the compounds. Data obtained after 60 min of incubation were normalized by subtraction of their respective DMSO value, which corresponds to the basal activity of NAMPT. ** p<0.005, ANOVA. (C) NAMPT binding assay using AS-MS. 10 μM Carba1, were incubated with 3 μM NAMPT or 3 μM Carbonic Anhydrase (CA, negative control). 10 μM FK866 was assayed as positive control of NAMPT binding. Protein–ligand complexes were then separated from the unbound compounds by size-exclusion chromatography (SEC) and the amount of protein-bound compounds quantified by mass spectrometry after dissociation from the protein. Histograms show the amounts of compound before (preSEC, grey) and after (postSEC, green) size exclusion chromatography (SEC) in the presence of CA or NAMPT.
Fig. 6.
Fig. 6.. Structure activity relationship analysis of Carba1
(A) Carba1 chemical structure (B) Positions targeted for SAR investigation (C) Compared activities of Carba1 (1) and its analogs.
Fig. 7.
Fig. 7.. Carba1 does not affect antitumoral efficacy of a therapeutic dose of PTX
(A) Analysis of the effect of paclitaxel (PTX), Carba1, and their combination on the growth of HeLa cells xenografted in mice. HeLa cells were subcutaneously implanted on the flank of female athymic nude mice. When the tumors reached a volume of about 120 mm3, mice were treated every two days (dotted lines) with PTX (8 mg/kg), Carba1 (60 mg/kg), the combination of PTX (8 mg/kg) and Carba1 (60 mg/kg), or vehicle. Tumor growth was monitored with a sliding caliper. Data are mean ± SEM, n = 8 mice per group, ANOVA. (B) Images of the tumors isolated at the end of the experiment.

References

    1. Lafanechère L., The microtubule cytoskeleton: An old validated target for novel therapeutic drugs. Front. Pharmacol. 13 (2022),, doi:10.3389/fphar.2022.969183. - DOI - PMC - PubMed
    1. Walsh V., Goodman J., From taxol to taxol®: The changing identities and ownership of an anti-cancer drug. Med. Anthropol. 21, 307–336 (2002). - PubMed
    1. Steinmetz M. O., Prota A. E., Microtubule-Targeting Agents: Strategies To Hijack the Cytoskeleton. Trends Cell Biol. (2018), doi:10.1016/J.TCB.2018.05.001. - DOI - PubMed
    1. Dumontet C., Jordan M. A., Microtubule-binding agents: a dynamic field of cancer therapeutics. Nat Rev Drug Discov. 9, 790–803 (2010). - PMC - PubMed
    1. Yang C. P. H., Horwitz S. B., Taxol®: The First Microtubule Stabilizing Agent. Int. J. Mol. Sci. 2017, Vol. 18, Page 1733. 18, 1733 (2017). - PMC - PubMed

Publication types

LinkOut - more resources