[Preprint]. 2025 Mar 13:2025.03.10.641898.
doi: 10.1101/2025.03.10.641898.

KLF4 promotes a KRT13+ hillock-like state in squamous lung cancer

Affiliations

KLF4 promotes a KRT13+ hillock-like state in squamous lung cancer

Luke T Izzo et al. bioRxiv. .

Abstract

Lung squamous cell carcinoma (LUSC) is basal-like subtype of lung cancer with limited treatment options. While prior studies have identified tumor-propagating cell states in squamous tumors, the broader landscape of intra-tumoral heterogeneity within LUSC remains poorly understood. Here, we employ Sox2-driven mouse models, organoid cultures, and single-cell transcriptomic analyses to uncover previously unrecognized levels of cell fate diversity within LUSC. Specifically, we identify a KRT13+ hillock-like population of slower-dividing tumor cells characterized by immunomodulatory gene expression signatures. The tumor hillock-like state is conserved across multiple animal models and is present in the majority of human LUSCs as well as head and neck and esophageal squamous tumors. Our findings shed light on the cellular origins of lung hillock-like states: normal club cells give rise to tumors with luminal hillock-like populations, while basal-like tumor-propagating cells transition into basal hillock-like states, resembling homeostatic cellular responses to lung injury. Mechanistically, we identify KLF4 as a key transcriptional regulator of the hillock-like state, both necessary and sufficient to induce KRT13 expression. Together, these results provide new molecular insights into cell fate plasticity that underlies intra-tumoral heterogeneity in LUSC, offering potential avenues for new therapeutic strategies.

Keywords: KLF4; KRT13; cell fate; hillock; squamous lung cancer.


Conflict of interest statement

DECLARATION OF INTERESTS TGO has a patent related to SCLC subtypes and a sponsored research agreement with Auron Therapeutics, serves on the scientific advisory board (SAB) for Lung Cancer Research Foundation, and as a consulting editor for Cancer Research and Genes & Development. All other authors declare no conflicts of interest related to this work.

Figures
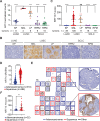
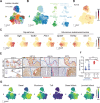
Figure 1.
Figure 1.. KRT13 is highly enriched in squamous tumors.
A) Krt13 expression shown as log2 normalized counts by RNA-seq from lung tumors in indicated GEMMs grouped according to histological type. Tumors were collected from the following number of mice for each genotype: RPR2 (n=8), RPM (n=12), SNL (n=4), LP (n=5), KP (n=6). Statistical significance determined by one-way analysis of variance (ANOVA) and p-values are for all pairwise comparisons to SNL. Lung squamous cell carcinoma (LUSC); lung adenocarcinoma (LUAD); small cell lung cancer (SCLC). Sox2LSL/LSL;Nkx2–1fl/fl;Lkb1fl/fl (SNL); Lkb1fl/fl;Ptenfl/fl (LP); Rb1fl/fl;Trp53fl/fl;MycT58A/T58A (RPM); Rb1fl/fl;Trp53fl/fl;Rbl2fl/fl (RPR2); KrasG12D/+;Trp53fl/fl (KP). B) Representative immunohistochemistry (IHC) for KRT13 in indicated GEMMs. Scale bar, 20 μm. C) H-score quantification of IHC in 1B (see Methods). Number of tumors indicated in figure. Statistical significance was determined by one-way ANOVA and p-values are for all pairwise comparisons to SNL. D) KRT13 expression shown as RSEM from human lung adenocarcinoma and squamous cell carcinoma from TCGA. Number of tumors indicated in figure. Two-tailed t-test. E) Representative KRT13 IHC in human lung tumor tissue microarrays (red = squamous cell carcinoma; blue = adenocarcinoma; black = NSCLC/large cell). Scale bar, 1 mm. Higher magnification insets for adenocarcinoma (blue) and squamous cell carcinoma (red); scale bar, 100 μm. F) H-score quantification of IHC in 1E with number of tumors indicated. Two-tailed t-test. For all panels, each point represents an individual tumor, and error bars represent mean +/− SD. ns = not significant; **p ≤ 0.01; ***p ≤ 0.001; ****p ≤ 0.0001.
Figure 2.
Figure 2.. KRT13 is expressed in a subpopulation of squamous tumors.
A) ScRNA-seq of SNL-CMV tumor cells labeled by Leiden cluster in UMAP space. B) SNL-CMV tumor cells labeled by sorted population (GFP+ or GFP+/NGFR+) in UMAP space as in 2A. C) Expression of indicated squamous or mucinous adenocarcinoma gene markers in UMAP space from cells in 2B. D) ScRNA-seq expression of Krt13 projected on UMAP space from cells in 2B. E) Representative IHC from serial sections in SNL-CMV tumor-bearing lungs harboring both squamous cell carcinoma and mucinous adenocarcinoma. Representative of n = 6 SNL-CMV mice. Scale bar, 100 μm for left column; 50 μm for high-magnification insets on right column. F) Representative immunofluorescence co-staining for KRT13 (green) and TRP63 (red) in SNL-CMV tumors. Representative of n = 4 SNL-CMV mice. Scale bars, 75 μm. See also Figure S1.
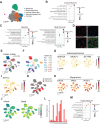
Figure 3.
Figure 3.. Club-initiated tumors have early and enriched KRT13 expression.
A) ScRNA-seq UMAP of primary CMV- and CCSP-SNL tumor cells labeled by Leiden clusters. B) CMV- and CCSP-initiated SNL tumor cells labeled by sorted population (GFP+ or GFP+/NGFR+) in UMAP space as in 3A. C) Expression of indicated squamous or mucinous adenocarcinoma gene markers in UMAP space from cells in 3B. D) scRNA-seq expression of Krt13 projected on UMAP space from cells in 3B. E) Representative KRT5, HNF4A, and KRT13 IHC for CMV- and CCSP-initiated SNL tumors. Squamous (red) and mucinous adenocarcinoma (blue) tumor lesions are outlined. Scale bar, 5 mm for left panels; 2 mm for high-magnification insets on serial sections in right three panels. Representative of n = 5 SNL-CMV and n = 6 SNL-CCSP mice. F) H-score quantification of IHC in 3E. Two-way ANOVA with a Sidak correction for multiple comparisons. Not all comparisons are shown. Each point represents an individual tumor, and error bars represent mean +/− SD. ns = not significant; ****p ≤ 0.0001. G) Gene scores applied to SNL tumor cells projected onto UMAP space from 3A (see Methods and Tables S1–S5). See also Figure S2.
Figure 4.
Figure 4.. KRT13 marks a hillock-like state in squamous tumors.
A) Cell type classification based on gene and gene signature score expression from cells in 3A. B-C) Gene set enrichment analysis comparing SNL tumor cells in 3A by assigned cell type. The ENRICHR gene set used was ‘Reactome Pathways 2024’. D) Representative immunofluorescence (IF) co-staining for KRT13 (green), TRP63 (red), and KI67 (blue) in SNL squamous tumors. Representative of n = 4 SNL-CMV mice. Scale bars, 50 μm. E) UMAP of scRNA-seq from lung squamous tumor cells from 18 patients labeled by Leiden cluster. F) UMAP from 4E labeled by patient (P) sample ID (n = 18). G-I) scRNA-seq expression of adenocarcinoma (NAPSA, NKX2–1, SFTPB), squamous (TP63, KRT5, PITX1), and hillock markers (KRT13) in UMAP space from cells in 4E. J) Human hillock score and human basal score (Tables S1 and S2) applied to tumor cells as in 4E with score projected in UMAP. K) Cell type classification based on hillock score expression from cells in 4E. L) Percent of basal- and hillock-like cells by patient ID as in 4F. M) Gene set enrichment analysis comparing human tumor cells in 4E and 4K by assigned cell type. The ENRICHR gene set used was ‘Reactome Pathways 2024’. See also Figures S3 and S4 and Tables S1–8.
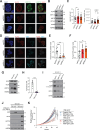
Figure 5.
Figure 5.. NGFR+ tumor propagating cells can regenerate KRT13+ hillock cells.
A) Representative brightfield and immunofluorescence images of tumor organoids established from GFP+NGFR+ SNL tumor cells. Scale bar, 100 μm. B) Representative H&E staining of SNL tumor organoids (n = 2 independent cultures) and SNL squamous tumors (n = 6 mice). Arrows indicate keratinized structures. Scale bars, 100 μm. C) Representative immunofluorescence (IF) co-staining for KI67 (red) and NGFR (cyan) in SNL tumor organoids (n = 3). Scale bar, 100 μm. D) Representative IF co-staining for P40 (purple) and KRT13 (green) in SNL tumor organoids (n = 3). Scale bar, 50 μm. E) Experimental scheme for organoid sorting and scRNA-seq. F) Number of organoids and average organoid area after SNL tumor organoid cells were sorted by NGFR status and replated in Matrigel and allowed to grow for 10 days. Each point represents an image taken at 4x magnification, and error bars represent mean +/− SD. Two-tailed t-test, **p ≤ 0.01. G) Representative IF co-staining for TP63 (purple) and KRT13 (green) from SNL tumor organoids allowed to grow for 10 days after sorting. Representative of n = 2 experiment with 6 different 20x fields per experiment. H) Leiden clustering of scRNA-seq performed on SNL tumor organoids as in 5I. I) scRNA-seq of SNL tumor organoids at time of NGFR sorting (NGFR-high and NGFR-low) and NGFR-high cells after four weeks of growth in organoid conditions (“NGFR-high outgrowth”) in 5H. J) Expression of indicated hillock (Krt13) or basal (Ngfr, Krt5, Trp63, Pitx1) genes in UMAP space from cells in 5H. K) scRNA-seq expression of the hillock score and basal score projected on UMAP space from cells in 5H. L) Cell type classification by Leiden cluster based on gene and gene signature score expression from cells in 5H. (see Methods and Table S1). See also Figure S5.
Figure 6.
Figure 6.. KLF4 regulates the hillock-like state.
A) Log2 normalized counts of Klf4 from RNA-seq of lung tumors from indicated GEMMs with number of tumors indicated in the figure. Statistical significance determined by one-way ANOVA. B) RSEM expression of KLF4 from bulk human RNA-seq data of lung adenocarcinoma and squamous cell carcinoma from TCGA with number of samples indicated in the figure. Two-tailed t-test. C) Representative immunofluorescence (IF) co-staining for KLF4 (red) and dNP63/P40 (purple) in squamous tumors from CMV-initiated SNL tumors. Representative of n = 2 mice. Scale bar, 100 μm. D) IF staining for NGFR (green) and KLF4 (red) in squamous tumors from CCSP- and CMV-initiated SNL tumors (white labels). Representative of n = 3 mice for CCSP-Cre and n= 2 mice for CMV-Cre. Scale bars, 100 μm. E) Representative IF co-staining for KRT13 (green) and KLF4 (red) in squamous tumors from CCSP- and CMV-initiated SNL tumors. Representative of n = 2 mice for CCSP-Cre and n= 3 mice for CMV-Cre. Scale bars, 50 μm. F) Schematic of a squamous tumor with basal-like cells, KLF4-expressing suprabasal cells, and KRT13-expressing hillock-like cells. Made with Biorender. G) Representative IF co-staining for KRT13 (green), KLF4 (red), and dNP63/P40 (cyan) in SNL tumor organoids. Scale bars, 100 μm. Representative of n = 3 experiments at with least 5 different 20x fields per experiment. H) Representative IF co-staining for KLF4 (red) and NGFR (cyan) in SNL tumor organoids. Scale bars, 100 μm. Representative of n = 2 experiments at with least 4 different 20x fields per experiment. For all panels, each data point represents an individual tumor and error bars represent mean +/− SD; ***p ≤ 0.001; ****p ≤ 0.0001. DAPI (blue) labels nuclei. See also Figure S6.
Figure 7.
Figure 7.. KLF4 is necessary and sufficient to induce a KRT13+ hillock-like state.
A) Representative IF co-staining for KRT13 (green) and KLF4 (red) in SNL tumor organoids with KLF4 knockdown using CRISPRi. Scale bars, 100 μm. Representative of n = 2 experiments at least 4 different 20x fields per experiment. B) Immunoblot for indicated proteins from SNL tumor organoids after 10 days of growth following dissociation to single cells and replating in Matrigel. C) Number and average size of organoids after 7 days of growth following dissociation to single cells and replating in Matrigel. One-way ANOVA. D) Representative IF co-staining for KI67 (cyan) and KLF4 (red) in SNL tumor organoids with KLF4 knockdown using CRISPRi. Scale bars, 100 μm. Representative of n = 2 experiment with at least 7 different 20x fields per sample. E-F) Quantification of nuclei staining positive for KLF4 (E) or KI67 (F) from 7D. One-way ANOVA. G) Immunoblot for indicated proteins from SNL organoids using the TRE-GFP or TRE-KLF4 vectors. Cells were grown for 10 days and 1μg/mL doxycycline was added every 48 hrs. H) Number and average size of SNL tumor organoids after 7 days of growth following dissociation to single cells and replating in Matrigel and treated with doxycycline as in 7G. Two-tailed t-test. I) Immunoblot for indicated proteins in human BCi-NS1.1 cell lines expressing non-targeting control (sgNTC) or sgKLF4. J) Immunoblot for indicated proteins in human BEAS-2B cell lines with TRE-GFP or - KLF4 overexpression constructs with (+) or without (−) doxycycline exposure for 48 hrs. K) Cell growth determined by confluency using an Incucyte live-cell imaging system (Sartorius) normalized to initial plating density of BEAS-2B cells grown with varying doses of doxycycline (Dox). One-way ANOVA. For all panels with bar graphs, each data point represents a 4x (organoid growth)/20x (IF quantification) microscopy field of view, and error bars represent mean +/− SD; *p ≤ 0.05; **p ≤ 0.01;***p ≤ 0.001; ****p ≤ 0.0001. For all other panels, DAPI (blue) marks nuclei. HSP90 serves as loading control. See also Figure S7.
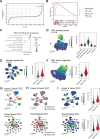
Figure 8.
Figure 8.. KLF4 regulates a hillock-like gene expression signature.
A) Waterfall plot of differentially expressed genes from RNA-sequencing of TRE-KLF4 BEAS-2B cells treated +/− Dox as in 7J. B) GSEA for the general hillock score and basal score derived from RNA-sequencing of TRE-KLF4 BEAS-2B cells treated +/− Dox as in 7J. C) Gene set enrichment analysis of the top 100 upregulated genes by TRE-KLF4 in BEAS-2B cells treated +/− Dox as in 7J. The ENRICHR gene set used was ‘Reactome Pathways 2024’. D-F) KLF4-up score applied to SNL tumor cells (D), human squamous tumor cells (E), and organoid cells (F) projected onto UMAP space from 3A, 4E, and 5H with score expression violin plots by cell state assignment. (see Methods and Tables S11). G) UMAP of scRNA-seq from head & neck tumor cells from 15 patients (Kurten et al) or from esophageal tumors from 60 patients (Zhang et al) labeled by Leiden cluster. H) Cell type classification of head & neck SCC or esophageal SCC single cell data based on hillock score expression from cells in 8G. I) UMAP of KLF4-up score applied to head & neck and esophageal SCC cells from 8G with score expression in violin plots grouped by cell state assignment. See also Figure S8.

References

    1. Flavahan W. A., Gaskell E. & Bernstein B. E. Epigenetic plasticity and the hallmarks of cancer. Science 357, eaal2380 (2017). 10.1126/science.aal2380 - DOI - PMC - PubMed
    1. Hinohara K. & Polyak K. Intratumoral Heterogeneity: More Than Just Mutations. Trends Cell Biol 29, 569–579 (2019). 10.1016/j.tcb.2019.03.003 - DOI - PMC - PubMed
    1. Ciriello G. et al. Cancer Evolution: A Multifaceted Affair. Cancer Discov 14, 36–48 (2024). 10.1158/2159-8290.CD-23-0530 - DOI - PMC - PubMed
    1. Puram S. V. et al. Single-Cell Transcriptomic Analysis of Primary and Metastatic Tumor Ecosystems in Head and Neck Cancer. Cell 171, 1611–1624 e1624 (2017). 10.1016/j.cell.2017.10.044 - DOI - PMC - PubMed
    1. Li H. et al. Reference component analysis of single-cell transcriptomes elucidates cellular heterogeneity in human colorectal tumors. Nat Genet 49, 708–718 (2017). 10.1038/ng.3818 - DOI - PubMed

Publication types