[Preprint]. 2025 Mar 14:2025.03.12.642800.
doi: 10.1101/2025.03.12.642800.

IL-6 underlies microenvironment immunosuppression and resistance to therapy in glioblastoma

Affiliations

IL-6 underlies microenvironment immunosuppression and resistance to therapy in glioblastoma

Jacob S Young et al. bioRxiv. .

Abstract

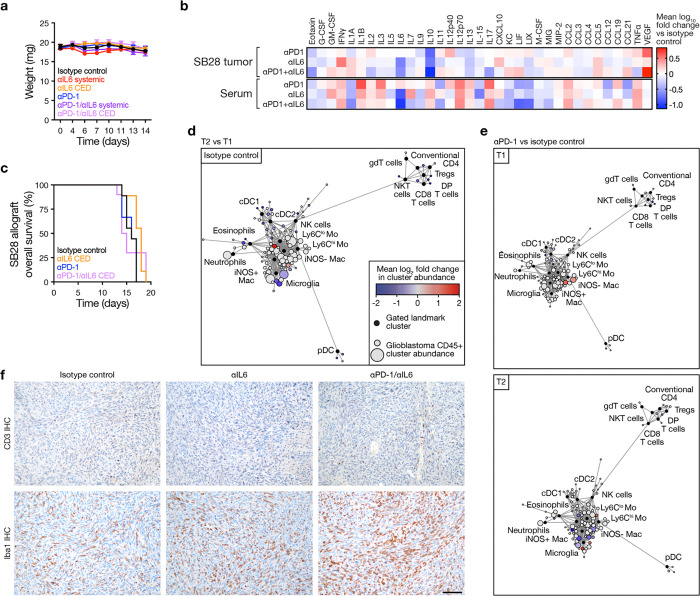
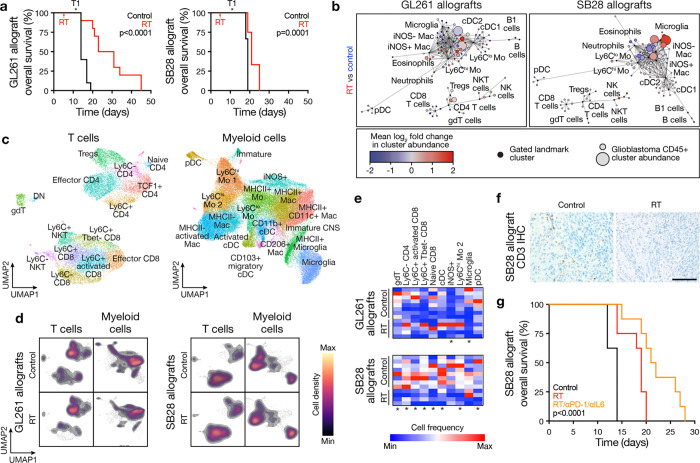
The glioblastoma tumor immune microenvironment (TIME) is an immunosuppressive barrier to therapy that encumbers glioblastoma responses to immune checkpoint inhibition (ICI). Immunosuppressive cytokines, pro-tumor myeloid cells, and exhausted T-cells are hallmarks of the glioblastoma TIME. Here we integrate spatial and single-cell analyses of patient-matched human glioblastoma samples before and after ICI with genetic, immunologic, single-cell, and pharmacologic studies in preclinical models to reveal that interleukin-6 (IL-6) inhibition reprograms the glioblastoma TIME to sensitize mouse glioblastoma to ICI and radiotherapy. Rare human glioblastoma patients who achieve clinical responses to ICI have lower pre-treatment IL-6 levels compared to glioblastomas who do not respond to ICI. Immune stimulatory gene therapy suppresses IL-6 tumor levels in preclinical murine models of glioblastoma. Furthermore, survival was longer in Il-6 knockout mice with orthotopic SB28 glioblastoma relative to wild-type mice. IL-6 blockade with a neutralizing antibody transiently sensitizes mouse glioblastoma to anti-PD-1 by increasing MHCII+ monocytes, CD103+ migratory dendritic cells (DCs), CD11b+ conventional DCs, and effector CD8+ T cells, and decreasing immunosuppressive Tregs. To translate these findings to a combination treatment strategy for recurrent glioblastoma patients, we show that IL-6 blockade plus ICI durably sensitizes mouse glioblastoma to high-dose radiotherapy.


Conflict of interest statement

Competing interests statement The authors declare no competing interests.

Figures

Extended Data Fig. 1.
Extended Data Fig. 1.. Human glioblastoma tissue sections pre-ICI and post-ICI.
a, H&E, CD68 IHC, and CD3 IF sections for ICI responders pre-ICI (left) and post-ICI (right) showing region-of-interest (ROI) location for spatial proteomics (white circles) and spatial transcriptomics (white and red circles). b, H&E, CD68 IHC, and CD3 IF sections for ICI non-responders pre-ICI (left) and post-ICI (right) showing ROI location for spatial proteomic (white circles) and spatial transcriptomic (white and red circles) analyses. Scale bar, 1mm.
Extended Data Fig. 2.
Extended Data Fig. 2.. Gene circuit network changes between ICI responders and non-responders before and after ICI treatment.
a, Network of gene circuits mapping differentially expressed genes between ICI responders (far left) and non-responders (middle left) post-ICI and pre-ICI specimens, and differentially expressed genes between pre-ICI (middle right) and post-ICI (far right) specimens from ICI responders and non-responders. Nodes represent pathways and edges represent shared genes between pathways (p≤0.05, FDR≤0.05). n = 14 match-paired glioblastoma samples from 7 patients.
Extended Data Fig. 3.
Extended Data Fig. 3.. UMAP markers for CyTOF gating of T cells from intracranial mouse glioblastoma allografts.
a, UMAP cell density plots showing protein expression used for assigning cell types in Fig. 4e.
Extended Data Fig. 4.
Extended Data Fig. 4.. UMAP markers for CyTOF gating of myeloid cells from intracranial mouse glioblastoma allografts.
a, UMAP cell density plots showing protein expression used for assigning cell types in Fig. 4e.
Extended Data Fig. 5.
Extended Data Fig. 5.. Intratumor cytokine gene therapy for intracranial glioblastoma allografts.
a, Body weights for C57J/B6 WT mice harboring intracranial GL261 (left) or SB28 (right) intracranial allografts treated with intratumor CED cytokine gene therapy (n=10 mice/condition). See also Fig. 5c. b, H&E, CD3 IHC, and Iba1 IHC sections from SB28 allografts treated with intratumor AAV9 gene therapy showing modest CD3 infiltrate and robust Iba1 infiltrate in regions of viable tumor after AAV9-APOA1 or AAV9-IL1B compared to AAV9-GFP control (2×10¹¹ viral genomes per mouse). Scale bar, 100μm. c, Heatmap of cytokine changes from multiplexed bead assays of sera from GL261 (top) or SB28 (bottom) intracranial mouse glioblastoma allografts after intratumor treatments with AAV9 gene therapies (n=3 mice/condition) vs AAV9-GFP (n=3 mice) showing a lack of consistent alterations in cytokine levels following intratumor gene therapy treatments. Legend shows mean log10 fold change with gene therapy treatments vs AAV9-GFP control.
Extended Data Fig. 6.
Extended Data Fig. 6.. CCL2 and CXCL10 from the tumor microenvironment do not contribute to glioblastoma overall survival.
a, Body weights for C57J/B6 WT mice (n=8) vs C57J/B6 Il6−/− mice (n=8) harboring intracranial SB28 glioblastoma allografts. See also Fig. 6g. b, Kaplan-Meier curves for overall survival from SB28 intracranial glioblastoma allografts in C57J/B6 WT (n=8 mice) vs C57J/B6 Ccl2−/− mice (n=8 mice) vs Cxcl10−/− mice (n=8 mice) showing no change in overall survival for mice lacking CCL2 or CXCL10 in the tumor microenvironment. Log rank test. c, Body weights for C57J/B6 WT (n=8 mice) vs C57J/B6 Ccl2−/− mice (n=8 mice) vs Cxcl10−/− mice (n=8 mice) harboring intracranial SB28 glioblastoma allografts. d, Body weights for C57J/B6 WT mice harboring SB28 intracranial glioblastoma allografts with doxycycline-induced IL6 (n=10 mice) or EV (n=10 mice) overexpression. See also Fig. 6i.
Extended Data Fig. 7.
Extended Data Fig. 7.. Intratumor IL6 blockade does not prolong glioblastoma overall survival and immune checkpoint inhibition in the absence of systemic IL6 blockade does not reprogram the glioblastoma immune microenvironment.
a, Body weights for C57J/B6 WT mice (n=8–9 mice/condition) bearing SB28 intracranial mouse glioblastoma allografts treated with isotype control, systemic αIL6 monotherapy, systemic αPD-1 monotherapy, intratumor CED αIL6 monotherapy, or intratumor vs systemic αIL6 in combination systemic αPD-1 therapy. See also Fig. 7b. b, Heatmap of cytokine changes from multiplexed bead assays of SB28 intracranial glioblastoma allograft tumor lysates (top) or sera (bottom) after systemic monotherapy or combined antibody treatments (n=8 mice/condition) showing suppression of IL10 with all antibody treatments and suppression of IL6 with αIL6 treatments. c, Kaplan-Meier curves for overall survival from SB28 intracranial glioblastoma allografts showing no difference in overall survival after intratumor CED treatment with αIL6 (156.75 μg in 15μL) either alone or in combination with systemic αPD-1 therapy (250 μg biweekly i.p.) compared to isotype control treatments (n=8–9 mice/condition). d, CD45+ immune cell CyTOF scaffold plot (n=104,388 cells) from SB28 intracranial glioblastoma allografts treated with isotype control at T2 vs T1 timepoints from Fig. 7b showing microglia in the tumor immune microenvironment decrease over time. e, CD45+ immune cell CyTOF scaffold plots from SB28 intracranial glioblastoma allografts treated with αPD-1 monotherapy vs isotype control at T1 (top, n=117,751 cells) or T2 (bottom, n= 194,205 cells) timepoints from Fig. 7b showing minimal change in the tumor immune microenvironment with αPD-1 monotherapy. f, CD3 IHC and Iba1 IHC sections from intracranial glioblastoma SB28 allografts in C57BL/6J mice treated with isotype control, systemic αIL6 monotherapy, or combined αPD-1/αIL6 therapy showing increases in Iba1 macrophages and CD3+ T cells following combination therapy. Scale bar, 100μm.
Extended Data Fig. 8.
Extended Data Fig. 8.. UMAP markers for CyTOF gating of T cells from intracranial mouse glioblastoma allografts after IL6 blockade and immune checkpoint inhibition.
a, UMAP cell density plots showing protein expression used for assigning cell types in Fig. 7d.
Extended Data Fig. 9.
Extended Data Fig. 9.. UMAP markers for CyTOF gating of myeloid cells from intracranial mouse glioblastoma allografts after IL6 blockade and immune checkpoint inhibition.
a, UMAP cell density plots showing protein expression used for assigning cell types in Fig. 7d.
Extended Data Fig. 10.
Extended Data Fig. 10.. Body weights for immunocompetent mice treated with radiotherapy.
a, Body weights for C57J/B6 WT mice harboring intracranial GL261 (left) or SB28 (right) intracranial allografts treated with radiotherapy (RT, 18Gy/1Fx) vs no-treatment control (n=10 mice/condition). See also Fig. 7a.
Extended Data Fig. 11.
Extended Data Fig. 11.. UMAP markers for CyTOF gating of T cells from intracranial mouse glioblastoma allografts after radiotherapy, IL6 blockade, and immune checkpoint inhibition.
a, UMAP cell density plots showing protein expression used for assigning cell types in Fig. 8c.
Extended Data Fig. 12.
Extended Data Fig. 12.. UMAP markers for CyTOF gating of myeloid cells from intracranial mouse glioblastoma allografts after radiotherapy, IL6 blockade, and immune checkpoint inhibition.
a, UMAP cell density plots showing protein expression used for assigning cell types in Fig. 8c.
Extended Data Fig. 13.
Extended Data Fig. 13.. Body weights for immunocompetent mice treated with radiotherapy, IL6 blockade, and immune checkpoint inhibition.
a, Body weights for C57J/B6 WT mice harboring intracranial SB28 glioblastoma allografts treated with radiotherapy (RT, 18Gy/1Fx) vs RT plus αPD-1/αIL6 therapy (250 μg biweekly i.p. for up to four weeks for each antibody) vs no-treatment control (n=8–10 mice/condition). See also Fig. 8g.
Fig. 1.
Fig. 1.. Glioblastomas that respond to immune checkpoint inhibition are enriched in intratumor T cells after treatment.
a, 7 patients with 14 match-paired glioblastoma samples that were resected before or after treatment with ICI. Responders (top) and non-responders (bottom) were distinguished using radiographic and pathologic criteria (Methods). b, CD3 and DAPI IF sections from an ICI non-responder (left) or an ICI responder (right) showing regions of spatial protein profiling using the NanoString GeoMx Digital Spatial Profiler in viable tumor tissue (white) adjacent to regions of intratumor necrosis. Representative of n=7 patients. Scale bar, 1mm. c, Principal component (PC) analysis of expression from spatial protein profiling of ICI non-responders (top, n=4 patients) or ICI responders (bottom, n=3 patients). d, Heatmaps of differentially expressed spatial proteins revealing significant inter- and intratumor heterogeneity between ICI responders and non-responders. Top heatmap shows results from 84 spatial regions across 14 matched-paired samples from 7 patients. Bottom heatmap shows significantly different results (Student’s t tests, p≤0.05) for ICI responders or ICI non-responders when comparing pre-ICI vs post-ICI samples. e, Spatial protein expression of select immune or MAPK signaling markers showing post-ICI myeloid infiltration in non-responders and post-ICI lymphoid infiltration in responders. Student’s t tests, *p≤0.05, **p≤0.01. f, CD68 IHC sections from pre-ICI (left) or post-ICI (right) samples from ICI non-responders (top) or ICI responders (bottom). Representative of n=7 patients. g, CD3 IHC sections from pre-ICI (left) or post-ICI (right) samples from ICI non-responders (top) or responders (bottom). Scale bar, 100μm. Representative of n=7 patients.
Fig. 2.
Fig. 2.. Glioblastomas that do not respond to immune checkpoint inhibition are enriched in intratumor innate immune and cancer stem cell markers after treatment.
a, Differential spatial transcriptomic expression from 7 patients with 14 match-paired glioblastoma samples that were resected before or after treatment with ICI. Differentially expressed spatial genes in viable tumor tissue adjacent to regions of intratumor necrosis, ranked by magnitude of expression, are shown. ENRICHR gene ontology terms using the top 250 differentially expressed spatial genes in post-ICI vs pre-ICI samples from non-responders (left) or responders (right) are also shown. b, Volcano plots showing differential spatial gene expression in pre-ICI vs post-ICI samples from ICI responders (left) or ICI non-responders (right). c, Volcano plots showing differential spatial gene expression in ICI non-responders vs ICI responders from pre-ICI (left) or post-ICI (right) samples. d, Heatmaps of differentially expressed spatial genes from 173 regions revealing significant inter- and intratumor heterogeneity between ICI responders and ICI non-responders in pre-ICI vs post-ICI samples. ENRICHR gene ontology terms using the top 250 differentially expressed spatial genes across all samples are shown. e, Spatial expression of the glioblastoma stem cell marker gene PTPRZ1 shows enrichment in ICI responders vs ICI non-responders pre-ICI and in post-ICI vs pre-ICI samples from non-responders. PTPRZ1 was suppressed in ICI responders vs ICI non-responders post-ICI and in post-ICI vs pre-ICI samples from responders. Student’s t tests, *p≤0.05, **p≤0.01.
Fig. 3.
Fig. 3.. Glioblastomas that do not respond to immune checkpoint inhibition are enriched in immunosuppressive myeloid cells and glioma stem-like cells after treatment.
a, Multiplexed sequential immunofluorescence microscopy showing intratumor heterogeneity of signaling mechanisms and cell types in ICI non-responder tissue section. Scale bar, 1mm. b, Multiplexed sequential immunofluorescence microscopy on the Lunaphore Comet platform showing dramatic increase in SOX2+, PTPRZ1+, and p-STAT3+ expressing cells in ICI non-responders. Scale bar, 100μm. c, Multiplexed sequential immunofluorescence microscopy showing few myeloid cells in ICI responders, particularly CD163+ macrophages and P2RY12+ myeloid cells, compared to ICI non-responders. Scale bar, 100μm. d, Multiplexed sequential immunofluorescence microscopy showing rare naïve perivascular lymphocytes in ICI responders both pre- and post-ICI treatment. Scale bar, 100μm. Images are representative of protein expression program differences across matched pairs of pre-ICI and post-ICI glioblastomas.
Fig. 4.
Fig. 4.. The immune microenvironment of immunocompetent intracranial glioblastoma allografts.
a, H&E (top), CD3 IHC (middle), and Iba1 IHC (bottom) sections from GL261 (left) or SB28 (right) intracranial glioblastoma allografts in immunocompetent C57BL/6J mice. Representative of n=3 mice/model. Scale bar, 100μm. b, IF sections showing intra- and peri-tumor intracranial GFP 2 or 5 days after CED of AAV9-GFP into GL261 allografts (left) or human GBM6 xenografts (right). Representative of n=3 mice/model. Nuclei are marked with DAPI. Scale bar, 1mm. c, Principal component (PC) analysis of CD45+ immune cell subset frequencies determined by CyTOF of newly diagnosed human glioblastomas (n=6 patients, 286,370 cells) compared to GL261 (n= 7 mice, 460,176 cells) or SB28 (n=8 mice, 712,187 cells) intracranial glioblastoma allografts after control (n=4 mice/model) or AAV9-GFP (n=3–4 mice/model) treatment revealing the immune microenvironment of human and SB28 glioblastomas are similar. d, Variable loadings plot for PC analysis in c showing the top 13 immune cell types contributing to variance for PC1 and PC2. Human and SB28 glioblastomas have fewer T cells than GL261 glioblastomas. e, UMAP and Phenograph unsupervised clustering analysis of the immune microenvironment in GL261 and SB28 control or AAV9-GFP intracranial glioblastoma allografts for T cells (n=8 mice per model, 12,544 cells, left) or myeloid cells (n=8 mice per model, 40,000 cells, right). f, UMAP density plots from analysis in e for T cells (left) or myeloid cells (right) in GL261 (top) or SB28 (bottom) intracranial glioblastoma allografts. g, Heatmap of T cell or myeloid cell subset frequencies from e for individual mice, showing T cell depletion in SB28 glioblastomas. All cell types with Student’s t test p≤0.05 for comparison between models are shown.
Fig. 5.
Fig. 5.. Intratumor cytokine gene therapy reprograms the glioblastoma immune microenvironment.
a, H&E (top), CD3 IHC (middle), and Iba1 IHC (bottom) sections from intracranial glioblastoma GL261 allografts in C57BL/6J mice treated with intratumor CED of recombinant peptides associated with T cell infiltration in benign intracranial tumors (3.5–10ug recombinant peptide/mouse). Boxes show locations of IHC images. Scale bars, 1mm and 100μm. b, Experimental workflow for intracranial glioblastoma allograft implantation, intratumor CED gene therapy, sample collection for cellular and molecular analyses at timepoint T1, and longitudinal survival analysis. c, Kaplan-Meier curves for overall survival from GL261 (left, n=10 mice/condition) or SB28 (right, n=10 mice/condition) intracranial glioblastoma allografts after intratumor CED AAV9 treatments showing improved overall survival from SB28 glioblastomas with cytokine gene therapies compared to AAV9-GFP control (2×10¹¹ viral genomes per mouse). Log rank tests. d, CD45+ immune cell CyTOF scaffold plots (n=2,291,320 cells for GL261, n=1,485,064 cells for SB28) showing unsupervised cell clusters from GL261 (left) or SB28 (right) intracranial glioblastoma allografts after intratumor CED treatments with AAV9 gene therapies vs AAV9-GFP (n=4 mice/condition), showing T cell and microglia infiltration in SB28 glioblastomas after treatment. Manually gated landmark immune cell populations (black) are annotated. e, Heatmap of cytokine changes from multiplexed bead assays of GL261 (top) or SB28 (bottom) intracranial glioblastoma allograft tumor lysates after intratumor CED treatments with AAV9 gene therapies (n=3 mice/condition) vs AAV9-GFP (n=3 mice) showing suppression of IL6 with all gene therapies in SB28 but not GL261 glioblastomas.
Fig. 6.
Fig. 6.. IL6 from tumor and non-tumor cells in the glioblastoma microenvironment increases tumor initiating capacity and reduces overall survival.
a and b, Single-cell RNA sequencing of 32,877 cells from 11 human glioblastomas showing IL6 and IL6R are expressed by tumor cells and diverse tumor microenvironment cell types in human glioblastomas. c, Spatial expression of IL6 or IL6R from 7 patients with 14 match-paired glioblastoma samples that were resected before or after treatment with ICI showing IL6 is suppressed in ICI responders vs ICI non-responders pre-ICI. Student’s t test, **p≤0.01. d, IL6 expression across intratumor histological locations from human glioblastomas in the Ivy Glioblastoma Atlas Project (RNA sequencing from n=122 glioblastoma samples, 10 patients) showing IL6 is enriched in viable pseudopalisading cells adjacent to regions of intratumor necrosis. ANOVA, p<0.0001. e, Kaplan-Meier curves for overall survival from IL6 high (n=263 patients) vs IL6 low (n=262 patients) human glioblastomas in The Cancer Genome Atlas. IL6 expression was dichotomized at the mean. Log-rank test. f, In vivo intracranial tumor initiating capacity of SB28 glioblastoma allograft cells in C57BL/6J wildtype (WT) vs C57BL/6J Il6−/− mice showing IL6 from the microenvironment increases glioblastoma tumorigenesis. Denominators indicate number of mice at each time point. Numerators indicate number of mice with tumors as measured using intracranial bioluminescence at each time point. g, Kaplan-Meier curves for overall survival from SB28 intracranial glioblastoma allografts in C57J/B6 WT (n=8 mice) vs C57J/B6 Il6−/− mice (n=8 mice) showing Il6 from the glioblastoma microenvironment reduces overall survival. Log rank test. h, QPCR assessment of IL6 in SB28 cells with doxycycline-induced IL6 overexpression compared to SB28 empty vector (EV) cells treated with doxycycline. Student’s t test, ***p≤0.0001. i, Kaplan-Meier curves for overall survival from SB28 intracranial glioblastoma allografts with doxycycline-induced IL6 (n=10 mice) or EV (n=10 mice) overexpression showing IL6 from glioblastoma tumor cells reduces overall survival. Log rank test.
Fig. 7.
Fig. 7.. Combined IL6 blockade and immune checkpoint inhibition reprograms the glioblastoma immune microenvironment and improves overall survival.
a, Experimental workflow for intracranial glioblastoma allograft implantation, serial systemic antibody therapy, sample collection for cellular and molecular analyses at timepoints T1 (4 days after treatment initiation) and T2 (10 days after treatment initiation), and longitudinal survival analysis. b, Kaplan-Meier curves for overall survival from SB28 intracranial glioblastoma allografts showing improved overall survival after systemic treatment with combined αPD-1/αIL6 therapy (250 μg biweekly i.p.) compared to monotherapy or isotype control treatments (n=8–9 mice/condition). Arrows indicate serial antibody treatments. Log rank test. c, CD45+ immune cell CyTOF scaffold plots of T cells (n=24,211 cells, top) or myeloid cells (n=504,571 cells, bottom) from SB28 intracranial glioblastoma allografts at T1 or T2 timepoints during combined αPD-1/αIL6 therapy vs αPD-1 monotherapy. Immune cell types in proximity to manually gated landmark immune cell populations (black) are colored when the proportion of cells increased during combined αPD-1/αIL6 therapy (red) vs αPD-1 monotherapy (blue), with q-value <0.1 by significance analysis of microarrays (SAM). At T1 there was an increase in CD8+ T cells following combination therapy while T2 was marked by an increase in monocytes and macrophages without a corresponding increase in CD8+ T cells. d, UMAP and Phenograph analysis of T cells (n=19,856 cells, left) or myeloid cells (n=170,000 cells, right) in the immune microenvironment in SB28 intracranial glioblastoma allografts at T1 and T2 timepoints during serial systemic antibody therapy. e, UMAP cell density plots for T cells (left) or myeloid cells (right) at T1 or T2 timepoints during serial systemic antibody therapy of SB28 intracranial allografts. f, Heatmaps of T cell or myeloid cell subset frequencies from d for individual mice. All cell subsets shown have Student’s t test p≤0.05 in at least one T1 vs T2 comparison across treatment conditions. Combined systemic αPD-1/αIL6 therapy increased CD8+ T cells and CD11b+ cDCs at T1. CD4+ T cells increased at T2. g, Spearman correlation matrices for all CD45+ immune cell subset frequencies determined from CyTOF UMAP data from d at T1 (left) or T2 (right) timepoints during serial systemic antibody therapy of SB28 intracranial allografts. Cluster order is determined using hierarchical clustering to identify enriched hubs (triangles) of co-correlating immune cell types. At T1, there were positive correlations between CD8+ T cells and CD4+ T cells and NK cells. At T2, there were negative correlations between CD8+ T cells and neutrophils, Ly6Clo monocytes, and Ly6Cmid monocytes.
Fig. 8.
Fig. 8.. Combined IL6 blockade and immune checkpoint inhibition improves overall survival after ablative radiotherapy for glioblastoma.
a, Kaplan-Meier curves for overall survival from GL261 (left, n=10 mice/condition) or SB28 (right, n=10 mice/condition) intracranial glioblastoma allografts after radiotherapy (RT, 18Gy/1Fx) vs control showing long-term survival from GL261 glioblastomas and short-term survival from SB28 glioblastomas after ablative RT. T1 shows sample collection timepoint for cellular and molecular analyses. Log rank tests. b, CD45+ immune cell CyTOF scaffold plots from GL261 (n=545,566 cells, left) or SB28 (n=506,245 cells, right) intracranial glioblastoma allografts after RT (n=4–5 mice/condition) vs control (n=4 mice) showing microglia infiltration in SB28 glioblastomas after ablative RT. Manually gated landmark immune cell populations (black) are annotated. c, UMAP and Phenograph analysis of T cell types (n=19,600 cells, left) or myeloid cells (n=62,500 cells, right) in the immune microenvironment of GL261 and SB28 intracranial glioblastoma allografts after RT and control (n=8 mice for control, n=9 mice for RT). d, UMAP cell density plots for manually gated T cells (left) or myeloid cells (right) of GL261 and SB28 intracranial glioblastoma allografts after RT vs control. e, Heatmap of T cell or myeloid cell subset frequencies from c, showing RT depletes T cells in SB28 glioblastomas. The majority of significantly changed immune cell types were identified in SB28 intracranial glioblastoma allografts. Student’s t test, *p≤0.05. f, CD3 IHC sections from SB28 intracranial glioblastoma allografts after RT vs control. Representative of n=3 mice/condition. Scale bar, 100μm. g, Kaplan-Meier curves for overall survival from SB28 intracranial glioblastoma allografts showing improved overall survival after RT vs control and after combined αPD-1/αIL6 therapy plus RT vs RT or control (n=8–10 mice/condition). Log rank test.

References

    1. Stupp R, Mason W, van den Bent MJ, et al. Radiotherapy plus Concomitant and Adjuvant Temozolomide for Glioblastoma. N Engl J Med. 2005:987–996. doi:10.1056/NEJMoa043330 - DOI - PubMed
    1. Wolchok JD, Chiarion-Sileni V, Rutkowski P, et al. Final, 10-Year Outcomes with Nivolumab plus Ipilimumab in Advanced Melanoma. N Engl J Med. 2025;392(1):11–22. doi:10.1056/NEJMOA2407417 - DOI - PubMed
    1. Wen PY, Weller M, Lee EQ, et al. Glioblastoma in adults: a Society for Neuro-Oncology (SNO) and European Society of Neuro-Oncology (EANO) consensus review on current management and future directions. Neuro Oncol. 2020;22(8):1073–1113. doi:10.1093/NEUONC/NOAA106 - DOI - PMC - PubMed
    1. Sampson JH, Maus M V., June CH. Immunotherapy for Brain Tumors. J Clin Oncol. 2017;35(21):2450–2456. doi:10.1200/JCO.2017.72.8089 - DOI - PubMed
    1. Greenwald AC, Darnell NG, Hoefflin R, et al. Integrative spatial analysis reveals a multi-layered organization of glioblastoma. Cell. 2024;187(10):2485–2501.e26. doi:10.1016/J.CELL.2024.03.029 - DOI - PMC - PubMed

Publication types