[Preprint]. 2025 Mar 16:2025.03.14.643362.
doi: 10.1101/2025.03.14.643362.

Calcium signals shape metabolic control of H3K27ac and H3K18la to regulate EGA

Affiliations

Calcium signals shape metabolic control of H3K27ac and H3K18la to regulate EGA

Virginia Savy et al. bioRxiv. .

Abstract

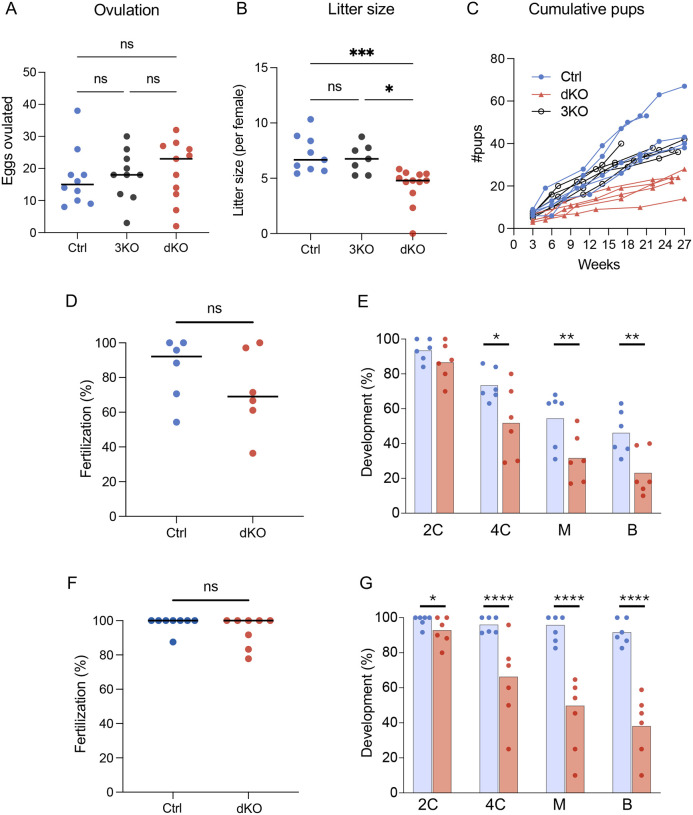
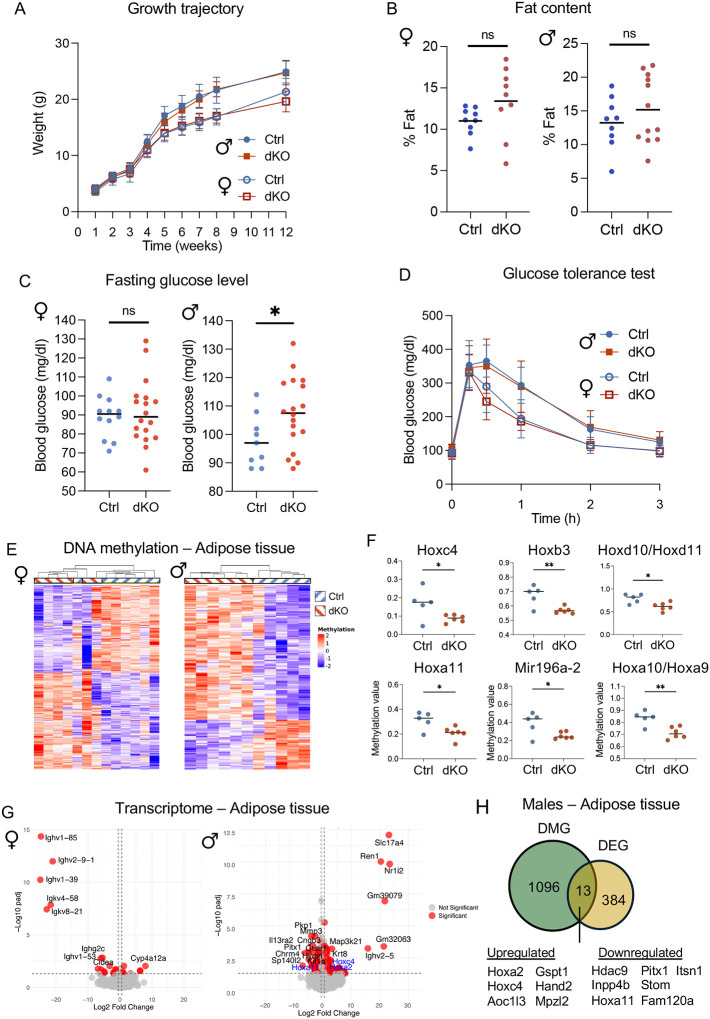
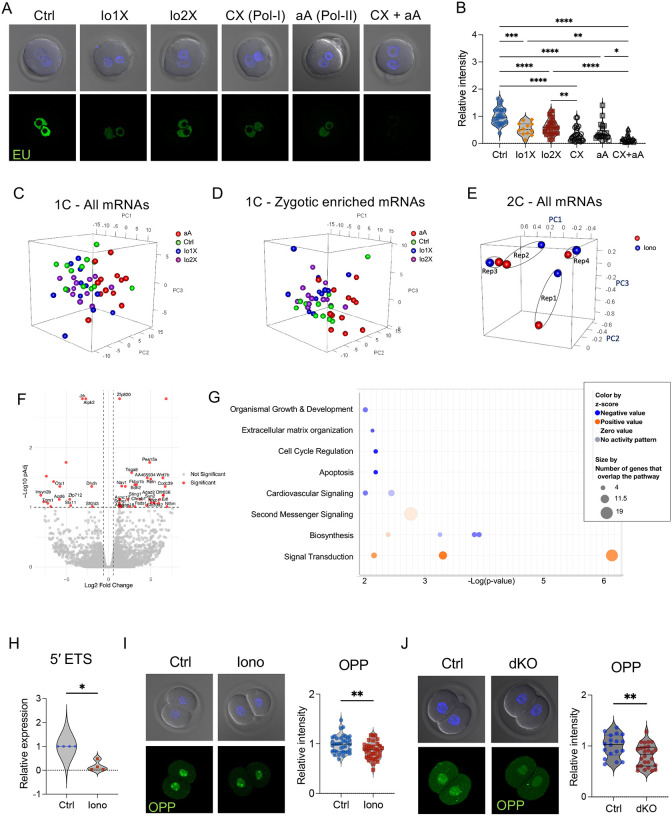
The use of assisted reproductive technologies (ART) has enabled the birth of over 9 million babies; but it is associated with increased risks of negative metabolic outcomes in offspring. Yet, the underlying mechanism remains unknown. Calcium (Ca2+) signals, which initiate embryo development at fertilization, are frequently disrupted in human ART. In mice, abnormal Ca2+ signals at fertilization impair embryo development and adult offspring metabolism. Changes in intracellular Ca2+ drive mitochondrial activity and production of metabolites used by the epigenetic machinery. For example, acetyl-CoA (derived mainly from pyruvate) and lactyl-CoA (derived from lactate) are used for writing H3K27ac and H3K18la marks that orchestrate initiation of development. Using both a genetic mouse model and treatment with ionomycin to raise intracellular Ca2+ of wild-type fertilized eggs, we found that excess Ca2+ at fertilization changes metabolic substrate availability, causing epigenetic changes that impact embryo development and offspring health. Specifically, increased Ca2+ exposure at fertilization led to increased H3K27ac levels and decreased H3K18la levels at the 1-cell (1C) stage, that persisted until the 2-cell (2C) stage. Ultralow input CUT&Tag revealed significant differences in H3K27ac and H3K18la genomic profiles between control and ionomycin groups. In addition, increased Ca2+ exposure resulted in a marked reduction in global transcription at the 1C stage that persisted through the 2C stage due to diminished activity of RNA polymerase I. Excess Ca2+ following fertilization increased pyruvate dehydrogenase activity (enzyme that converts pyruvate to acetyl-CoA) and decreased total lactate levels. Provision of exogenous lactyl-CoA before ionomycin treatment restored H3K18la levels at the 1C and 2C stages and rescued global transcription to control levels. Our findings demonstrate conclusively that Ca2+ dynamics drive metabolic regulation of epigenetic reprogramming at fertilization and alter EGA.

Keywords: DOHaD; Metabolofertility; artificial oocyte activation (AOA); lactylation; zygotic genome activation (ZGA).


Figures

Figure 1.
Figure 1.
Ca2+ responses are dramatically disrupted in PMCA1/PMCA3-null eggs. Ratiometric Ca2+ imaging during IVF of control (Ctrl, blue), PMCA3-KO (3KO, gray) and PMCA1/PMCA3 double KO (dKO, red) eggs. N = 3 independent experiments; (A) representative Ca2+ traces. (B) Length of the first Ca2+ transient. (C) Area under the curve (AUC) of Ca2+ signal, relative to controls. Horizontal bars indicate median. For (A-C) Kruskal-Wallis test with Dunnett’s multiple comparisons test were used; ns, not significant; **** p<0.0001. (D) Representative Ca2+ response (top) and NADH production (bottom) of Ctrl and dKO eggs during fertilization. (E) AUC of NADH levels, relative to controls. Unpaired t-test, **** p<0.0001. (F) Representative images of mitochondrial reactive oxygen species (mROS) levels detected with mitoSox red in MII eggs and 1C embryos from control and dKO females. (G) Representative images showing DNA damage levels in 1C embryos, detected using the γH2AX antibody. Samples include embryos from control and dKO females, as well as control embryos cultured with etoposide as a positive control.
Figure 2.
Figure 2.
Females carrying dKO eggs are subfertile due to impaired preimplantation embryo development. Fertility assessment of control (Ctrl, Blue), PMCA3-knockout (3KO, grey) and double-KO (dKO, red) females. (A) Number of eggs per superovulated female. (B) Live pups per litter after mating Ctrl, 3KO, and dKO females to WT males; each dot represents one litter from 9, 7 and 11 breeding pairs, respectively. For (A-B) horizontal bars indicate median. Kruskal-Wallis with Dunnett’s multiple comparisons test; *p<0.05; ***p<0.001. (C) Cumulative numbers of viable offspring produced by 5 representative females from each genotype during a 6-month breeding trial. (D-G) Impact of excess Ca2+ on fertilization and embryo development. Percentage of fertilized eggs following fertilization in vitro (D) or in vivo (F). Each dot represents an independent biological replicate and horizontal bars indicate median. Mann Whitney test; ns, not significant. In vitro fertilization was performed following zona-pellucida removal. A total of 88 Ctrl and 90 dKO zona-free eggs were included in the analysis. In vivo fertilized eggs were flushed from the oviduct at the 1C stage, and a total of 135 Ctrl and 145 dKO fertilized eggs were included in the analysis. (E, G) Percentage of embryos in panels D and F, respectively, to reach the various preimplantation embryo stages. Each dot represents an independent biological replicate. Preimplantation embryo stages 2C (2-cell), 4C (4-cell), M (morula) and B (blastocyst) stage embryos. For embryo development, the Chi-square test for proportions was used; *p<0.05, **p<0.01, ****p<0.0001.
Figure 3.
Figure 3.
Increased Ca2+ at fertilization alters offspring metabolic parameters. (A) Growth trajectories of dKO derived pups and genotype matching controls (Ctrl) shown as mean weight ± SEM over time. N= 9 female and 9 male pups obtained from a minimum of 7 different control females (blue). N= 24 female and 30 male pups from 9 different dKO dams (red). (B-C) Percentage of fat content (B) and blood glucose levels after 14 h fast (C) in female (left) and male (right) pups derived from Ctrl (blue) or dKO (red) dams. Each dot represents an individual animal and horizontal bars indicate median. Mann Whitney test: *p<0.05 (D) Glucose tolerance test plotted as mean blood glucose ± SEM over time. N= 11 female and 8 male pups from a minimum of 7 different control females (blue). N=11 female and 14 male pups from 7 different dKO dams (red). (E) Heat map of differentially methylated probes found in adipose tissue of female (left) and male (right) offspring derived from Ctrl (blue stripes) or dKO (red stripes) dams. Methylation values are displayed as row-scaled β-values, ranging from −2 (indicating lower methylation, shown in blue) to +2 (indicating higher methylation, in red). (F) Dot plots of DNA methylation values (β-values) for six representative probes associated with Hox family members in adipose tissue from Ctrl (blue) and dKO (red) male-derived adipose samples. Unpaired t-test *p<0.05; **p<0.01. (G) Volcano plots of differential gene expression between dKO and Ctrl females (left) and males (right) in adipose tissue. Red dots indicate padj<0.05 while DEGs with padj<0.01 are labeled by name. Genes from the Hox family are highlighted in blue text. (H) Venn Diagram of DEGs and genes associated with differentially methylated probes (DMG) in adipose tissue from male dKO- and Ctrl-derived pups.
Figure 4.
Figure 4.
Excess Ca2+ influences H3K27ac and H3K18lac levels and global transcription in early embryos. (A-F) Representative images of nuclear staining of embryos obtained from Ctrl (blue) and dKO (red) mice, and corresponding quantification of the intensity relative to controls. H3K27ac levels at the 1C (A) and 2C (B) stages. H3K18la levels at the 1C (C) and 2C (D) stages. Global transcription as indicated by 5-ethynyl uridine (EU) staining at the 1C (E) and 2C (F) stages. (G-L) Representative images of nuclear staining and corresponding quantification of intensity relative to controls in wild-type embryos from control (Ctrl, blue) and ionomycin-treated (Iono, red) groups. (G) H3K27ac levels and (H) H3K18la levels at the 1C stage. (I) H3K27ac levels and (J) H3K18la levels at the 2C stage. EU staining at the 1C (K) and 2C (L) stages. Unpaired t-test was performed for datasets with a normal distribution (G, J). For all others, a Mann-Whitney test was used; *p<0.05, **p<0.01, ****p<0.0001; ns, not significant. Red and blue mouse icons represent different mouse models, while red and blue flasks indicate orthologous design using ionomycin.
Figure 5.
Figure 5.
Excess Ca2+ at fertilization alters H3K27ac and H3K18la occupancy at the 2C stage. (A-B) Pie charts illustrating the genomic distribution of H3K18la (A) and H3K27ac (B) CUT&Tag marks in 2C-stage embryos. For each mark, distributions are shown for control (left) and ionomycin-treated embryos (right). (C) Heatmaps showing H3K18la and H3K27ac CUT&Tag signal in a 5 kb window around the summit, in control and ionomycin-treated embryos, organized by the highest to lowest signal. The number of gained and lost peaks after ionomycin treatment is indicated on the right. (D) Peak count frequency in promoters (+/− 3Kb from TSS) show minimal changes of H3K27ac and H3K18la marks in these regions. Pie charts on the right illustrate the genomic distribution of gained and lost peaks after ionomycin treatment. (E) Heatmaps and metaplots showing the co-occurrence of changes in H3K18la and H3K27ac marks within a close genomic region but in opposite directions, targeting the same associated genes (“co-targeted”). The top panel represents regions where H3K18la is gained while H3K27ac is lost, whereas the bottom panel shows regions where H3K18la is lost and H3K27ac is gained after ionomycin treatment. (F-G) Heatmaps and metaplots show changes in CUT&Tag signals for H3K18la (F) and H3K27ac (G) following ionomycin treatment at the promoters (TSS +/− 5Kb) of genes associated with major (top panel) and minor (bottom panel) EGA. Published reference data from Li et al. 2024 (for H3K18la) and Li et al. 2022 (for H3K27ac) are included for comparison. (H) Representative IGV tracks displaying CUT&Tag signals across two large genomic regions. Tracks show H3K18la signals in controls (top row) and ionomycin-treated samples (second row), as well as H3K27ac signals in controls (third row) and ionomycin-treated samples (fourth row). Differential peaks between ionomycin-treated and control samples are highlighted with red boxes.
Figure 6.
Figure 6.
Excess Ca2+ at fertilization alters Pol-I- but not Pol-II-mediated transcription in early embryos. (A) Representative images of global transcription (EU staining) in 1C embryos and (B) corresponding quantification of nuclear staining. Ctrl, control; Io1X, 1 pulse of ionomycin; Io2X, 2 pulses of ionomycin; CX, inhibitor of RNA polymerase I (Pol-I); α-amanitin (aA), inhibitor of RNA polymerase II (Pol-II); CX+aA, combination of inhibitors targeting Pol-I and Pol-II. (C-E) Principal component analysis (PCA) from poly-A enriched RNAseq samples. (C) PCA plot of expression of all mRNAs detected in 1C embryos. (D) PCA plot of zygotic enriched mRNAs. Each dot indicates a single embryo. (E) PCA plot of expression of all mRNAs detected in late 2-cell (L2C) embryos. Each dot indicates a single biological replicate containing a pool of 5 embryos of Ctrl (blue) or Ionomycin (red) samples. (F) Volcano plot of differential gene expression between Ctrl and Iono-derived embryos at the late 2C stage. Red dots indicate padj<0.1. (G) Top canonical pathways from Ingenuity Pathway Analysis for DEGs in embryos at the L2C stage obtained from controls and ionomycin treatments. Canonical pathways are displayed on the Y-axis and are sorted according to their p-value. (H) Relative quantification of 5′ETS expression levels in Ctrl and Iono samples at the 2C stage. Each dot represents an independent biological replicate with at least 20 embryos. RT-qPCR data was analyzed by the ΔΔCT method using Actb (β-actin) as a housekeeping gene. Mann-Whitney test; *p<0.05. (I-J) O-propargyl-puromycin (OPP) staining showing new translation in (I) Ctrl vs Ionomycin or (J) Ctrl vs dKO embryos at the 2C stage. Graphs on the right show the quantification of nuclear signal relative to controls. Mann-Whitney test; **p<0.01.
Figure 7.
Figure 7.
Excess Ca2+ alters H3K27ac and H3K18la marks and global transcription by changing pyruvate flux. (A) Representative images and quantification of nuclear staining for active pyruvate dehydrogenase (PDH) in control (Ctrl) and ionomycin-treated (Iono) embryos at the 2C stage. Unpaired t-test; *p<0.05. (B) Intracellular lactate levels at the 1C stage, expressed as relative light units (RLU). Mean is represented with a horizontal bar. T-test, **p<0.005. (C) Representative images and quantification of H3K18la levels in embryos at the 2C stage from Ctrl and Iono groups, as well as embryos microinjected with lactyl-CoA (Lac) and lactyl-CoA plus ionomycin (Lac+Iono). One-way ANOVA with Tukey’s multiple comparisons test; *p<0.05, ****p<0.0001; ns, not significant. (D) Representative images and quantification of global transcription activity (EU levels) in embryos at the 2C stage from Ctrl, Iono, Lac and Lac+Iono groups. Kruskal-Wallis with Dunnett’s multiple comparisons test; **p<0.005; ****p<0.0001. (E) Schematic representation of a working model illustrating Ca2+-triggered metabolic regulation of epigenetic reprogramming at fertilization.

References

    1. Stein P., Savy V., Williams A. M. & Williams C. J. Modulators of calcium signalling at fertilization. Open Biol 10, 200118 (2020). 10.1098/rsob.200118 - DOI - PMC - PubMed
    1. Markoulaki S., Matson S. & Ducibella T. Fertilization stimulates long-lasting oscillations of CaMKII activity in mouse eggs. Dev Biol 272, 15–25 (2004). 10.1016/j.ydbio.2004.04.008 - DOI - PubMed
    1. Ducibella T. et al. Egg-to-Embryo Transition Is Driven by Differential Responses to Ca2+Oscillation Number. Developmental Biology 250, 280–291 (2002). 10.1006/dbio.2002.0788 - DOI - PubMed
    1. Ozil J. P. et al. Egg activation events are regulated by the duration of a sustained [Ca2+]cyt signal in the mouse. Dev Biol 282, 39–54 (2005). 10.1016/j.ydbio.2005.02.035 - DOI - PubMed
    1. Savy V., Stein P., Shi M. & Williams C. J. PMCA1 depletion in mouse eggs amplifies calcium signaling and impacts offspring growth. Biol Reprod (2022). 10.1093/biolre/ioac180 - DOI - PMC - PubMed

Publication types

LinkOut - more resources