[Preprint]. 2025 Mar 13:2025.03.10.642406.
doi: 10.1101/2025.03.10.642406.

SORDINO for Silent, Sensitive, Specific, and Artifact-Resisting fMRI in awake behaving mice

Affiliations

SORDINO for Silent, Sensitive, Specific, and Artifact-Resisting fMRI in awake behaving mice

Martin J MacKinnon et al. bioRxiv. .

Abstract

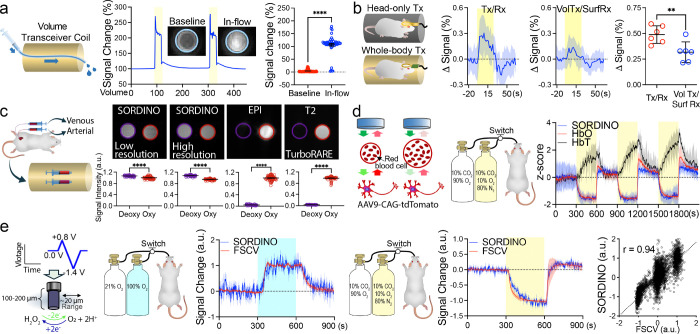
Blood-oxygenation-level-dependent (BOLD) functional magnetic resonance imaging (fMRI) has revolutionized our understanding of the brain activity landscape, bridging circuit neuroscience in animal models with noninvasive brain mapping in humans. This immensely utilized technique, however, faces challenges such as acoustic noise, electromagnetic interference, motion artifacts, magnetic-field inhomogeneity, and limitations in sensitivity and specificity. Here, we introduce Steady-state On-the-Ramp Detection of INduction-decay with Oversampling (SORDINO), a transformative fMRI technique that addresses these challenges by maintaining a constant total gradient amplitude while acquiring data during continuously changing gradient direction. When benchmarked against conventional fMRI on a 9.4T system, SORDINO is silent, sensitive, specific, and resistant to motion and susceptibility artifacts. SORDINO offers superior compatibility with multimodal experiments and carries novel contrast mechanisms distinct from BOLD. It also enables brain-wide activity and connectivity mapping in awake, behaving mice, overcoming stress- and motion-related confounds that are among the most challenging barriers in current animal fMRI studies.

Keywords: T1 contrast; acoustic noise; awake; behavior; brain networks; cerebral blood volume; electromagnetic interference; fMRI; functional connectivity; motion artifacts; mouse; rat; sensitivity; social; specificity; susceptibility artifacts; tissue oxygen.


Conflict of interest statement

Competing Interests Statement The authors declare no competing interests.

Figures

Figure 1.
Figure 1.. SORDINO sequence and modeling of its functional contrast.
(a) In SORDINO, the gradient changes constantly at an angular change rate α and has an extremely low slew rate, thus eliminating acoustic noise and Eddy current artifacts. Data acquisition commences exclusively and continuously throughout the non-stop gradient ramping, thus enhancing SNR. In this conceptual plot, dark green datapoints represent acquisition at nominal bandwidth and light blue datapoints represent the oversampled digitized datapoints. (b) Conceptual spoke evolution in a 2D plane, showing multiple curved spokes in k-space. (c) SORDINO gradient trajectory in 3D. (d) In the case of using a head-only excitation coil, the measured voxel signal is comprised of a mixture of stationary tissue and transient blood signal. Bloch equation simulations show that magnetization of stationary tissue reaches a steady-state within a few seconds (green dashed line), whereas the blood signal (red line) does not reach a steady-state at the time of measurement due to the short blood transit time, as fresh arterial blood would experience fewer RF excitations. Specific parameters for these simulations are detailed in Methods. (e) CBV contributions at the voxel level, considering: arterial transit time = 280 ms, baseline blood flow = 10 mm/s, local flow acceleration = 1.5 mm/s, activation radius = 1 mm, blood/tissue volume fraction = 5%, and CBV increase = 20%. Regionally accelerated blood would be subjected to 13 fewer RF-pulses and heightened the blood signal, resulting in a robust increase in SORDINO signal. (f) tO2 contribution at the voxel level: a physiological 30 μM transient increase in tissue oxygen corresponds to a 32 ms decrease in T1 from a baseline of 1900 ms (oxygen T1 relaxivity is 0.3 mM−1s−1.) The tO2-induced T1-shortening results in a measurable increase in the SORDINO-fMRI signal, taking approximately 1 s to establish a new steady-state. (g) The relationship between T1 changes and SORDINO-fMRI contrast is nearly linear across a range of gray matter T1 values (see Methods for detailed calculations).
Figure 2.
Figure 2.. SORDINO versus EPI.
(a) Comparison of acoustic noise induced by active SORDINO, ZTE, and EPI scanning against the scanner idle state. SORDINO effectively eliminates gradient-related acoustic noise, enabling silent imaging (n = 10 trials; one-way ANOVA, F(2,1499) = 20694, p-values are from Tukey’s HSD). (b, c) Mice undergoing a five-day head-fixation habituation process exhibit reduced stress hormone levels (Serum Cortisol: n = 49 baseline, n =32 SORDINO and n = 6 EPI; One-Way ANOVA;, F(6,156) = 38.79, p < 0.0001; p-values are from Tukey’s HSD) and maintain body weight in the SORDINO group but not in the EPI group (n = 15 SORDINO; Repeated Measures one-way ANOVA followed by Bonferroni multiple comparison test, effect of MRI sequence, F(1.87,26.10) = 6.76, p = 0.005; n = 6 EPI; Repeated Measures one-way ANOVA followed by Bonferroni multiple comparison test, effect of MRI sequence, F(1.45,7.26) = 12.65, p = 0.006. (d) Spike simulator and dummy cell setup for quantifying electromagnetic interference. (e) Electrophysiological recordings in MRI with and without active SORDINO, ZTE, and EPI scanning show that SORDINO significantly reduces electromagnetic interference, enabling online sorting of simulated neuronal spiking signals without additional pre-processing. (f) Electrochemical recording using fast-scan cyclic voltammetry in MRI demonstrates that SORDINO allows real-time recording without requiring the interleaved recording approach previously reported for EPI. Results are presented as the mean oxidation current recorded at 0.65V vs. Ag/AgCl reference electrode with the corresponding range. (g) SORDINO’s versatility supports the placement of a calcium miniscope above the mouse head, enabling unprecedented real-time calcium imaging at cellular resolution during brain-wide fMRI. Calcium activities from 103 neurons in the prelimbic cortex (PrL) are displayed during SORDINO off and on periods. (h) Active SORDINO scanning does not compromise calcium imaging quality, as indicated by consistent mean intensity and peak amplitude measurements. (i) Ghosting artifacts are absent in SORDINO compared to EPI (n = 19 independent trials; two-tailed paired t-test, t(18) = 1006.18, p < 0.0001). (j) Using Cartesian-sampled spin-echo data as the ground truth, SORDINO shows no structural distortion compared to EPI (n = 60 measurements; two-tailed paired t-test, t(59) = 21.26, p < 0.0001). (k) In vivo comparison of SORDINO and EPI images from the same subject under identical shimming reveals reduced susceptibility artifacts in several regions, including the amygdala (arrowheads). (l) Regional homogeneity (ReHo) analysis on resting-state data indicates preserved local correlation in susceptibility artifact-prone regions with SORDINO, while EPI shows nearly zero ReHo in these regions (n = 9; two-tailed paired t-test, t(8) = 7.49, p = 0.0003). (m) Passive forelimb movement created by using a box-design in a deeply anesthetized mouse demonstrates that SORDINO drastically reduces motion-correlation artifacts. (n) Correlation histograms depict brain voxels with strong positive and negative correlations to the motion paradigm in EPI, which are absent in SORDINO. (o) Six motion parameters and FD extracted from resting-state SORDINO and EPI acquisitions show that SORDINO is immune to motion confounds (n = 30 subjects; two-tailed paired t-test between all parameters: t(29) = 1.36 – 7.60, p < = 0.0000–0.19; Two-tailed paired t-test between groups in FD: t(29) = 10.53, p < 0.0001). (p) SORDINO demonstrates robust sensitivity compared to GRE-EPI-BOLD using a within-subject, within-session design at identical spatiotemporal resolution (n = 16 subjects, 80 unique trials; linear mixed effects model, β = 0.82, p < 0.0001). (q) tSNR in the somatosensory cortex comparison from resting-state SORDINO data (n = 9). The higher tSNR in SORDINO allows the rather small T1-related changes to be detected. (r) SORDINO demonstrates comparable resting-state FC measurement to GRE-EPI-BOLD. FC variation and spatial reliability are measured using seed-based analysis, leveraging the intrinsic homotopic FC feature in the somatosensory cortex across hemispheres. Randomly sampled time-series data lengths (100 random selections per length) highlight the comparable time needed to depict reliable FC compared to the full data length. Results are expressed as mean ± SEM. *p<0.05, **p<0.01, ***p<0.001 and ****p<0.0001 compare with SORDINO, baseline, or indicated groups; #p<0.05 and ####p<0.0001 compare with indicated groups. ns, not significant.
Figure 3.
Figure 3.. SORDINO contrast mechanisms.
(a) SORDINO demonstrates sensitivity to inflowing spins, enabling arterial CBV contrast in vivo (n = 1 trial; 383 volumes at baseline and 52 during inflow; two-tailed unpaired t-test, t(433) = 51.08, p < 0.0001). (b) Whole-body RF excitation, compared to head-only RF excitation, eliminates CBV contributions but retains 60% of signal changes during forepaw stimulation, suggesting the presence of functional contrast mechanisms beyond CBV (n = 6 subjects; two-sided paired t-test, t(5) = 2.57, p = 0.049). (c) SORDINO lacks hemoglobin-related “BOLD” contrast. While SORDINO shows positive responses to forepaw stimulation-induced activation in S1 (see Figures 2p, S5, and 3b), deoxygenated hemoglobin exhibits stronger SORDINO signals than oxygenated hemoglobin under SORDINO-fMRI parameters (left; n = 69 datapoints; two-tailed unpaired t-test, t(13) = 11.27, p < 0.0001) and anatomical scans with long spoke TR (right; n = 69 datapoints; two-tailed unpaired t-test, t(13) = 34.27, p < 0.0001). In contrast, conventional BOLD effects are reliably observed in EPI (n = 69 datapoints; two-tailed unpaired t-test, t(13) = 92.73, p < 0.0001) and T2-weighted scans (n = 69 datapoints; two-tailed unpaired t-test, t(13) = 126.10, p < 0.0001). These findings indicate that SORDINO relies on contrast mechanisms distinct from BOLD. Notably, most (~99%) oxygen in blood is bound to hemoglobin, with minimal dissolved oxygen present. This makes the molecular oxygen effects negligible in this measurement. (d, e) Validation of SORDINO’s sensitivity to tissue oxygenation changes was achieved through concurrent fiber photometry and FSCV recordings. (d) Under hypercapnic conditions, hypoxic gas challenges resulted in increased CBV and decreased blood and tissue oxygenation, as measured by fiber photometry. The SORDINO signal closely tracked oxyhemoglobin changes rather than total hemoglobin levels, highlighting its sensitivity to non-BOLD, yet oxygen-related contrasts. Yellow boxes indicate the hypoxic gas challenge periods (n = 4, 3 unique trials per subject). (e) SORDINO signal changes aligned with concurrently recorded tissue oxygenation ground-truth measurements using FSCV. Left: In a hyperoxic gas challenge experiment, SORDINO signals mirrored the dynamics of tissue oxygenation (blue box indicates the hyperoxic period). Middle: During hypoxic gas challenges, SORDINO signals also closely matched tissue oxygenation changes (yellow box indicates the hypoxic period). Right: The scatter plot demonstrates a strong correlation between SORDINO signals and tissue oxygen levels (n = 3, 3 trials per animal). Results are expressed as mean ± SEM. **p<0.01 and ****p<0.0001 compared with indicated groups.
Figure 4.
Figure 4.. SORDINO for functional connectome mapping in awake mice.
(a) Mouse wearing a custom headplate coil in a 3D-printed cradle for functional connectivity mapping in awake condition. (b) Distribution of FD data from all subject time-courses, representing FD values across every time point and displayed as a log-scale density histogram (n = 25). SORDINO data were acquired at 400 μm isotropic spatial resolution and 2 s temporal resolution, continuously for 900 volumes. The effects of nuisance removal across all subject time-courses are shown in (c) D-variate temporal standard deviation (DVARS) histogram, (d) scatterplot between FD and DVARS, and (e) tSNR histogram. (f) Voxel-wise seed-based connectivity maps from the left S1 (green) and RSC (blue) seeds across all subjects (n = 25) are shown using a second-level permutation method thresholded at p < 0.01 (FWE-corrected) and r > 0.3. (g) A Gaussian/Gamma mixture model was fitted to characterize the distribution of seed-based connectivity map. Voxels with low connectivity to the seed region were modeled by the Gaussian component (blue), while voxels with high connectivity with seed region were modeled by the Gamma component (red). (h) A probability curve was computed to identify the boundary between the Gaussian (blue) and Gamma (red), and the resulting boundary values were used as thresholds for determining functional specificity. (i) Functional connectivity specificity scatter plot showing the distribution of individual subject specificity data, defined as homotopic S1 functional connectivity across hemispheres (mirroring the seed shown in (f), expected to be high in a robust dataset) relative to S1-RSC functional connectivity (expected to be low in a robust dataset). Subjects in the upper left quadrant exhibit high functional connectivity specificity, while the other three quadrants represent unspecific functional connectivity, spurious functional connectivity, and no functional connectivity. (j) ICA-derived “triple-network” patterns in awake mice. Coronal sections show the intrinsic large-scale networks including, DMN, LCN, SN. (k) Functional connectivity measured in awake mice undergoing SORDINO (n = 25) and analyzed using Allen Brain Mouse Brain ROIs is shown in the lower left of the matrix, while the Allen Atlas structural connectivity pattern is displayed in the upper right of the matrix, illustrating the functional-structural relevance of the mouse brain connectome. N1: Limbic and Associative Network, N2: Sensorimotor-Cognitive Integration Network, N3: Hippocampal-Prefrontal Associative Network, N4: Retrosplenial and Visual Network, N5: Somatosensory and Motor Network, N6: Primary Sensory Network, N7: Associative Visual Network, N8: Prefrontal Cognitive Network, N9: Limbic Emotional Network, N10: Motivational and Memory Network. N11: Visual and Entorhinal Network. N12: Subcortical Limbic Network. N13: Thalamic Relay Network.
Figure 5.
Figure 5.. SORDINO for mapping skilled motor actions.
(a) Custom pneumatic system enables grabbing task performance in head-fixed mice. (b) Mice perform reach-and-grasp tasks during SORDINO-fMRI. (c-e) Brain-wide activity maps and time-courses show consistent motor cortex activation and retrosplenial cortex deactivation, followed by subsequent activation of thalamus, cerebellum, and sensory cortices (n = 4, in the total of 24 fMRI sessions with 75–100 grabbing events per session). A linear mixed-effects model is utilized to compare the activity at time = 0, 2, and 4 s to the baseline (averaged activity at time = −6, −4, and −2). Results are expressed as mean ± SEM. (*p<0.05).
Figure 6.
Figure 6.. Mapping inter-brain synchronization in awake, socially interacting mice using SORDINO hyperscanning.
(a) A 3D-printed cradle holds mice face-to-face, initially separated by a remotely retractable divider, enabling dual-brain SORDINO-fMRI hyperscanning. (b) A SORDINO image with an extended FOV along the gradient z-axis, showing the actual distance between the brains of two subjects. (c) SORDINO hyperscanning captured brain responses during social encounters initiated by divider removal (n = 22, grouped in 11 pairs, averaged signal change map, threshold = ±0.6%). Following divider removal, activations peaked at 4 s in DMN nodes (RSC, Cg, PrL) and the AI of the SN, followed by deactivations peaking at 8 s in LCN nodes (M1, S1FL, S1BF). (d-f) Inter-brain synchronization emerged only in socially interacting mice without the divider. (d) Mirrored inter-brain connectivity appeared in RSC, Cg, PrL, and AI post-divider removal (n = 11 pairs, one-sample t-test, p < .01), absent during baseline. (e) ROI analysis showed significant inter-brain connectivity among DMN, SN, and M1 only after divider removal, as illustrated in the right chord diagram (top and bottom hemispheres represent individual brains of paired mice, n = 22, one-sample t-test, p < 0.001, FDR corrected with Benjamini-Hochberg procedure). (f) Spatial correlation analysis indicated enhanced inter-brain synchrony of activation patterns within DMN and SN post-divider removal. (Left: spatial correlation distribution across pre- or post-divider-removal time period; Right: mean spatial correlation within subjects, pre- and post-divider-removal, n = 11 pairs, paired t-test, p < .001). (g) SORDINO signals within DMN and SN regions showed significant inter-brain synchronization with the socially interacting partner’s RSC, Cg, PrL, AI, and M1, but not with the partner’s S1 (n = 22, one-sample t-test, p < .001). AI, anterior insula; AUD, auditory cortex; BLA, basolateral amygdala; Cg, cingulate cortex; CLA, claustrum; Hipp, hippocampus; IL, infralimbic cortex; M1, motor cortex; Orb, orbitofrontal cortex; PrL, prelimbic cortex; RSC, retrosplenial cortex; S1, somatosensory cortex; V1, visual cortex.

References

    1. Ogawa S. et al. Intrinsic signal changes accompanying sensory stimulation: functional brain mapping with magnetic resonance imaging. Proc Natl Acad Sci USA 89, 5951–5955 (1992). - PMC - PubMed
    1. Kwong K. K. et al. Dynamic magnetic resonance imaging of human brain activity during primary sensory stimulation. Proc Natl Acad Sci USA 89, 5675–5679 (1992). - PMC - PubMed
    1. Bandettini P. A., Wong E. C., Hinks R. S., Tikofsky R. S. & Hyde J. S. Time course EPI of human brain function during task activation. Magn. Reson. Med. 25, 390–397 (1992). - PubMed
    1. Gore J. C. Principles and practice of functional MRI of the human brain. J. Clin. Invest. 112, 4–9 (2003). - PMC - PubMed
    1. Logothetis N. K. What we can do and what we cannot do with fMRI. Nature 453, 869–878 (2008). - PubMed

Publication types

LinkOut - more resources