[Preprint]. 2025 Apr 9:2025.03.12.642624.
doi: 10.1101/2025.03.12.642624.

Multi-omic landscape of human gliomas from diagnosis to treatment and recurrence

Affiliations

Multi-omic landscape of human gliomas from diagnosis to treatment and recurrence

Hadeesha Piyadasa et al. bioRxiv. .

Abstract

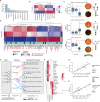
Gliomas are among the most lethal cancers, with limited treatment options. To uncover hallmarks of therapeutic escape and tumor microenvironment (TME) evolution, we applied spatial proteomics, transcriptomics, and glycomics to 670 lesions from 310 adult and pediatric patients. Single-cell analysis shows high B7H3+ tumor cell prevalence in glioblastoma (GBM) and pleomorphic xanthoastrocytoma (PXA), while most gliomas, including pediatric cases, express targetable tumor antigens in less than 50% of tumor cells, potentially explaining trial failures. Longitudinal samples of isocitrate dehydrogenase (IDH)-mutant gliomas reveal recurrence driven by tumor-immune spatial reorganization, shifting from T-cell and vasculature-associated myeloid cell-enriched niches to microglia and CD206+ macrophage-dominated tumors. Multi-omic integration identified N-glycosylation as the best classifier of grade, while the immune transcriptome best predicted GBM survival. Provided as a community resource, this study opens new avenues for glioma targeting, classification, outcome prediction, and a baseline of TME composition across all stages.


Conflict of interest statement

Declaration of interests M.A. and S.B. are named inventors on patent US20150287578A1, which covers the mass spectrometry approach utilized by MIBI-TOF to detect elemental reporters in tissue using secondary ion mass spectrometry. M.A. and S.B. are board members and shareholders in IonPath, which develops and manufactures the commercial MIBI-TOF platform.

Figures

Figure 1.
Figure 1.. BRUCE (BRain tUmor heterogeneity deCiphEred by high dimensional multi-omic analysis) cohort and data overview.
(A) BRUCE cohort summary (310 patients, 677 samples), including patient demographics, (B) sample distribution and (C) the spatial modalities (transcriptomics, proteomics, N-glycome) used for data acquisition from FFPE sections (D) Illustration of web resource.
Figure 2.
Figure 2.. Immune cell and targetable tumor antigen (TA) characterization across glioma subtypes using spatial proteomics.
(A) Antibody marker panel used to identify various cell types including tumor, immune, neuronal, endothelial, and regulatory cells, as well as segmentation markers. (B) Cellular composition of the tumor microenvironment, highlighting targetable antigen positive tumor cells and immune cells, with a detailed breakdown of myeloid and lymphoid subpopulations. (C) Representative MIBI images highlighting various markers. (D) Heatmap displaying immune cell populations across different glioma subtypes. Color represents row wise Z-score average abundance and circle size represents Log10 average abundance (relative to all immune cells). (E) Representative spatial maps showing immune and tumor cell distribution in glioma subtypes, including GBM, PXA, oligodendroglioma, and astrocytoma. (F) Heatmap displaying TA across glioma subtypes. Color represents row wise Z-score intensity and circle size represents Log10 average abundance (relative to all immune cells)
Figure 3.
Figure 3.. Comprehensive analysis of tumor antigen diversity, coverage, and coexpression in gliomas.
(A) Boxplot of Shannon diversity index showing TA heterogeneity across different tumor subtypes. (b-c) Line graph showing % tumor cell coverage with increasing TA. Error bars show SD. (D) Top two tumor antigen expression heatmap shows % patients for combinations of selected top 2 TA yielding maximal coverage of tumor cells for high TA diversity glioma. (E) Venn diagrams showing % of tumor cells positive and overlap for B7H3, EGFR and HER2 out of total tumor cells in high TA diversity gliomas. (F) Representative tumor CPM images, illustrating the distribution of tumor antigens for coverage and coexpression. (G) Violin plot of % tumor cells negative for the 7 TA measured. Each dot represents an individual patient.
Figure 4.
Figure 4.. Dynamic range of expression of targetable tumor antigens (TA) in gliomas.
Scatter plot for (A) B7H3 and (B) EGFR showing mean intensity on Y axis, and % positive tumor cells on the x axis. Size of each dot indicates the intrapatient dynamic range of expression. Each dot represents an individual patient. Colors identify tumor type. Shaded region shows theoretical mean intensity and % positive tumor cells of CD19 in B cell malignancies. (C) Point plot showing the log2 fold change from the median intensity. 10,000 cells per TA sampled. Color scale represents Log2 fold change capped at −1.5 and 1.5 (D) Representative MIBI CPM of tumor antigen expression. Color scale shows the log2 fold change from median shown in panel a. Scale bar = 100 μm.
Figure 5:
Figure 5:. Analysis of distinct spatial niches and therapy-induced changes within the TME of longitudinally sampled low-grade gliomas.
(A) Schematic overview of the QUICHE analysis pipeline. (B) Overview of the longitudinal LGG cohort with paired primary and recurrent samples, including a subset of patients treated with immunotherapy. Spatial interaction graphs derived from differentially abundant niches for (C) primary and (D) recurrent tumors. Edge width and color corresponds to the number of unique patients with the interaction. (E) Differential abundance analysis of immune cell types between recurrent and primary tumors in the SOC cohort, showing log2 fold changes and statistical significance (circle size indicates -log10 p-value). (F) Volcano plot comparing log2 fold changes of immune cells with functional marker classification between SOC and immunotherapy-treated patients, highlighting (red) significant differences. (G) Representative images of multiplexed single-cell spatial TME landscapes, showing functional marker co-expression within immune cell subsets.
Figure 6.
Figure 6.. Multi-omic profiling of the TME.
(A) Bar graph % of glycans identified in each N-glycan class across glioma samples (B) Heatmap depicting the relative intensity (Z-score) of glycan classes across WHO grades 2, 3, and 4 (C) Boxplots of relative intensity for selected glycans from different glycan classes across WHO grades, with corresponding representative images of glycan staining illustrating low and high glycan expression in different patient samples. Glycan structures are displayed beside the boxplots (D) Heatmap showing the Z-score expression of both glycans and RNA for glycan processing enzymes that were differentially expressed between any WHO grades. Glycans are identified by cyan, and RNA is identified by dark blue. (E) Network diagram showing cell types linked to glycan classes (fucosylated, agalactosylated, sialylated, tri-antennary) and their associated biological processes, derived from multi-omic analysis. Edge weights between cells and glycans indicate correlation coefficient while edge weights between glycans and biological processes indicate gene ratio (genes identified with high correlation / total genes in pathway) (F) Heatmap of the top 25 genes correlated with glycan expression, with rows representing glycan classes and columns representing genes, colored by correlation strength. (G) Scatter plot illustrating the relationship between NRXN1 expression and fucosylated glycans, with dot size representing the neuron-to-tumor cell ratio and color indicating WHO grade. (H) Scatter plot showing the association of GRN expression with sialylated glycans, with dot size reflecting CD209+ DC/Mac abundance and color corresponding to WHO grade.
Figure 7.
Figure 7.. Multi-omic classification of glioma grades and survival features.
(A) Schematic of the study design for classifying glioma patients by WHO grade (2, 3, 4) and distinguishing between short-term and long-term survivors in GBM using multi-omic data (transcriptome, proteome, N-glycome) (B) Boxplot showing the Area Under the Curve (AUC) for the WHO grade classifier with original and permuted labels. (C) Top 75 Log10 importance scores for different feature types (glycans, CD45+ and CD45- cell RNA, and MIBI) used in the WHO grade classifier. (D) Top 25 feature importance ranking. Glycan (Cyan), MIBI (red), CD45- cell RNA (dark blue) and CD45+ cell RNA (light blue) (E) Boxplot of endothelial cell CD31 intensity across WHO grades, with high and low representative image of CD31 expression. Whole image shows CPM with endothelial cells colored in red (F) Inset shows raw CD31 marker expression (G) Boxplot showing VEGFA RNA expression levels across WHO grades for CD45- cell populations. (H) Boxplot showing AUC values for the survival classifier with original and permuted labels (I) Top 75 Log10 importance scores for different feature types (glycans, CD45+ and CD45- cell RNA, and MIBI) used in the WHO grade classifier (J) Principal Component Analysis (PCA) plot using top 75 features from multi omic classifier. Each dot represents a patient. blue for long term survivors (>1.5 years) and red for short term survivors (<1.5 years).

References

    1. Ostrom Q.T., Cioffi G., Waite K., Kruchko C., and Barnholtz-Sloan J.S. (2021). CBTRUS Statistical Report: Primary Brain and Other Central Nervous System Tumors Diagnosed in the United States in 2014–2018. Neuro-Oncology 23, iii1–iii105. 10.1093/neuonc/noab200. - DOI - PMC - PubMed
    1. Mohammed S., Dinesan M., and Ajayakumar T. (2022). Survival and quality of life analysis in glioblastoma multiforme with adjuvant chemoradiotherapy: a retrospective study. Rep Pract Oncol Radiother 27, 1026–1036. 10.5603/RPOR.a2022.0113. - DOI - PMC - PubMed
    1. Al Sharie S., Abu Laban D., and Al-Hussaini M. (2023). Decoding Diffuse Midline Gliomas: A Comprehensive Review of Pathogenesis, Diagnosis and Treatment. Cancers (Basel) 15, 4869. 10.3390/cancers15194869. - DOI - PMC - PubMed
    1. Liu Y., Zhou F., Ali H., Lathia J.D., and Chen P. (2024). Immunotherapy for glioblastoma: current state, challenges, and future perspectives. Cell Mol Immunol 21, 1354–1375. 10.1038/s41423-024-01226-x. - DOI - PMC - PubMed
    1. Hervey-Jumper S.L., and Berger M.S. (2014). Role of Surgical Resection in Low- and High-Grade Gliomas. Curr Treat Options Neurol 16, 284. 10.1007/s11940-014-0284-7. - DOI - PubMed

Publication types