[Preprint]. 2025 Mar 14:2025.03.13.642867.
doi: 10.1101/2025.03.13.642867.

Microtubule-dependent cell polarity regulates skin-resident macrophage phagocytosis and directed cell migration

Affiliations

Microtubule-dependent cell polarity regulates skin-resident macrophage phagocytosis and directed cell migration

Eric Peterman et al. bioRxiv. .

Abstract

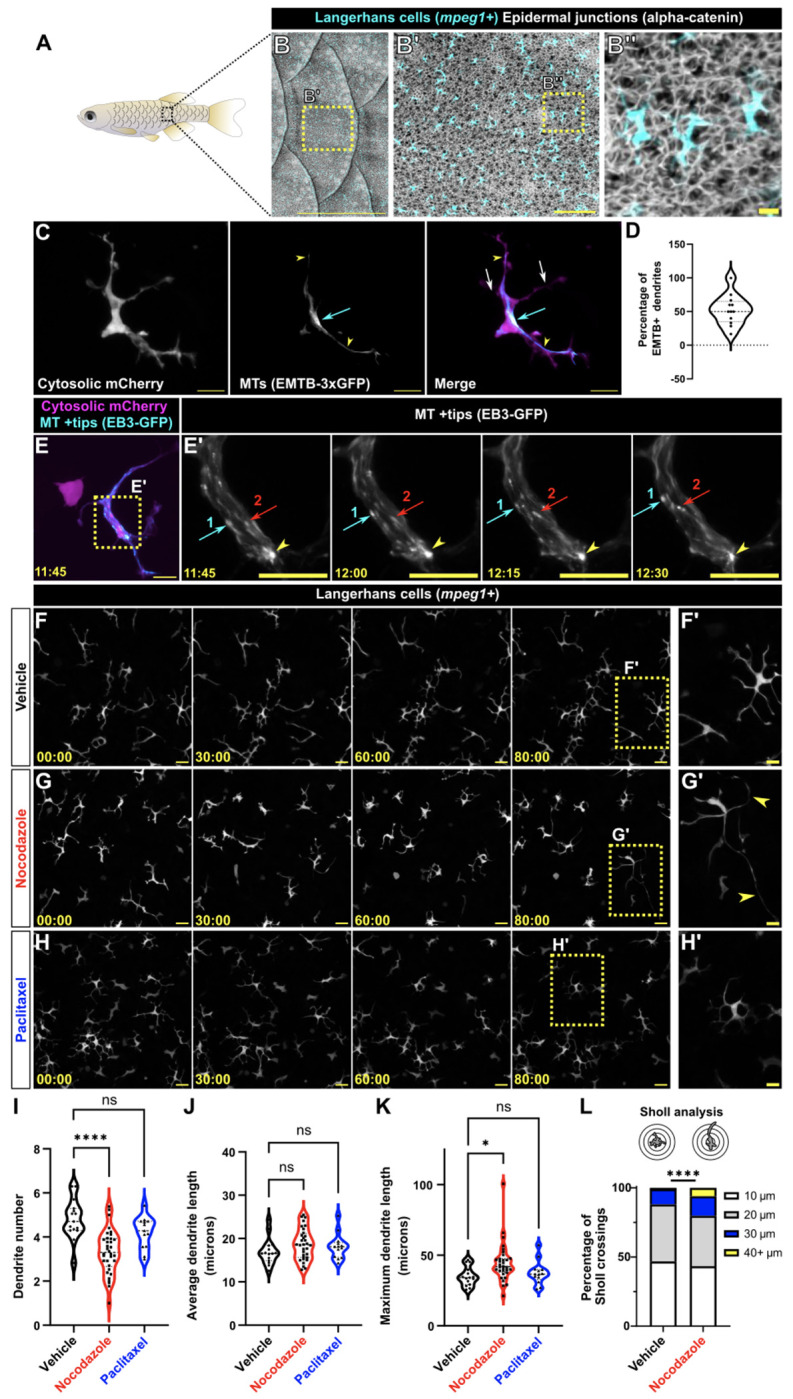
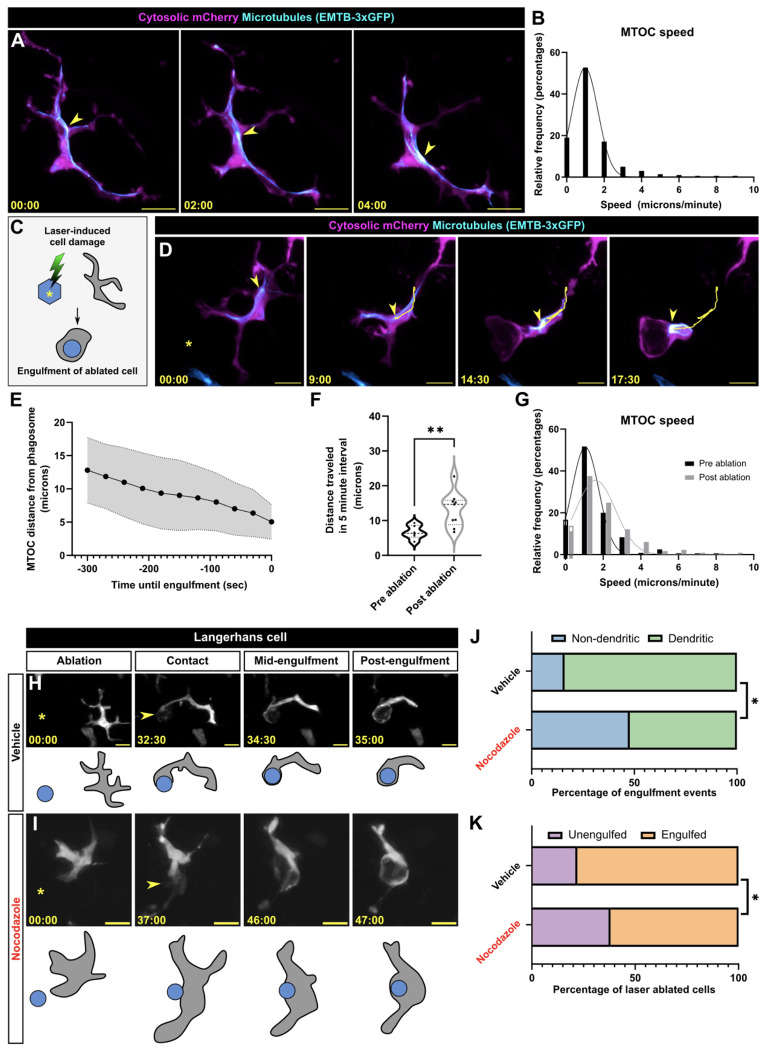
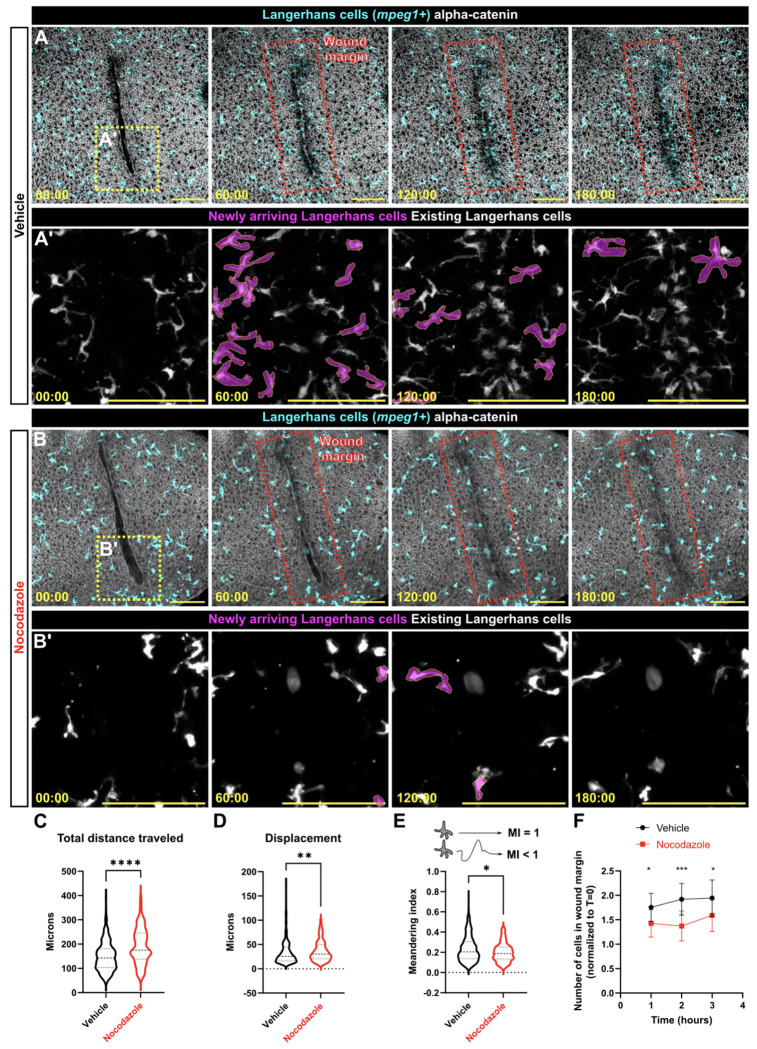
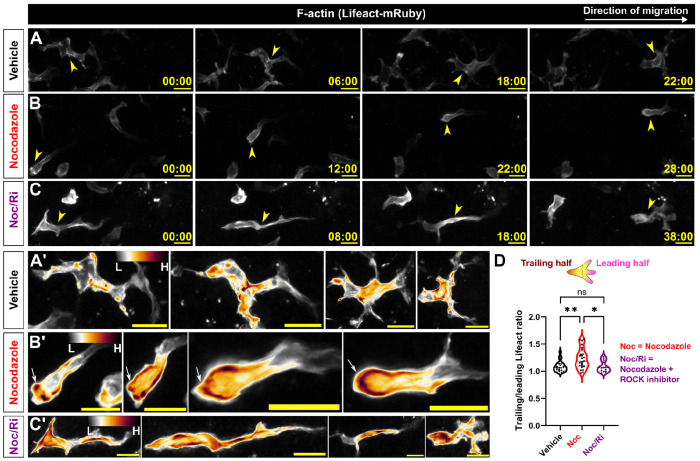
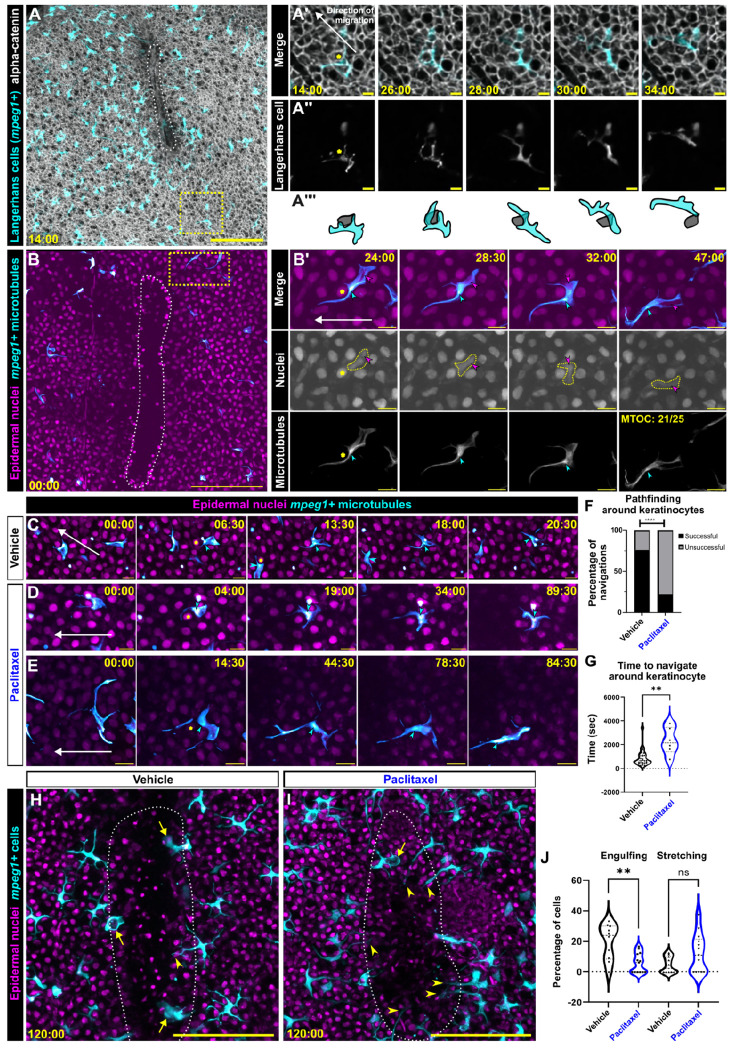
Immune cells rapidly respond to tissue damage through dynamic properties of the cytoskeleton. How microtubules control immune cell functions during injury responses remains poorly understood. Within skin, tissue-resident macrophages known as Langerhans cells use dynamic dendrites to surveil the epidermis for damage and migrate through a densely packed epithelium to wounds. Here, we use Langerhans cells within the adult zebrafish epidermis as a model to investigate roles for microtubules in immune cell tissue surveillance, phagocytosis, and directed migration. We describe microtubule organization within Langerhans cells, and show that depolymerizing the microtubule cytoskeleton alters dendrite morphology, debris engulfment, and migration efficiency. We find that the microtubule organizing center positions adjacent to engulfed debris and that its position correlates with navigational pathfinding during directed cell migration. Stabilizing microtubules prevents Langerhans cell motility during directed cell migration by impairing navigation around cellular obstacles. Collectively, our work demonstrates requirements for microtubules in the dynamic actions of tissue-resident macrophages during epithelial surveillance and wound repair.

Keywords: Microtubule; migration; phagocytosis; skin; tissue-resident macrophage; zebrafish.


Conflict of interest statement

Declaration of interests The authors declare no competing interests.

Figures

Figure 1.
Figure 1.. Microtubule depolymerization disrupts Langerhans cell morphology.
A. Illustration of adult zebrafish showing overlapping scales along the trunk skin. B. Confocal images of adult trunk skin expressing reporters for Langerhans cells [Tg(mpeg1:mCherry)] and alpha-catenin [Gt(ctnna1-Citrine)], which labels epidermal junctions. C. Representative image of a Langerhans cell expressing Tg(mpeg1.1:mCherry;mpeg1.1:EMTB-3xGFP) showing EMTB-3xGFP+ dendrites (yellow arrowheads), EMTB-3xGFP- dendrites (white arrows), and the presumptive microtubule organizing center (cyan arrow). D. Violin plot showing percentage of EMTB+ dendrites (n = 12 cells from N = 5 scales). E. Representative still images from time-lapse confocal microscopy of a Tg(mpeg1.1:mCherry;mpeg1.1:EB3-GFP)+ Langerhans cell showing the perinuclear focus of EB3 signal (yellow arrowhead). Yellow box in left panel denotes region magnified in the panels at right. Red and cyan arrows track individual growing microtubules. F-H. Representative still images from time-lapse confocal microscopy depicting effects of vehicle (F), nocodazole (G), or paclitaxel (H) treatment on Tg(mpeg1.1:YFP)+ Langerhans cell morphology. Yellow arrowheads in (G) indicate elongated dendrites. I-K. Violin plots showing average dendrite number (I), average dendrite length (J), or maximum dendrite length (K) through 80 minutes of vehicle, nocodazole, or paclitaxel treatment. n = 15 cells tracked from N = 3 scales for vehicle control, n = 27 cells tracked from N = 5 scales for nocodazole, n = 13 cells tracked from N = 6 scales for paclitaxel. L. Sholl analysis of dendrite lengths in vehicle- and nocodazole-treated conditions. n = 698 dendrites tracked in 14 cells from N = 3 scales for vehicle control and n = 476 dendrites tracked in 11 cells from N = 3 scales for nocodazole. Statistical significance in (I, J, K) was determined using Mann-Whitney U test, statistical significance in (L) was determined using a chi-squared test with the raw number of dendrites. * = p < 0.05, **** = p < 0.0001. Timestamps denote mm:ss. Scale bars, 1 mm (B), 100 μm (B’), 10 μm (B”, C, E, F’-H’), 20 μm (F-H).
Figure 2.
Figure 2.. MTOC dynamics and microtubule requirements during debris engulfment.
A. Representative still images from time-lapse confocal microscopy of a Tg(mpeg1.1:mCherry;mpeg1.1:EMTB-3xGFP)+ Langerhans cell showing MTOC (yellow arrowhead) movement in steady-state conditions. B. Histogram showing the frequency distribution of MTOC speed in steady-state conditions, n = 10 cells tracked from N = 5 scales. C. Schematic of laser-induced keratinocyte (blue) damage and subsequent Langerhans cell engulfment. D. Representative still images from time-lapse confocal microscopy showing MTOC (yellow arrowhead) motility preceding engulfment of debris generated by keratinocyte laser ablation. Yellow trace indicates the MTOC track over time. Yellow asterisk indicates the site of laser ablation. E. Quantification of the distance between the MTOC and phagosome in the 5 minutes prior to debris engulfment, n = 9 cells tracked from N = 4 scales. Gray shading represents a 95% confidence interval. F. Violin plot of the total distance traveled by the MTOC 5 minutes prior to keratinocyte laser ablation and 5 minutes prior to keratinocyte engulfment, n = 6 cells tracked in pre ablation, n = 9 cells tracked in post ablation from N = 4 scales. G. Histogram of the frequency distribution of MTOC speed 5 minutes prior to keratinocyte laser ablation and 5 minutes prior to keratinocyte engulfment , n = 6 cells tracked in pre ablation, n = 9 cells tracked in post ablation from N = 4 scales. H,I. Representative still images from time-lapse confocal microscopy of vehicle- (H) or nocodazole-treated (I) Tg(mpeg1.1:YFP)+ Langerhans cells showing engulfment of debris. Yellow asterisk indicates the site of laser ablation. Yellow arrowhead indicates site of first contact between the Langerhans cell and laser-damaged cell. J. Quantification of engulfment modality used to engulf debris, n = 25 engulfment events tracked from N = 3 individual experiments for vehicle control, n = 23 ablation events tracked from N = 3 individual experiments for nocodazole. K. Quantification of successful keratinocyte debris engulfment following addition of vehicle or nocodazole, n = 30 ablated cells tracked from N = 3 individual experiments for vehicle control, n = 26 ablated cells tracked from N = 3 individual experiments for nocodazole. Statistical significance in (F) was determined using a Mann-Whitney U test. A Kolmogorov-Smirnov test was used in (G) and revealed no significant difference. Fisher’s exact test was used to determine significance in (J,K) by using the raw counts of engulfment events. Traces in frequency distribution graphs (B) and (G) are Gaussian fits. * = p < 0.05, ** = p < 0.01. Timestamps denote mm:ss. Scale bars, 10 μm (A,D,H,I).
Figure 3.
Figure 3.. Langerhans cell migration to scratch wounds requires microtubules.
A,B. Langerhans cell migration to epidermal scratch in vehicle- (A) or nocodazole-treated (B) conditions. Yellow boxes in first frames of (A, B) indicate insets in A’, and B’, red boxes in frames 2-4 indicate the wound margin ROI corresponding to cell counts in (F). Newly arriving Langerhans cells are pseudocolored magenta in A’, B’. C-E. Violin plots showing total distance traveled (C), displacement (D), or the meandering index (E) of mpeg1+ cells over 3 hours in response to epidermal scratch in vehicle- or nocodazole-treated conditions, n = 325 cells from N = 11 skin explants tracked in vehicle conditions, n = 181 cells from N = 10 skin explants tracked in nocodazole conditions. F. Quantification of the normalized number of mpeg1+ cells in the wound margin in vehicle- or nocodazole-treated conditions, N = 13 skin explants for vehicle conditions, N = 12 skin explants for nocodazole conditions. Mann Whitney U tests were used to determine significance in (C-E), two-way ANOVA followed by Bonferroni post-test was used to determine significance in (F). * = p < 0.05, ** = p < 0.01, *** = p < 0.001, **** = p < 0.0001. Timestamps denote mm:ss. Scale bars, 100 μm (A, B).
Figure 4.
Figure 4.. Microtubule depolymerization increases F-actin levels in a ROCK-dependent manner in the trailing halves of migrating Langerhans cells.
A-C. Stills from time-lapse confocal microscopy showing migrating Tg(mpeg1.1:Lifeact-mRuby)+ Langerhans cells treated with vehicle (A), nocodazole (B), or nocodazole+Y-27632 (Noc/Ri) (C). Magnified insets in (A’-C’) are false-colored to show Lifeact-mRuby levels. Arrowheads in (A-C) indicate migrating cell, arrows in (B’) indicate increased Lifeact-mRuby levels in the trailing half of a nocodazole-treated cell. D. Violin plot quantifying the ratio of Lifeact-mRuby at the trailing and leading halves (see Materials and Methods for analysis detail), n = 20 cells tracked from N = 3 individual experiments in vehicle conditions, n = 25 cells tracked from N = 4 individual experiments in nocodazole-treated conditions, n = 13 cells tracked from N = 6 individual experiments in nocodazole+ROCK inhibitor-treated conditions. Significance was determined using one-way ANOVA followed by Bonferroni post-test. * = p < 0.05, ** = p <0.01. Timestamps denote mm:ss. Scale bars, 10 μm (A-C).
Figure 5.
Figure 5.. MTOC motility correlates with navigational pathfinding towards large epidermal wounds.
A. Maximum intensity projection from time-lapse confocal microscopy of Tg(mpeg1:mCherry);Gt(ctnna1-Citrine) skin explant. White dotted outline indicates epidermal scratch. Yellow box in (A) is magnified in (A’,A”) insets as single z-slices. Yellow asterisk indicates obstacle keratinocyte. B. Representative still images from time-lapse confocal microscopy of Tg(actb2:H2B-2x-mScarlet;mpeg1.1:EMTB-3xGFP) skin explants. White dotted outline indicates epidermal scratch. Yellow box in (B) is magnified in (B’) insets. Yellow asterisk indicates obstacle nucleus, cyan arrowhead indicates MTOC, magenta arrowhead indicates Langerhans cell nucleus. 21 out of 25 (84%) of cells exhibit MTOC-first phenotype from N = 3 individual experiments. C. Representative still images from time-lapse confocal microscopy of vehicle-treated Tg(actb2:H2B-2x-mScarlet;mpeg1.1:EMTB-3xGFP)+ Langerhans cells navigating around obstacle keratinocytes towards a wound. D, E. Representative still images from time-lapse confocal microscopy of paclitaxel-treated Tg(actb2:H2B-2x-mScarlet;mpeg1.1:EMTB-3xGFP)+ Langerhans cells attempting to navigate around obstacle keratinocytes towards a wound. Yellow asterisks denote obstacle keratinocyte, cyan arrowhead denote MTOC. F. Quantification of navigation attempts in vehicle-treated and taxol-treated conditions, n = 38 attempts tracked from N = 3 individual experiments in vehicle conditions, n = 31 attempts tracked from N = 3 individual experiments in taxol conditions. G. Violin plots showing the length of time required to navigate around keratinocyte, n = 26 cells tracked from N = 3 individual experiments in vehicle conditions, n = 6 cells tracked from N = 3 individual experiments in taxol conditions. H, I. Representative still images from time-lapse confocal microscopy of Tg(actb2:H2B-2x-mScarlet;mpeg1.1:YFP) skin explants treated with vehicle (H) or paclitaxel (I). Yellow dotted line indicates wound, asterisks indicate phagocytic cells in wound margin, arrowheads indicate cells with stretched dendrites. J. Violin plots showing the percentage of cells exhibiting phagocytosis or stretching after 2 hours, n = 299 cells counted from N = 10 scales in vehicle conditions, n = 128 cells counted from N = 13 scales. Fisher’s exact test was used to determine significance in (F) by using the raw numbers of successful and unsuccessful navigations. Mann Whitney U test was used to determine significance in (G). One-way ANOVA followed by Bonferroni post-test was used to determine significance in (J). ** = p < 0.01, **** = p < 0.0001. Timestamps denote mm:ss. Scale bars, 10 μm (B’-E), 100 μm (B, H, I).

Similar articles

References

    1. Alraies Z., Rivera C.A., Delgado M.-G., Sanséau D., Maurin M., Amadio R., Maria Piperno G., Dunsmore G., Yatim A., Lacerda Mariano L., Kniazeva A., Calmettes V., Sáez P.J., Williart A., Popard H., Gratia M., Lamiable O., Moreau A., Fusilier Z., Crestey L., Albaud B., Legoix P., Dejean A.S., Le Dorze A.-L., Nakano H., Cook D.N., Lawrence T., Manel N., Benvenuti F., Ginhoux F., Moreau H.D., Nader G. P. F., Piel M., and Lennon-Duménil A.-M.. 2024. Cell shape sensing licenses dendritic cells for homeostatic migration to lymph nodes. Nat Immunol. 25:1193–1206. doi:10.1038/s41590-024-01856-3. - DOI - PMC - PubMed
    1. Aman A.J., and Parichy D.M.. 2024. Anatomy, development and regeneration of zebrafish elasmoid scales. Dev Biol. 510:1–7. doi:10.1016/j.ydbio.2024.03.001. - DOI - PMC - PubMed
    1. Ambravaneswaran V., Wong I.Y., Aranyosi A.J., Toner M., and Irimia D.. 2010. Directional decisions during neutrophil chemotaxis inside bifurcating channels. Integrative Biology. 2:639–647. doi:10.1039/c0ib00011f. - DOI - PMC - PubMed
    1. Arshadi C., Günther U., Eddison M., Harrington K.I.S., and Ferreira T.A.. 2021. SNT: a unifying toolbox for quantification of neuronal anatomy. Nat Methods. 18:374–377. doi:10.1038/s41592-021-01105-7. - DOI - PubMed
    1. Athlin L., Domellof L., and Norberg B.O.. 1986. The phagocytosis of yeast cells by monocytes: effects of colchicine, beta-lumicolchicine, and gamma-lumicolchicine. Lymphology. 19:130–135. - PubMed

Publication types

LinkOut - more resources