[Preprint]. 2025 Mar 15:2024.10.08.617237.
doi: 10.1101/2024.10.08.617237.

Nonequilibrium polysome dynamics promote chromosome segregation and its coupling to cell growth in Escherichia coli

Affiliations

Nonequilibrium polysome dynamics promote chromosome segregation and its coupling to cell growth in Escherichia coli

Alexandros Papagiannakis et al. bioRxiv. .

Update in

Abstract

Chromosome segregation is essential for cellular proliferation. Unlike eukaryotes, bacteria lack cytoskeleton-based machinery to segregate their chromosomal DNA (nucleoid). The bacterial ParABS system segregates the duplicated chromosomal regions near the origin of replication. However, this function does not explain how bacterial cells partition the rest (bulk) of the chromosomal material. Furthermore, some bacteria, including Escherichia coli, lack a ParABS system. Yet, E. coli faithfully segregates nucleoids across various growth rates. Here, we provide theoretical and experimental evidence that polysome production during chromosomal gene expression helps compact, split, segregate, and position nucleoids in E. coli through out-of-equilibrium dynamics and polysome exclusion from the DNA meshwork, inherently coupling these processes to biomass growth across nutritional conditions. Halting chromosomal gene expression and thus polysome production immediately stops sister nucleoid migration while ensuing polysome depletion gradually reverses nucleoid segregation. Redirecting gene expression away from the chromosome and toward plasmids causes ectopic polysome accumulations that are sufficient to drive aberrant nucleoid dynamics. Cell width enlargement suggest that the proximity of the DNA to the membrane along the radial axis is important to limit the exchange of polysomes across DNA-free regions, ensuring nucleoid segregation along the cell length. Our findings suggest a self-organizing mechanism for coupling nucleoid segregation to cell growth.


Conflict of interest statement

DECLARATION OF INTERESTS The authors declare no competing interests.

Figures

Figure 1:
Figure 1:. Correlations between polysome and nucleoid dynamics at the single-cell level.
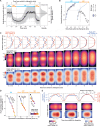
CJW7323 cells were grown in M9gluCAAT in a microfluidic device. A. Schematic illustrating observable nucleoid segregation events. B. Fluorescence images of RplA-GFP and HupA-mCherry for a representative cell (CJW7323) from birth to division. C. Ensemble kymographs of the average RplA-GFP and HupA-mCherry fluorescence during the cell division cycle (>300,000 segmented cell instances from 4122 complete cell division cycles). The average relative timing of cell constriction initiation was estimated as shown in Figure 1 – figure supplement 2. D. Two-dimensional projections of the average RplA-GFP and HupA-mCherry fluorescence signals in predivisional cells (4564 cells with two nucleoid objects, from 1907 cell division cycles, 95–100% into the cell division cycle) and their intensity profiles. White arrows indicate RplA-GFP enrichments at the quarter cell positions, while the black arrow indicates the site of cell constriction. E. Plot showing the dynamics of RplA-GFP accumulation and HupA-mCherry depletion at mid-nucleoid (median ± IQR) during the nucleoid cycle (see Figure 1 – Figure supplement 2D). Data from 3240 nucleoid segregation cycles are shown (40 nucleoid cycle bins, 2512–4823 segmented nucleoids per bin). F. Correlation (Spearman ρ=0.52, p-value < 10−10) between the rate of RplA-GFP accumulation in the middle of the nucleoid (ΔRplAmid-nucconc.ΔT) and the rate of HupA-mCherry depletion in the same region (ΔHupAmidnucconc.ΔT) between the initiation of nucleoid splitting and just before the end of nucleoid splitting (3214 complete nucleoid cycles). The colormap indicates the Gaussian kernel density estimation (KDE). Solid black line indicates the linear-regression fit to the data. G. Percentage of cells that continue to accumulate polysomes in the middle of the cell (ΔRplAmidcellconc.ΔT) during four relative time bins (1335 to 1957 cell division cycles per bin) covering the period from the end of nucleoid splitting until cell division. H. Correlation (Spearman ρ=0.47, p-value < 10−10) between the rate of RplA-GFP accumulation at mid-cell (ΔRplAmid-cellconc.ΔT) and the rate of distance increase between the sister nucleoids (ΔDistancenucΔT) during the first quartile (0–25%) of the period between the end of nucleoid splitting and cell division (1376 cell division cycles). The black markers correspond to nine bins (mean ± SEM, 75 to 177 cell division cycles per bin) within the 5th-95th percentiles of x-axis range. Also shown is the distribution of the cell elongation rates (ΔLengthcellΔT) during the same time 5: interval, with the mean and SD shown by the solid and dashed lines, respectively. I. Plot showing the coefficients of a linear mixed-effects model (see eq. 3 in Methods and Figure 1 – figure supplement 3B) for four interval bins between the completion of nucleoid splitting and cell division. The coefficients quantify the relative contribution of polysome accumulation at mid-cell (ΔRplAmid-cellconc.ΔT) and cell elongation (ΔLengthcellΔT) to the rate of sister nucleoid migration (ΔDistancenucΔT). All coefficients are significant (Prob(<|Z|) < 10−9), except for the one marked with an asterisk that is marginally significant (Prob(<|Z|) = 0.02).
Figure 2:
Figure 2:. Correlation of the extent and relative timing of polysome accumulation with nucleoid segregation at the population level.
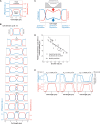
A. RplA-mEos2 and DAPI (scaled by the whole cell average) demographs constructed from snapshots of DAPI-stained CJW6768 cells (815 to 2771 cells per demograph) expressing RplA-mEos2 and growing in different nutrient conditions (see Table S1 for abbreviations). The demographs were arranged from smallest (M9mann, top) to biggest average cell area (M9malaCAAT, bottom). Additional demographs for different ribosomal reporters and nutrient conditions are shown in Figure 2 – figure supplement 1. B. Correlation between average polysome accumulation and average nucleoid depletion at mid-cell for all tested strains (Spearman ρall=0.85, p-value < 10−10) with different ribosomal and nucleoid reporters, and within each strain (−0.75 < Spearman ρstrain<0.95, p-values < 10−3) across nutrient conditions. A linear regression was fitted to all the data.
Figure 3:
Figure 3:. Correlations between polysome and nucleoid asymmetries.
A. Distributions of RplA-GFP concentration in the new (grey) and the old (black) pole regions of newborn cells (0–2.5% of the cell division cycle, n = 912 cell division cycles). The histograms were smoothed using Gaussian kernel density estimations. B. Correlation (Spearman ρ=0.41, p-value < 10−10) between the polar polysome asymmetry and the position of the nucleoid centroid around the cell center of cells at the beginning of the division cycle (0–10%, n = 1179 cell division cycles). The contour plot consists of 9 levels with a lower data density threshold of 25%. The polar polysome profile for cells with correlations indicated by the numbers 1 and 2 are schematically illustrated in the next panel. A linear regression (solid grey line) was fitted to the data. C. Schematic illustrating the effects of the relative polysome abundance between the poles on the position of the nucleoid. D. Average 2D projections of the RplA-GFP and HupA-mCherry concentration (conc.) at different cell division cycle intervals (~9440 to 47240 cell images per cell division cycle interval from 4122 cell division cycles). The dotted line indicates the boundary between two cell division cycles. E. Density plot comparing the distribution of the HupA-mCherry maximum concentration toward the new pole (gray) to that toward the old pole (black) in newborn cells (0–2.5% of the division cycle, n = 912 cell division cycles). The histograms were smoothed using Gaussian kernel density estimations. F. Correlation (Spearman ρ=0.52, p-value<10−10) between the nucleoid density asymmetry and the relative availability of polysome-free space between the two cell halves early in the cell division cycle (0–10% of the division cycle, n = 2150 cell division cycles). The contour plot consists of 9 levels with a lower data density threshold of 25%. Values above 1 on the x-axis indicate more polysome-free space toward the new pole, and values below 1 correspond to cells with more polysome-free space toward the old pole. On the y-axis, values above 1 indicate higher DNA density toward the new pole and values below 1 indicate higher DNA density toward the old pole. G. Average 2D projections of newborn cells (0–10% into the cell division cycle) from the lower-left quartile in panel C (region 2, n = 223 cell division cycles) and the upper right quartile in panel C (region 1, n = 557 cell division cycles) and their 1D intensity profiles.
Figure 4:
Figure 4:. Simulation results of the reaction-diffusion model for different growth rates or nucleoid diffusion rates.
A. Simulation of a non-growing virtual cell, initialized with homogeneous polysome concentration and a nucleoid spread between the two poles (t = 0 s). It reaches steady state with the nucleoid compacted at mid-cell at t = 998 s. B. 1D simulation of polysome (blue) and nucleoid (red) dynamics during slow growth (growth rate = 0.25 h−1, Dn = 0.001 μm2/s, cell length at birth = 2.2 μm) at different relative cell division cycle timepoints. The simulation was initialized from the equilibrium polysome and nucleoid distribution (at 0%). C. Schematic summarizing how polysomes accumulate in the middle of the elongating nucleoid, causing nucleoid splitting. D. Correlation between the relative timing of nucleoid splitting and the growth rate as captured by our reaction-diffusion model (Dn = 0.001 μm2/sec) across six growth rate bins. The cell and nucleoid lengths for each growth rate bin matched previously published data (Govers et al., 2024). E. Deviation between the steady state after infinite relaxation time (dashed curves) and the polysome or nucleoid profiles in newborn cells after one simulation round (solid curves) for increasing nucleoid diffusion constants. The simulations were performed for a growth rate of 0.57 h−1, which is comparable to the average growth rate in our microfluidic experiments (Figure 2 – figure supplement 2A).
Figure 5:
Figure 5:. Comparison of the nonequilibrium polysome accumulation with freely diffusing particles.
A. Phase contrast and fluorescence (fluor.) images of two representative single cells (CJW7651). The red circles indicate the position of the mCherry-μNS particle in each cell. B. Two-dimensional average cell projections of the DAPI concentration (conc.) and the RplA-msfGFP concentration, and 2D histogram of the mCherry-μNS particle density for four cell length bins of CJW7651 cells (~2580 cells per bin) grown in M9gluCAAT and spotted on an agarose pad containing the same medium. Since the cell pole identity cannot be inferred from snapshot images, pole assignment was random. C. Average 1D profiles of the scaled DAPI and RplA-msfGFP concentrations and the mCherry-μNS probability density.
Figure 6:
Figure 6:. Effects of rifampicin treatment and polysome depletion on nucleoid segregation and compaction.
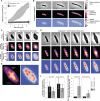
A. Plot showing the average instantaneous growth rate (mean ± SD shown by the solid black curve and grey shaded region, respectively) of a cell population (n = 2629 cell division cycles) undergoing two rounds of rifampicin treatment in a microfluidic device supplemented with M9gluCAAT. The distribution of the average cell cycle growth rate of unperturbed populations is also shown on the right (n = 4122 cell division cycles from a different microfluidics experiment). The solid horizontal line indicates the average growth rate. B. Plot showing the average distance between nucleoid peaks for a population of cells (squares, 114 cell division cycles) that were born (−112 to −102 min) and divided before the addition of rifampicin, and for a population of cells (circles, 112 cell division cycles) that were born just before (−22 to 12 min) and divided after the addition of rifampicin. A third-degree polynomial was fitted to the data from the unperturbed population (solid blue curve) and juxtaposed (dashed blue curve) with the data from the interrupted population. C. Average 1D profile and 2D projections of the scaled (divided by the whole cell average concentration) RplA-GFP and HupA-mCherry signals for cells before and after rifampicin addition (n = 112 cell division cycles). The red dashed horizontal lines in the 1D intensity profiles and the white crosses in the 2D profiles mark the nucleoid peaks. D. Plot showing the RplA-GFP accumulation relative to the HupA-mCherry depletion at mid-cell from 0 to 24 min after birth (colormap) for cells that completed their division cycle before the addition of rifampicin (n = 114 cell division cycles) and for cells that were subjected to rifampicin 12 min (n = 112 cell division cycles) or 3 min (n = 99 cell division cycles) after birth. E. Average 1D and 2D scaled RplA-GFP and HupA-mCherry intensity profiles for newborn cells (0 to 10 min after birth) before (left, n = 726 cell division cycles), just after (middle, n = 367 cell division cycles), and much after (right, n = 235 cell division cycles) rifampicin addition.
Figure 7:
Figure 7:. Effects of ectopic polysome accumulation on nucleoid dynamics.
A. Schematic summarizing the experiment. B. Representative phase contrast and mTagBFP2 fluorescence images at different times after induction with IPTG (100 μM) are shown, next to a plot showing the mTagBFP2 fluorescence of the entire population (mean ± SD, n = 3624 cell trajectories) over time. C. Plot showing how instantaneous growth rate (mean ±SD, n = 3624 mTagBFP2 induction trajectories) decreases following induction of mTagBFP2 synthesis. D-F. Representative kymographs and images of the normalized (divided by the whole cell average) RplA-msfGFP and HupA-mCherry fluorescence signals in cells (CJW7798) born during mTagBFP2 over-expression. F. Phase contrast images are shown to illustrate the formation of inclusion bodies (see also Figure 6 – figure supplement 1). Additional cell examples are shown in Movie S5.
Figure 8:
Figure 8:. Effects of cell width increase on polysome and nucleoid dynamics.
A. Comparison of the cell width increase during cell growth between CJW7323 cells treated with cephalexin (mean ± SD, 360 cell growth trajectories, 418 to 1511 segmented cells per bin) and cells treated with both cephalexin (50 μg/mL) and A22 (4 μg/mL) (grey, mean ± SD, 309 cell growth trajectories, 51 to 1684 segmented cells per bin). The same cell area bins are compared between the two populations. B. Phase contrast and fluorescence images of a representative cephalexin-treated cell expressing RplA-GFP and HupA-mCherry. C. Same as B but for a short cell growing in the presence of A22 and cephalexin. D. Same as C but for a longer cell. The white arrowheads indicate the polysome bridges that connect polysome accumulations between two DNA-free regions. Additional examples are shown in Movie S6 E. Representative fluorescence images of RplA-GFP and HupA-mCherry in a cell treated with A22 and cephalexin. The dotted lines indicate the representative cross-like polysome accumulation, which forms during the fusion of the polysome accumulation towards the center (see also Movie S6). F. Comparison of the segmented polysome accumulations and nucleoid objects between A22+cephalexin (150 sampled segmented cells from 47 growth trajectories) and cephalexin-treated (150 sampled segmented cells from 100 growth trajectories) cells. The polysome and nucleoid areas per cell were normalized by the population-average statistic from cephalexin-treated cells. All differences between the two populations are statistically significant (Mann-Whitney p-value < 10−10).

References

    1. Bakshi S., Choi H., Mondal J., Weisshaar J.C., 2014. Time-dependent effects of transcription-and translation-halting drugs on the spatial distributions of the E scherichia coli chromosome and ribosomes: Time-dependent drug effects on E. coli chromosome spatial distribution. Mol. Microbiol. 94, 871–887. 10.1111/mmi.12805 - DOI - PMC - PubMed
    1. Bakshi S., Choi H., Weisshaar J.C., 2015. The spatial biology of transcription and translation in rapidly growing Escherichia coli. Front. Microbiol. 6. 10.3389/fmicb.2015.00636 - DOI - PMC - PubMed
    1. Bakshi S., Siryaporn A., Goulian M., Weisshaar J.C., 2012a. Superresolution imaging of ribosomes and RNA polymerase in live Escherichia coli cells. Mol. Microbiol. 85, 21–38. 10.1111/j.1365-2958.2012.08081.x - DOI - PMC - PubMed
    1. Bakshi S., Siryaporn A., Goulian M., Weisshaar J.C., 2012b. Superresolution imaging of ribosomes and RNA polymerase in live Escherichia coli cells: Superresolution imaging of ribosome and RNAP. Mol. Microbiol. 85, 21–38. 10.1111/j.1365-2958.2012.08081.x - DOI - PMC - PubMed
    1. Balakrishnan R., Mori M., Segota I., Zhang Z., Aebersold R., Ludwig C., Hwa T., 2022. Principles of gene regulation quantitatively connect DNA to RNA and proteins in bacteria. Science 378, eabk2066. 10.1126/science.abk2066 - DOI - PMC - PubMed

Publication types

LinkOut - more resources