

Development and Validation of a Nomogram Prediction Model for Key Symptoms of Post-Intensive Care Syndrome-Family in Family Members of Critically-Ill Patients: Focusing on Sleep Disturbance, Fatigue, Anxiety, and Depression
- PMID: 40161896
- PMCID: PMC11955170
- DOI: 10.2147/RMHP.S490487
Development and Validation of a Nomogram Prediction Model for Key Symptoms of Post-Intensive Care Syndrome-Family in Family Members of Critically-Ill Patients: Focusing on Sleep Disturbance, Fatigue, Anxiety, and Depression
Abstract
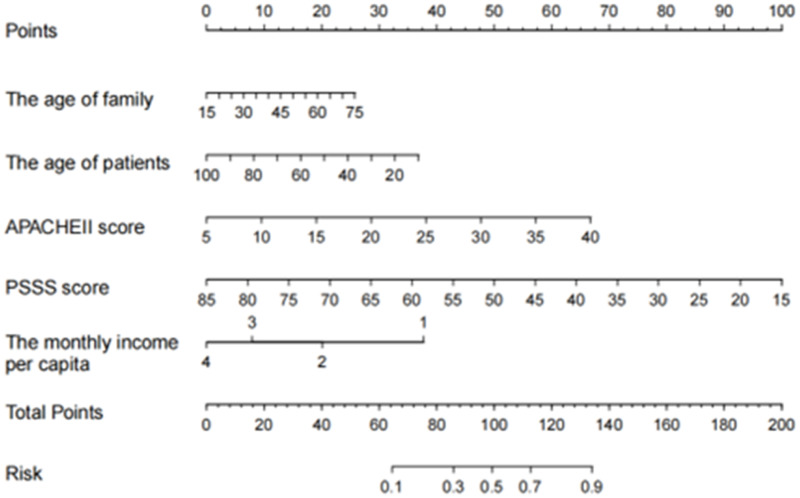
Purpose: To construct and validate a nomogram model predicting the risk of post-intensive care syndrome-family (PICS-F) in family members of critically ill patients.
Methods: This study was conducted on family members (parents, spouses, or children) of critically ill patients in the three intensive care units of Binzhou Medical University Hospital from December 2023 to June 2024, responsible for medical decisions and primary care. The sleep disturbances, fatigue, anxiety, and depression were assessed using the Pittsburgh Sleep Quality Index, the Subscale of Fatigue Assessment Instrument, and the Hospital Anxiety and Depression Scale, respectively. Predictive factors were identified through univariate and multivariate logistic regression, and a nomogram was constructed using R4.2.3. Internal validation used the Bootstrap sampling method, and external validation employed the time-period method.
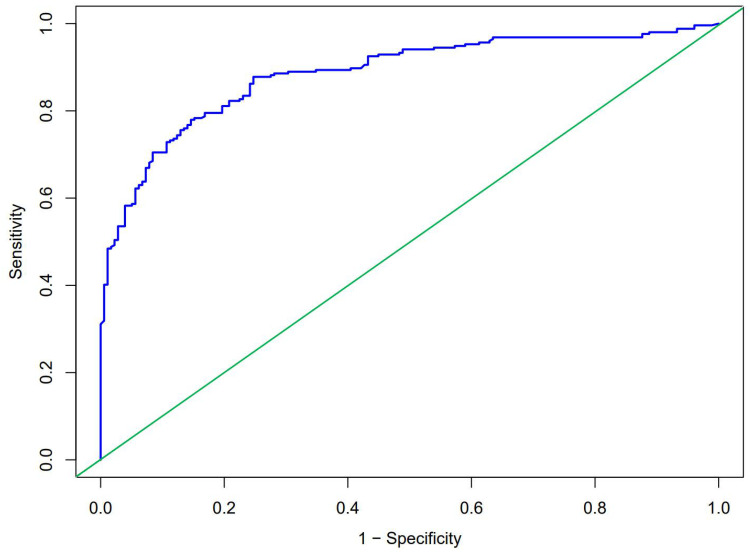
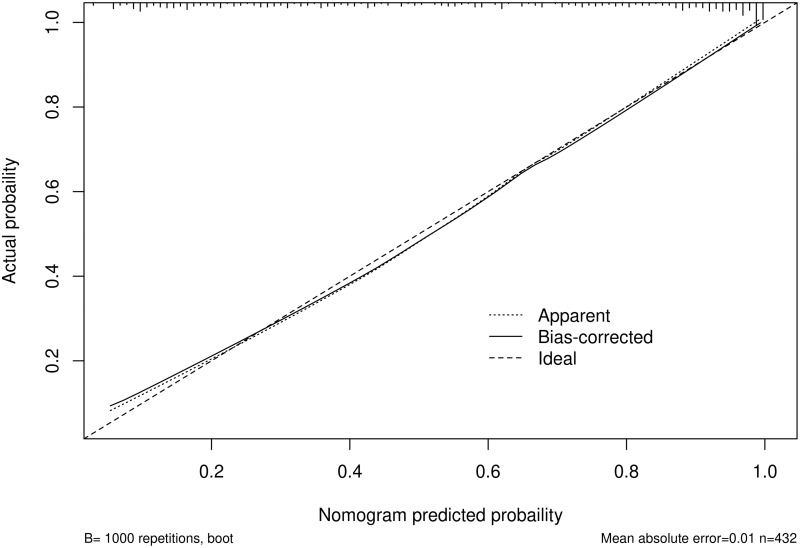
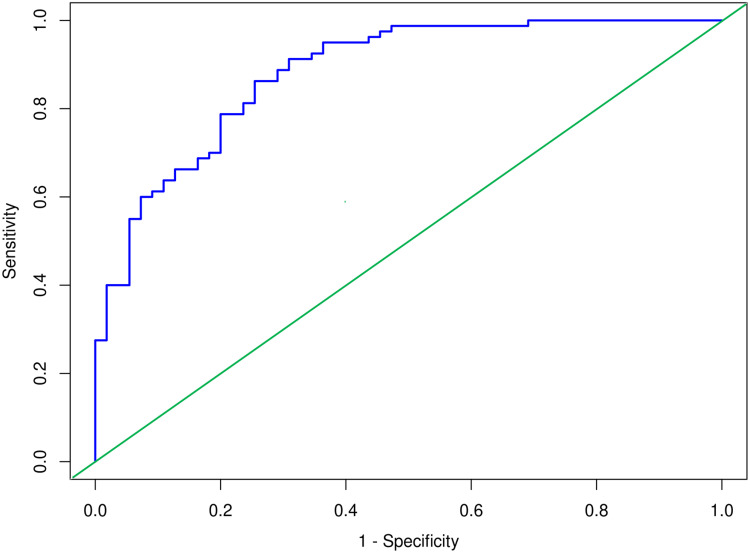
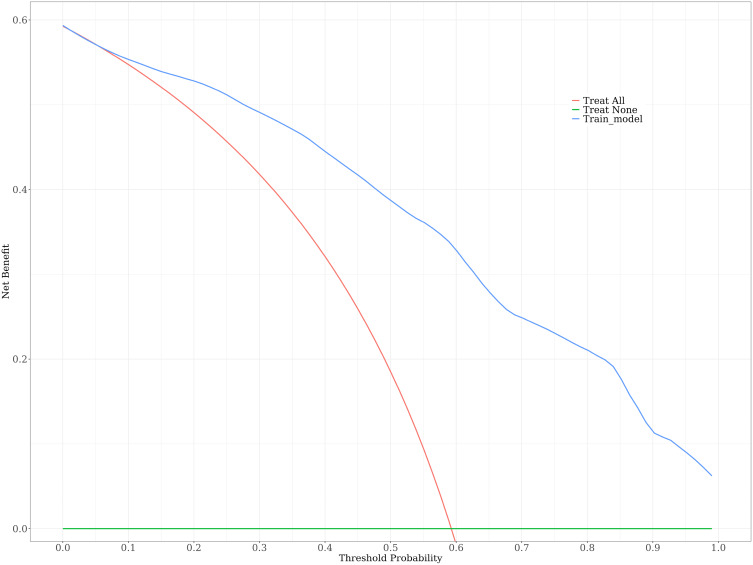
Results: The study involved 567 participants divided into a modeling group (n = 432; median age = 46 years; 209 males, 223 females) and an external validation group (n = 135; median age = 45 years; 70 males, 65 females). The model included five predictive factors: family age, patient age, APACHE II score, average monthly income per family member, and PSSS score. The AUC of the modeling group was 0.894 (0.864 ~ 0.924), with a specificity of 85.4%, a sensitivity of 78.0%, and a maximum Youden index of 0.634. The H-L test revealed a good fit (X 2 value = 9.528, P = 0.300). The internal validation results of the Bootstrap sampling method showed that the calibration curve of the model was close to the ideal curve, and the DCA curve results indicated high clinical practicality. Moreover, the external validation results showed that AUC was 0.847 (0.782 ~ 0.912), with sensitivity and specificity of 74.5% and 86.3%, respectively. The H-L test results indicated a good fit (X 2 value = 9.625, P = 0.292).
Conclusion: The nomogram demonstrated strong predictive performance for PICS-F risk in ICU patients' families, offering a valuable tool for clinical assessment.
Keywords: nomogram model; nursing; post-intensive care syndrome-family; prediction model.
© 2025 Dong et al.
Conflict of interest statement
The authors declare that they have no conflicts of interest in this work.
Figures
Similar articles
-
Prediction model for sleep disorders in patients transferred out of ICU: Development and validation.Nurs Crit Care. 2025 Mar;30(2):e13292. doi: 10.1111/nicc.13292. Nurs Crit Care. 2025. PMID: 39972957
-
Development and validation of a dynamic nomogram for high care dependency during the hospital-family transition periods in older stroke patients.BMC Geriatr. 2024 Oct 12;24(1):827. doi: 10.1186/s12877-024-05426-y. BMC Geriatr. 2024. PMID: 39395968 Free PMC article.
-
Construction and evaluation of a mortality prediction model for patients with acute kidney injury undergoing continuous renal replacement therapy based on machine learning algorithms.Ann Med. 2024 Dec;56(1):2388709. doi: 10.1080/07853890.2024.2388709. Epub 2024 Aug 19. Ann Med. 2024. PMID: 39155811 Free PMC article.
-
In-Hospital Mortality Prediction Model for Critically Ill Older Adult Patients Transferred from the Emergency Department to the Intensive Care Unit.Risk Manag Healthc Policy. 2023 Nov 22;16:2555-2563. doi: 10.2147/RMHP.S442138. eCollection 2023. Risk Manag Healthc Policy. 2023. PMID: 38024492 Free PMC article.
-
[Establishment of a nomogram prediction model for 28-day mortality of septic shock patients based on routine laboratory data mining].Zhonghua Wei Zhong Bing Ji Jiu Yi Xue. 2024 Nov;36(11):1127-1132. doi: 10.3760/cma.j.cn121430-20240202-00108. Zhonghua Wei Zhong Bing Ji Jiu Yi Xue. 2024. PMID: 39697015 Chinese.
References
LinkOut - more resources
Full Text Sources
