. 2025 Jun;12(22):e2416559.
doi: 10.1002/advs.202416559. Epub 2025 Mar 31.

Inhibition of Ferroptosis Delays Aging and Extends Healthspan Across Multiple Species

Affiliations

Inhibition of Ferroptosis Delays Aging and Extends Healthspan Across Multiple Species

Hai-Jun Fu et al. Adv Sci (Weinh). 2025 Jun.

Abstract

Ferroptosis, a form of iron-dependent cell death, plays a pivotal role in age-related diseases; yet, its impact on cellular senescence and healthspan in mammals remains largely unexplored. This study identifies ferroptosis as a key regulator of cellular senescence, showing that its inhibition can significantly delay aging and extend healthspan across multiple species. During cellular senescence, ferroptosis is progressively exacerbated, marked by increased lipid peroxidation, oxidative stress, and diminished glutathione peroxidase 4 (GPX4) levels. Ferroptosis inducers such as Erastin and RSL3 accelerate senescence; while, inhibitors such as liproxstatin-1 (Lip-1) and ferrostatin-1 (Fer-1) effectively mitigate both chemically and replicatively induced senescence. In vivo, Fer-1 extends lifespan and healthspan in Caenorhabditis elegans, enhances motor function, preserves tissue integrity, and mitigates cognitive decline in both prematurely and naturally aged mice. These effects are attributed to Fer-1's upregulation of GPX4 and inhibition of ferroptosis. Notably, long-term Fer-1 treatment (over 6 months) does not adversely affect body weight or induce aging-related tissue damage but rejuvenates hematological parameters. These findings establish ferroptosis as a critical player in aging dynamics and highlight its inhibition as a promising strategy to extend healthspan and lifespan, providing valuable insights for translational approaches to combat aging and age-related decline.

Keywords: cellular senescence; ferroptosis; ferrostatin‐1; glutathione peroxidase 4; healthspan.


Conflict of interest statement

The authors declare no conflict of interest.

Figures
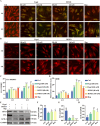
Figure 1
Figure 1
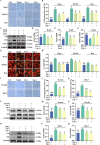
Cellular senescence is associated with ferroptosis. A,B) BODIPY 581/591 C11 and DHE staining of HFF cells treated with D‐gal (80 and 160 mm) and DOXO (80 and 160 nm), along with replicative senescent HFF cells (30 passages). Scale bar: 50 µm. C,D) Quantification of fluorescence intensity in (A,B), presented as mean ± SD from three independent experiments. Statistical significance: *p < 0.05, **p < 0.01, and ***p < 0.001. E,F) Western blot analysis of GPX4, FTL, and ACSL4 protein expression in HFF cells under different aging conditions. Bar graphs represent quantified protein levels, shown as mean ± SD from three independent experiments. Statistical significance: *p < 0.05, **p < 0.01, and **p < 0.001.
Figure 2
Figure 2
Ferroptosis inducers Erastin and RSL3 accelerate cellular senescence. A,B) SA‐β‐gal staining in HFF cells treated with Erastin (5 and10 µm) and RSL3 (0.625 and 1.25 µm) to induce senescence. Representative images show control and senescent HFF cells. Scale bar: 100 µm. C,D) Quantification of SA‐β‐gal‐positive cells in (A,B). Data are presented as mean ± SD from three independent experiments. Statistical significance: **p < 0.01 and ***p < 0.001. E–H) Western blot analysis of GPX4, P16, and P21 protein levels in HFF cells treated with Erastin and RSL3. Bar graphs show quantification of GPX4, P16, and P21 protein expression. Data are expressed as mean ± SD from three independent experiments. Statistical significance: *p < 0.05, **p < 0.01, and ***p < 0.001. I) Quantification of p16, p21, and SASP gene mRNA levels in HFF cells treated with Erastin and RSL3 compared to controls. Data are shown as mean ± SD from three independent experiments. Statistical significance: *p < 0.05, **p < 0.01, and ***p < 0.001.
Figure 3
Figure 3
Ferroptosis inhibitors Fer‐1 and Lip‐1 mitigate senescence induced by various triggers. A,B) SA‐β‐gal staining in HFF cells under three aging conditions, with or without Fer‐1 (1 µm) and Lip‐1 (1 µm) treatment. The bar graph shows the percentage of SA‐β‐gal‐positive cells. Data are expressed as mean ± SD from three independent experiments. Statistical significance: *p < 0.05, **p < 0.01, and ***p < 0.001. # indicates a significant difference between the control and model groups. Scale bar: 25 µm. C) Western blot analysis of GPX4, P16, and P21 protein levels in D‐gal‐induced senescent HFF cells treated with Fer‐1 and Lip‐1. D–F) Bar graphs quantify GPX4, P16, and P21 expression. Data are presented as mean ± SD from three independent experiments. Statistical significance: *p < 0.05, **p < 0.01, and ***p < 0.001. # indicates a significant difference between the control and model groups. G,H) Representative images of BODIPY 581/591 C11 staining in HFF cells under D‐gal‐ and DOXO‐induced senescence or replicative senescence, with or without Fer‐1 and Lip‐1. The bar graph quantifies the C11 GFP/RFP ratio. Data are expressed as mean ± SD from three independent experiments. Statistical significance: *p < 0.05, **p < 0.01, and ***p < 0.001. # indicates a significant difference between the control and model groups. Scale bar: 25 µm. I–K) SA‐β‐gal staining in HFF cells treated with Erastin and RSL3, with or without Fer‐1 and Lip‐1. The bar graph quantifies the percentage of SA‐β‐gal‐positive cells. Data are presented as mean ± SD from three independent experiments. Statistical significance: **p < 0.01 and ***p < 0.001. # indicates a significant difference between the control and model groups. Scale bar: 25 µm. L–N) Western blot analysis of P16 and P21 protein levels in Erastin‐induced senescent HFF cells treated with Fer‐1 and Lip‐1. Data are shown as mean ± SD from three independent experiments, with *p < 0.05, **p < 0.01, and ***p < 0.001. # indicates a significant difference between the control and model groups. O–Q) Western blot analysis of P16 and P21 protein levels in RSL3‐induced senescent HFF cells treated with Fer‐1 and Lip‐1. Data are presented as mean ± SD from three independent experiments, with *p < 0.05, **p < 0.01, and ***p < 0.001. # indicates a significant difference between the control and model groups.
Figure 4
Figure 4
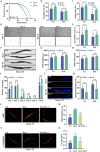
Fer‐1 extends lifespan and promotes healthspan in wild‐type N2 C. elegans. A) Survival curves of wild‐type N2 worms treated with Fer‐1. B) Bar graph showing the pharyngeal pumping rate of wild‐type N2 worms over 20 s following Fer‐1 (100 µm) treatment. Data are presented as mean ± SD (n = 30 worms); *p < 0.05 and ***p < 0.001. C) Bar graph depicting body bending frequency of N2 worms over 20 s following Fer‐1 treatment. Data are presented as mean ± SD (n = 30 worms); **p < 0.01 and ***p < 0.001. D) Representative images of movement trajectories of N2 worms treated with Fer‐1, recorded over 20 s, with “s” marking the start and “t” the end. E) Bar graph illustrating average speed of N2 worms following Fer‐1 treatment. Data are presented as mean ± SD (n = 30 worms); *p < 0.05 and ***p < 0.001. F) Representative images showing body length and width of N2 worms treated with Fer‐1. Scale bar: 200 µm. G,H) Bar graphs showing body length and width of N2 worms treated with Fer‐1. Data are presented as mean ± SD (n = 30 worms); **p < 0.01 and ***p < 0.001. I) Bar chart showing daily and total progeny of N2 worms treated with Fer‐1. Data are presented as mean ± SD (n = 30 worms); ***p < 0.001. J) Representative images showing lipofuscin accumulation in N2 worms treated with Fer‐1. Scale bar: 200 µm. K) Bar graph displaying relative lipofuscin intensity in N2 worms treated with Fer‐1. Data are presented as mean ± SD (n = 20 worms); ***p < 0.001. L) Representative images showing intracellular ROS accumulation, labeled with the DHE fluorescent dye in N2 worms treated with Fer‐1. Scale bar: 200 µm. M) Bar graph quantifying the DHE intensity of N2 worms treated with Fer‐1. Data are presented as mean ± SD (n = 20 worms); ***p < 0.001. # indicates a significant difference between 1 d and 10 d groups. N) Representative images showing lipid peroxide accumulation labeled with the C11‐BODIPY581/591 fluorescent dye in N2 worms treated with Fer‐1. Scale bar: 200 µm. O) Bar graph quantifying the C11 GFP/RFP ratio in N2 worms treated with Fer‐1. Data are presented as mean ± SD (n = 20 worms); **p < 0.01 and ***p < 0.001. # indicates a significant difference between 1 d and 10 d groups.
Figure 5
Figure 5
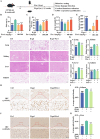
Fer‐1 alleviates behavioral deficits and tissue injury in D‐gal‐induced premature aging mice. A) Schematic representation of experimental design. B–E) Behavioral tests in 8‐week‐old C57BL/6J mice subjected to D‐gal‐induced premature aging and treated with vehicle or Fer‐1 (100 or 200 mg kg−1). Assessments include the pole test (B), hanging endurance (C), grip strength (D), and constant speed test (E), conducted 2 weeks post‐treatment. Data are presented as mean ± SD (n = 3 independent animals); *p < 0.05, **p < 0.01, and ***p < 0.001. # indicates a significant difference between the control and D‐gal groups. F,G) H&E staining of lungs, kidney, liver, and adipose tissues to observe pathological tissue damage. Bar graphs indicate the pathological scoring. Data are presented as mean ± SD (n = 3 independent animals); **p < 0.01 and ***p < 0.001. # indicates a significant difference between the control and D‐gal groups. Scale bar: 200 µm. H,I) Representative IHC staining images of the DNA damage marker γ‐H2AX in adipose tissue. Quantification of the average optical density was performed using ImageJ. Data are presented as mean ± SD (n = 3 independent animals); **p < 0.01 and ***p < 0.001. # indicates a significant difference between the control and D‐gal groups. Scale bar: 50 µm. J,K) Representative IHC staining images of the DNA damage marker γ‐H2AX in liver tissue. Quantification of the average optical density was performed using ImageJ. Data are presented as mean ± SD (n = 3 independent animals); ***p < 0.001. # indicates a significant difference between the control and D‐gal groups. Scale bar: 50 µm.
Figure 6
Figure 6
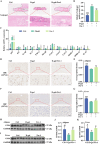
Fer‐1 mitigates tissue aging and enhances GPX4 expression in D‐gal‐induced premature aging mice. A,B) Representative images show SA‐β‐gal‐positive staining in the reproductive glands connected to the epididymal adipose tissue of D‐gal‐induced mice treated with 100 mg kg−1 Fer‐1. The dotted circle highlights the reproductive glands; while, the outer dotted circle indicates the epididymal adipose tissue. The bar graph presents the quantification of the positive staining areas. Data are presented as ± SD (n = 3 independent animals); **p < 0.01 and ***p < 0.001. # indicates a significant difference between the control and D‐gal groups. Scale bar: 50 µm. C) Bar graph quantifying mRNA levels of p16, p21, and SASP in the adipose tissue of D‐gal‐induced mice treated with 100 mg kg−1 Fer‐1. Data are presented as ± SD (n = 3 independent animals); *p < 0.05, **p < 0.01, and ***p < 0.001. # indicates a significant difference between the control and D‐gal groups. D,E) IHC staining of GPX4 in adipose tissue. Quantification of average optical density was performed using ImageJ. Data are presented as ± SD (n = 3 independent animals); **p < 0.01 and ***p < 0.001. # indicates a significant difference between the control and D‐gal groups. Scale bar: 50 µm. F,G) IHC staining of GPX4 in liver tissue. Quantification was performed using ImageJ. Data are presented as ± SD (n = 3 independent animals); **p < 0.01 and ***p < 0.001. # indicates a significant difference between the control and D‐gal groups. Scale bar: 50 µm. H–K) Western blot analysis of GPX4 protein levels in adipose and liver tissues of D‐gal‐induced premature aging mice treated with Fer‐1. Bar graphs quantify GPX4 protein expression. Data are presented as mean ± SD (n = 4 independent animals); *p < 0.05 and **p < 0.01. # indicates a significant difference between the control and D‐gal groups.
Figure 7
Figure 7
Fer‐1 alleviates brain function decline in D‐gal‐induced premature aging mice. A–D) Morris water maze test assessing spatial recognition memory: representative swim trajectories over five training sessions (A); escape latency recorded from days 1 to 5 (B); Percentage of time spent in the target quadrant during the probe trial (C); and number of platform crossings during the probe trial (D). Data are presented as mean ± SD (n = 6 independent animals); *p < 0.05, **p < 0.01, and ***p < 0.001. # indicates a significant difference between the control and D‐gal groups. E,F) H&E staining of the hippocampal region (CA1, CA3, and DG subregions). The bar graph illustrates the average number of nerve cells in these areas. Data are presented as mean ± SD (n = 3 independent animals); *p < 0.05 and **p < 0.01. # indicates a significant difference between the control and D‐gal groups. Scale bar: 50 µm. G,H) Nissl staining of the hippocampal region (CA1, CA3, and DG subregions). The bar graph shows the average number of nerve cells in these areas. Data are presented as mean ± SD (n = 3 independent animals); *p < 0.05, **p < 0.01, and ***p < 0.001. # indicates a significant difference between the control and D‐gal groups. Scale bar: 50 µm. I,J) IHC staining of GPX4 protein levels in hippocampal tissue. The bar graph quantifies GPX4 expression levels. Data are presented as mean ± SD (n = 6 independent animals); ***p < 0.001. # indicates a significant difference between the control and D‐gal groups. Scale bar: 100 µm. K,L) Western blot analysis of GPX4 protein levels in brain tissues. The bar graph quantifies GPX4 expression levels. Data are presented as mean ± SD (n = 4 independent animals); *p < 0.05 and **p < 0.01. # indicates a significant difference between the control and D‐gal groups.
Figure 8
Figure 8
Fer‐1 promotes healthspan in naturally aged mice. A) Schematic representation of experimental design. B–D) Behavioral tests in naturally aged C57BL/6J mice treated with Fer‐1 (100 µm in drinking water), including the pole test (B), hanging endurance test (C), and constant speed test (D). The young group consists of 6‐month‐old C57BL/6J mice. Tests were conducted 2 weeks after the final treatment. Data are presented as mean ± SD (n = 6 independent animals); *p < 0.05, **p < 0.01, and ***p < 0.001. # indicates a significant difference between the control and D‐gal groups. E,F) Serum levels of ALT and AST in Fer‐1‐treated naturally aged mice. Data are presented as mean ± SD (n = 3 independent animals); *p < 0.05. # indicates a significant difference between the control and D‐gal groups. G,H) Body weight changes in male and female naturally aged C57BL/6J mice treated with Fer‐1. Data are presented as mean ± SD (n = 6 mice per group). I) Heatmap of differential hematological parameters in young, old, and Fer‐1‐treated mice. Data are presented as mean ± SD (n = 3 mice per group). J,K) mRNA expression analysis of p16, p21, and SASP‐related genes in liver and adipose tissues of naturally aged mice treated with Fer‐1. Data are presented as mean ± SD (n = 3 independent animals); *p < 0.05, **p < 0.01, and ***p < 0.001. # indicates a significant difference between the control and D‐gal groups. L–O) Western blot analysis of GPX4 protein levels in adipose and liver tissues of naturally aged mice treated with Fer‐1. Bar graphs quantify GPX4 expression levels. Data are presented as mean ± SD (n = 3 independent animals); *p < 0.05 and **p < 0.01. # indicates a significant difference between the control and D‐gal groups.
Figure 9
Figure 9
Fer‐1 alleviates brain function decline in naturally aged mice. A–E) Gait analysis metrics: run speed (A), number of steps (B), swing time (C), stance time (D), and brake time (E). Data are presented as mean ± SD (n = 6 independent animals); *p < 0.05, **p < 0.01, and ***p < 0.001. # indicates a significant difference between the control and D‐gal groups. F,G) H&E staining of the hippocampal region magnifications of the CA1, CA3, and DG subregions. The bar graph illustrates the average number of nerve cells in these areas. Data are presented as mean ± SD (n = 3 independent animals); *p < 0.05, **p < 0.01, and ***p < 0.001. # indicates a significant difference between the control and D‐gal groups. Scale bar: 50 µm. H) mRNA expression analysis of p16, p21, and SASP‐related genes in the brain tissue of naturally aged mice treated with Fer‐1. Data are presented as mean ± SD (n = 3 independent animals); *p < 0.05, **p < 0.01, and ***p < 0.001. # indicates a significant difference between the control and D‐gal groups. I,J) Western blot analysis of GPX4 protein levels in brain tissues of naturally aged mice treated with Fer‐1. Bar graphs quantify GPX4 expression levels. Data are presented as mean ± SD (n = 3 independent animals); *p < 0.05 and **p < 0.01. # indicates a significant difference between the control and D‐gal groups.
Figure 10
Figure 10
Summary of the study. This study demonstrates that ferroptosis is a key driver of cellular senescence, and its inhibition delays aging and extends healthspan across species. Ferroptosis is exacerbated during D‐gal, DOXO, and replicative‐induced senescence, characterized by lipid peroxidation, oxidative stress, and reduced GPX4. Ferroptosis inducers, such as Erastin and RSL3, accelerate senescence; while, inhibitors such as Lip‐1 and Fer‐1 effectively mitigate it. In vivo, Fer‐1 extends lifespan, improves motor function, preserves tissue integrity, and reduces cognitive decline in C. elegans, D‐gal‐induced aging mice, and naturally aged mice by upregulating GPX4 and inhibiting ferroptosis.

References

    1. Guo J., Huang X., Dou L., Yan M., Shen T., Tang W., Li J., Signal Transduction Targeted Ther. 2022, 7, 391. - PMC - PubMed
    1. Zeng Q., Gong Y., Zhu N., Shi Y., Zhang C., Qin L., Ageing Res. Rev. 2024, 97, 102294. - PubMed
    1. Bolignano D., Mattace‐Raso F., Sijbrands E. J., Zoccali C., Ageing Res. Rev. 2014, 14, 65. - PubMed
    1. Liang B., Burley G., Lin S., Shi Y.‐C., Cell. Mol. Biol. Lett. 2022, 27, 72. - PMC - PubMed
    1. Liberale L., Badimon L., Montecucco F., Lüscher T. F., Libby P., Camici G. G., J. Am. Coll. Cardiol. 2022, 79, 837. - PMC - PubMed

Substances

LinkOut - more resources