. 2025 Jul;12(25):e2501553.
doi: 10.1002/advs.202501553. Epub 2025 Mar 31.

HDAC6 and USP9X Control Glutamine Metabolism by Stabilizing GS to Promote Glioblastoma Tumorigenesis

Affiliations

HDAC6 and USP9X Control Glutamine Metabolism by Stabilizing GS to Promote Glioblastoma Tumorigenesis

Go Woon Kim et al. Adv Sci (Weinh). 2025 Jul.

Abstract

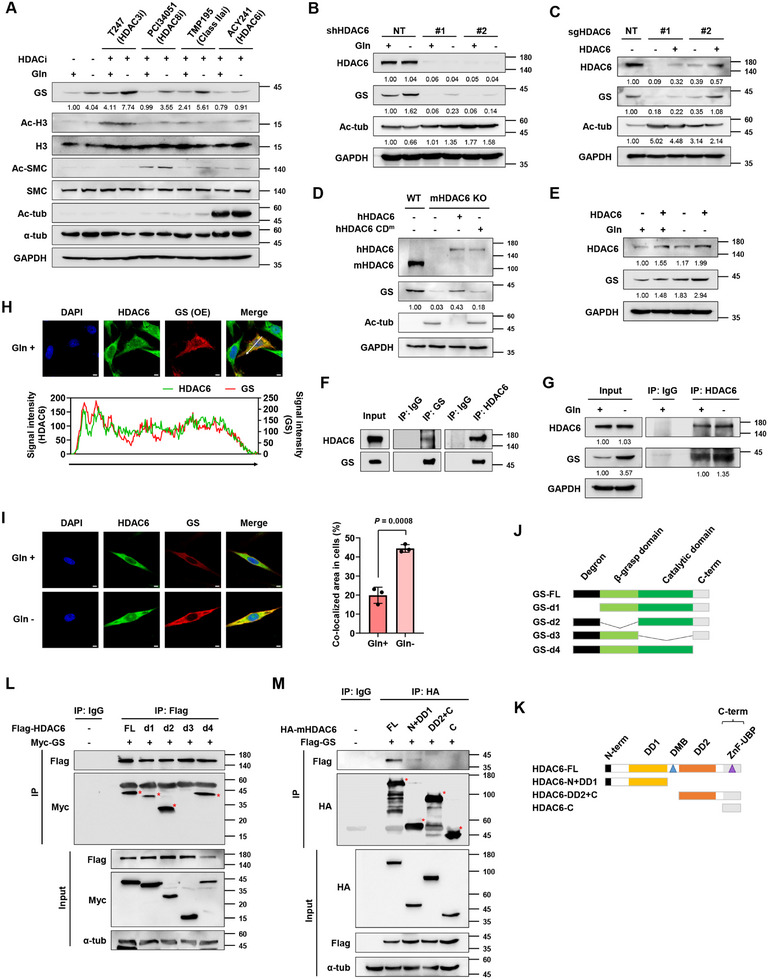
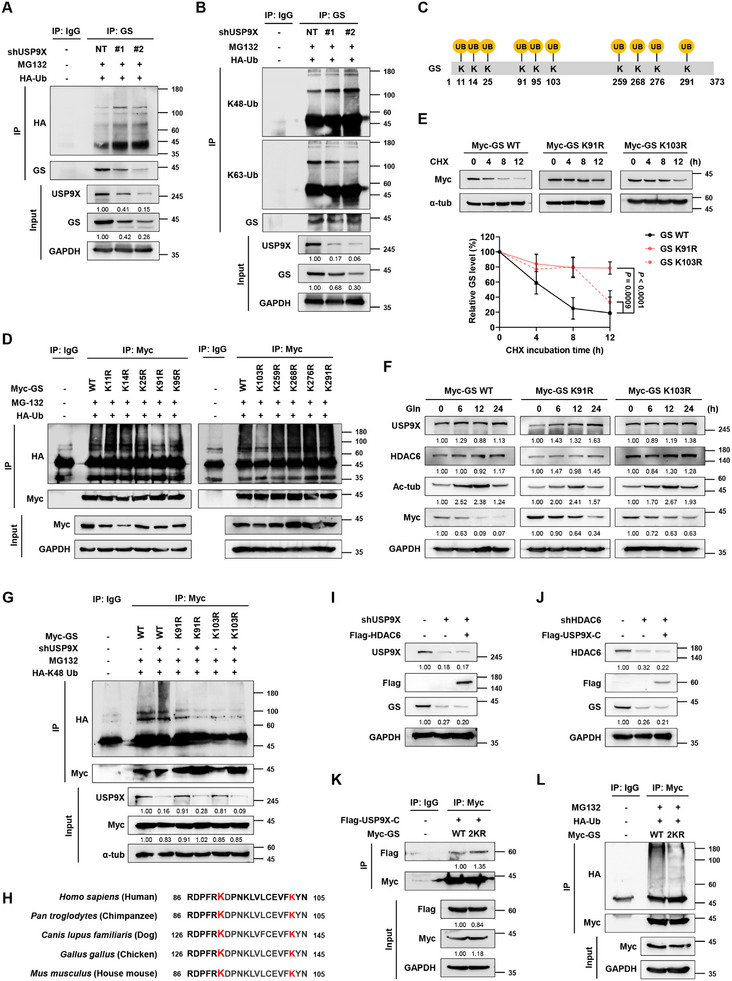
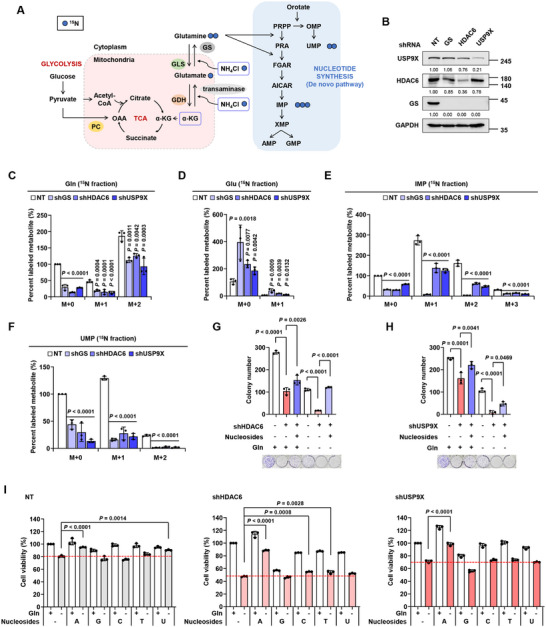
Glioblastoma (GBM) is the most common and the deadliest brain cancer. Glutamine anabolism mediated by glutamine synthetase (GS) is beneficial for GBM cell growth, especially under glutamine deprivation. However, the molecular mechanism underlying GS homeostasis in GBM remains undisclosed. Here, it is reported that histone deacetylase 6 (HDAC6) promotes GS deacetylation, stabilizing it via ubiquitin-mediated pathway. It is found that deubiquitination of GS is modulated by ubiquitin-specific peptidase 9, X-linked (USP9X). USP9X stabilizes GS by removing its K48-linked polyubiquitination on lysine 91 and 103. Accordingly, targeting HDAC6 and USP9X in vitro and in vivo represses GBM tumorigenesis by decreasing GS stability. Metabolic analysis shows that silencing HDAC6 and USP9X disrupts de novo nucleotide synthesis, thereby attenuating GBM cell growth. Furthermore, GS modulation by targeting HDAC6 and USP9X restrains the self-renewal capacity. These results suggest that HDAC6 and USP9X are crucial epigenetic enzymes that promote GBM tumorigenesis by modulating glutamine metabolism.

Keywords: GS; HDAC6; USP9X; glioblastoma; glutamine metabolism.


Conflict of interest statement

The authors declare no conflict of interest.

Figures

Figure 1
Figure 1
HDAC6 is a GS interacting partner that regulates GS protein expression. A) HDAC inhibitor screening with 10 µm PCI34051 and 2 µm T247, TMP195, and ACY241 in U251 cells. Cells were incubated with the indicated HDAC inhibitors for 24 h. B) IB analysis of GS expression in HDAC6 knockdown U251 cells incubated in Gln ± media for 24 h. C) Effects of HDAC6 reintroduction on GS expression in HDAC6 knockout U251 cells. D) IB analysis showing the GS expression in human HDAC6 WT (hHDAC6)‐ or catalytically inactive mutant (hHDAC6 CDm)‐introduced HDAC6 knockout MEF cells. E) Effects of HDAC6 overexpression in U251 cells incubated in Gln ± media for 24 h. F) IP analysis showing the interaction between HDAC6 and GS in HEK293T cells. G) IP analysis showing the interaction between HDAC6 and GS under glutamine depletion in U251 cells. Cells were incubated in Gln ± media for 24 h. H) Representative immunofluorescence images and signal intensity profiles across the line in the merged image showing co‐localization of HDAC6 and ectopically expressed GS in U251 cells. Scale bar, 5 µm. I) Representative immunofluorescence images and quantitative graph showing co‐localization of HDAC6 and GS in U251 cells incubated in Gln ± media for 48 h. Scale bar, 5 µm. Schematic diagrams of J) GS deletion constructs and K) HDAC6 domain constructs. L) IP analysis showing the GS interaction domain binding to HDAC6 in HEK293T cells. Red‐colored asterisks indicate co‐immunoprecipitated protein bands. M) IP analysis showing the HDAC6 interaction domain binding to GS in HEK293T cells. Red‐colored asterisks indicate immunoprecipitated protein bands.
Figure 2
Figure 2
Increased HDAC6 activity upon glutamine starvation supports GS stability by deacetylating GS. mRNA levels of A) HDAC6 and B) GLUL analyzed with qRT‐PCR upon knockdown of HDAC6 in U251 cells. C) IB analysis showing the effect of MG132 (20 µm, 4 h) on HDAC6 knockout U251 cells. D) IB analysis and quantification graph showing the effect of CHX (100 µm) on HDAC6 knockout U251 cells. E) IP analysis showing acetylation of GS in HDAC6 knockdown U251 cells. Cells were incubated with 20 µm MG132 for 4 h before making cell lysate. F) IP analysis showing acetylation of GS in HDAC6‐overexpressing U251 cells. G) IP analysis showing the interaction between HDAC6 and either WT or 2KR mutant of GS in U251 cells. H) IP analysis showing the ubiquitination of GS in HDAC6 knockdown U251 cells. I) IB analysis showing HDAC6, Ac‐tub, and GS under glutamine starvation in U251 and U87 cells. Cells were incubated in Gln ± media for 24 h. J) GLUL mRNA levels analyzed with qRT‐PCR under glutamine starvation in U251 and U87 cells. Cells were incubated in Gln ± media for 24 h. IB analysis showing HDAC6, Ac‐tub, and GS levels under glutamine starvation for various time points in K) U251 and L) U87 cells. Relative HDAC6 activity in glutamine‐depleted condition relative to that in glutamine‐replete condition in M) U251 and N) U87 cells. Cells were incubated in Gln ± media for 24 h. O) HDAC6 activity of U251 and U87 cells. Data are shown as mean ± SD. ns, not significant; n = 3.
Figure 3
Figure 3
USP9X maintains GS protein stability by binding to GS. A) IP analysis showing the interaction between USP9X, HDAC6, and GS in HEK293T cells. B) IP analysis showing the interaction between USP9X and GS under glutamine depletion in U251 cells. Cells were incubated in Gln ± media for 24 h. Representative immunofluorescence images and signal intensity profiles across the line in the merged image showing C) co‐localization of USP9X and HDAC6 in HDAC6‐overexpressing U251 cells and D) co‐localization of USP9X and GS in GS‐overexpressing U251 cells. Scale bar, 5 µm. E) Schematic diagram of USP9X mutant constructs. F) IP analysis showing the USP9X interaction domain binding to GS in HEK293T cells. Red‐colored asterisks indicate co‐immunoprecipitated protein bands. G) IP analysis showing the interaction between GS domain binding to USP9X in HEK293T cells. Red‐colored asterisks indicate immunoprecipitated protein bands. H) IB analysis showing the effect of WP1130 on GS expression in U251 cells. Cells were incubated with WP1130 for 24 h. I) IB analysis of GS expression in USP9X knockdown U251 cells. Cells were incubated in Gln ± media for 24 h. J) Effect of USP9X overexpression on GS expression in U251 cells. K) IB analysis showing the effect of MG132 (20 µm, 4 h) on USP9X knockdown U251 cells.
Figure 4
Figure 4
USP9X removes K48‐linked polyubiquitination on K91 and K103 of GS. A) Ubiquitination assay showing GS ubiquitination in USP9X knockdown U251 cells. B) Ubiquitination assay showing GS ubiquitination in USP9X knockdown U251 cells, detected with primary antibodies recognizing K48‐ and K63‐linked ubiquitin. C) Schematic diagram of the potential ubiquitination sites of GS. D) Ubiquitination assay showing the ubiquitination of GS mutants in U251 cells. E) CHX chase assay and quantification graph showing the protein stability of GS‐WT, ‐K91R, and ‐K103R. F) IB analysis showing the GS mutants after treatment with 4 mm glutamine following 48 h of glutamine deprivation. G) Ubiquitination assay showing the ubiquitination of GS‐WT, ‐K91R, and ‐K103R in USP9X knockdown U251 cells. H) Conservation of GS‐K91 and K103 across various organisms. I) IB analysis showing the effect of HDAC6 overexpression on USP9X knockdown U251 cells. J) IB analysis showing the effect of USP9X‐C overexpression on HDAC6 knockdown U251 cells. K) IP analysis showing the interaction between USP9X‐C and GS‐2KR in U251 cells. L) Ubiquitination assay showing GS‐2KR ubiquitination in U251 cells. Data are shown as mean ± SD, n = 3.
Figure 5
Figure 5
Inhibition of HDAC6 and USP9X suppresses GBM cell growth and viability. A) Cell viability and B) colony formation analyses showing the effects of ACY738 (5 µm) in U251 cells incubated in Gln ± media. C) Cell viability and D) colony formation analyses showing the effects of WP1130 (5 µm) in U251 cells incubated in Gln ± media. E) IB analysis showing apoptosis induction by 5 µm ACY738, WP1130, and the combination of both inhibitors in U251 cells. Cells were incubated with the inhibitors for 24 h. F) Apoptosis assay with Annexin V/PI staining after treatment with 5 µm ACY738, WP1130, and the combination of both inhibitors. Apoptotic cells (%) were then calculated. G) Cell viability, H) colony formation, and I) cell proliferation analyses (n = 5) showing the effects of HDAC6 knockdown and the rescue effects of GS overexpression in U251 cells incubated in Gln+ (represented by solid lines)/Gln− (represented by dotted lines) media containing 4 mm of Glu and 0.8 mm of NH4Cl. J) Cell viability, K) colony formation, and L) cell proliferation analyses (n = 5) showing the effects of USP9X knockdown and the rescue effects of GS overexpression in U251 cells incubated in Gln+ (represented by solid lines)/Gln− (represented by dotted lines) media containing 4 mm of Glu and 0.8 mm of NH4Cl. M) Cell viability of USP9X overexpressed HDAC6 knockdown U251 cells and HDAC6 overexpressed USP9X knockdown U251 cells. Cells were incubated in Gln+ media supplemented with 4 mm Glu, and 0.8 mm NH4Cl, and cell viability was measured 72 h after seeding. N) Cell viability of HDAC6 knockdown and USP9X knockdown U251 cells incubated in Gln ± media supplemented with or without 4 mm Glu, 0.8 mm NH4Cl, and 1 mm MSO for 72 h. Data are shown as mean ± SD; n = 3, unless otherwise noted.
Figure 6
Figure 6
Silencing of HDAC6 and USP9X attenuates GBM tumorigenesis in vivo. A) Images, B) tumor volumes, and C) tumor weights of U251‐derived xenograft tumors (n = 6). D) Representative images for IHC staining for Ki‐67 and GS in subcutaneous tumors, and graph showing the relative number of E) Ki‐67 positive cells and F) GS staining intensity. Scale bar of low magnification, 100 µm; Scale bar of high magnification, 20 µm. G) Representative bioluminescence images of U251‐derived intracranial xenograft mice taken at weeks 1, 2, and 3 after cell implantation (n = 5). H) Luminescence intensity of U251‐derived intracranial xenograft tumors in week 3 and I) over 3 weeks (n = 5). J) Representative images for H&E and IHC staining in intracranial tumors, and graph showing the relative number of K) Ki‐67 positive cells and L) GS staining intensity. Scale bar of H&E staining, 2 mm, Scale bar of low magnification in IHC staining, 50 µm; Scale bar of high magnification in IHC staining, 20 µm. Data are shown as mean ± SD; n = 3, unless otherwise noted.
Figure 7
Figure 7
Ablation of USP9X and HDAC6 impairs de novo nucleotide synthesis. A) Schematic illustration of glutamine metabolism. B) IB analysis showing that GS, HDAC6, and USP9X are knockdown in U251 cells. Relative levels of C) 15N2‐NH4Cl‐derived Gln, D) Glu, E) IMP, and F) UMP normalized to control NT cells. Cells were glutamine‐depleted for 12 h before labeling and incubated in glutamine‐free media containing 6 mm dmKG and 0.8 mm 15N2‐NH4Cl for 24 h. MRM transition of metabolites is summarized in Table S2 (Supporting Information). Colony formation assays in G) HDAC6 knockdown and H) USP9X knockdown U251 cells. Cells were incubated in Gln ± media supplemented with a combination of A, G, C, T, and U (0.2 mm each). I) Cell viability analysis of HDAC6 knockdown and USP9X knockdown U251 cells. Cells were incubated in Gln ± media supplemented with 0.2 mm each A, G, C, T, and U for 72 h, as indicated. Data are shown as mean ± SD; n = 3.
Figure 8
Figure 8
HDAC6 and USP9X positively correlate with GS and poor prognosis in GBM. Representative images and the number of stained samples from IHC staining of A) HDAC6 and B) USP9X in glioma and normal tissues. Data were obtained from the Human Protein Atlas database. IHC staining of C) HDAC6 and D) USP9X in TMA sections of GBM and normal tissues. E) Representative images of HDAC6, USP9X, and GS IHC staining in the GBM TMA sections. Scale bar, 20 µm. F–I) Correlation analysis between HDAC6, USP9X, and GS in the GBM TMA sections (n = 70). J,K) Kaplan–Meier survival analysis of primary GBM samples from the GEO dataset (GSE42669) stratified by HDAC6 and USP9X expression for overall survival (OS) and progression‐free survival (PFS). L) A Schematic diagram of HDAC6 and USP9X‐mediated GS regulation in GBM. Data are shown as mean ± SD.

References

    1. Bi J., Chowdhry S., Wu S., Zhang W., Masui K., Mischel P. S., Nat. Rev. Cancer 2020, 20, 57. - PubMed
    1. Agnihotri S., Zadeh G., Neuro. Oncol. 2016, 18, 160. - PMC - PubMed
    1. Yoshida G. J., J. Exp. Clin. Cancer Res. 2015, 34, 111. - PMC - PubMed
    1. Cluntun A. A., Lukey M. J., Cerione R. A., Locasale J. W., Trends Cancer 2017, 3, 169. - PMC - PubMed
    1. Yoo H. C., Yu Y. C., Sung Y., Han J. M., Exp. Mol. Med. 2020, 52, 1496. - PMC - PubMed

MeSH terms

LinkOut - more resources