. 2025 Jul 1;6(4):343-363.
doi: 10.1158/2643-3230.BCD-24-0278.

Enhancer Hijacking Discovery in Acute Myeloid Leukemia by Pyjacker Identifies MNX1 Activation via Deletion 7q

Etienne Sollier #  1 Anna Riedel #  1 Umut H Toprak #  2 Justyna A Wierzbinska  1 Dieter Weichenhan  1 Jan Philipp Schmid  3   4 Mariam Hakobyan  5   6 Aurore Touzart  1   7 Ekaterina Jahn  8 Binje Vick  3   4 Fiona Brown-Burke  1 Katherine Kelly  1 Simge Kelekçi  1 Anastasija Pejkovska  1 Ashish Goyal  1 Marion Bähr  1 Kersten Breuer  1 Mei-Ju May Chen  1 Maria Llamazares-Prada  1 Mark Hartmann  5   6 Maximilian Schönung  5   6 Nadia Correia  9 Andreas Trumpp  9 Yomn Abdullah  10 Ursula Klingmüller  10 Sadaf S Mughal  11   12 Benedikt Brors  6   11   12   13 Frank Westermann  2 Elias Ulrich  12   14   15 Robert J Autry  12   14   15 Matthias Schlesner  16 Sebastian Vosberg  4   17 Tobias Herold  4   17 Philipp A Greif  4   17 Dietmar Pfeifer  18 Michael Lübbert  18 Thomas Fischer  19 Florian H Heidel  20   21 Claudia Gebhard  22 Wencke Walter  23 Torsten Haferlach  23 Ann-Kathrin Eisfeld  24 Krzysztof Mrózek  24 Deedra Nicolet  24 Lars Bullinger  25 Leonie Smeenk  26 Claudia Erpelinck-Verschueren  26 Roger Mulet-Lazaro  26 Ruud Delwel  26 Aurélie Ernst  12   27 Michael Scherer  1 Pavlo Lutsik  1   28 Irmela Jeremias  3   4   29 Konstanze Döhner  8 Hartmut Döhner  8 Daniel B Lipka #  5   6   12   30 Christoph Plass #  1
Affiliations

Enhancer Hijacking Discovery in Acute Myeloid Leukemia by Pyjacker Identifies MNX1 Activation via Deletion 7q

Etienne Sollier et al. Blood Cancer Discov. .

Abstract

Acute myeloid leukemia (AML) with complex karyotype is characterized by high genomic complexity, including frequent TP53 mutations and chromothripsis. Genomic rearrangements can reposition active enhancers near proto-oncogenes, leading to their aberrant expression; however, a comprehensive understanding of these events in AML is still incomplete. To facilitate the discovery of such "enhancer hijacking" events, we developed Pyjacker, a computational tool, and applied it to 39 AML samples with complex karyotype. Pyjacker identified several enhancer hijacking events in AML patient samples, including aberrant expression of MNX1, which can result from del(7)(q22q36) and is associated with hijacking of a CDK6 enhancer. MNX1 activation occurred in 1.4% of patients with AML and showed significant co-occurrence with BCOR mutations. Through a xenograft mouse model, we demonstrated that MNX1 is required for leukemia cell fitness. Pyjacker is an easy-to-use, accurate, and broadly applicable tool for identifying consequences of genomic events driving tumorigenesis, especially when germline genomic data are missing.

Significance: This study examines the consequences of structural alterations in AML and demonstrates that proto-oncogene activation by enhancer hijacking is an understudied pathomechanism. MNX1 overexpression demonstrates that deletions on chromosome 7q can not only lead to haploinsufficiency but also to activation of oncogenes by enhancer hijacking.


Conflict of interest statement

E. Jahn reports personal fees and other support from AstraZeneca outside the submitted work. F. Brown-Burke reports grants from DKFZ during the conduct of the study. M. Schönung reports other support from Joachim Herz Foundation during the conduct of the study. S.S. Mughal reports grants from DFG (FOR2674) outside the submitted work. B. Brors reports grants from DFG (German Research Council) during the conduct of the study and grants from Hector Foundation II, German Federal Ministry of Research and Education (BMBF): DEEP-HCC/Li-Sym Cancer, and Fritz Thyssen Foundation outside the submitted work. A.-K. Eisfeld reports grants from the NCI and American Cancer Society during the conduct of the study, as well as other support from Karyopharm, personal fees from VJ HemeOnc and Dava Oncology, and Syndax outside the submitted work. L. Bullinger reports grants from Bayer and Jazz Pharmaceuticals and personal fees from Abbvie, Amgen, Astellas, Bristol Myers Squibb, Daiichi Sankyo, Gilead, Glaxo Smith Kline, Janssen, Jazz Pharmaceuticals, Novartis, Otsuka, Pfizer, Roche, Sanofi, and Servier outside the submitted work. K. Döhner reports grants from Astex Pharmaceuticals during the conduct of the study. H. Döhner reports grants from Astex during the conduct of the study. D.B. Lipka reports grants from the German Research Foundation (DFG) during the conduct of the study and personal fees from Infectopharm GmbH outside the submitted work. No disclosures were reported by the other authors.

Figures

Figure 1.
Figure 1.
Detection of enhancer hijacking in 39 ckAML samples. A, Schematic representation of the main sources of information used by Pyjacker: breakpoints, overexpression, monoallelic expression, and enhancers. B, Scatter plot of genes identified by Pyjacker in 39 ckAML samples as being potentially activated by genomic rearrangements in one or more samples, in which the x-axis shows the genomic location of the genes, and the y-axis shows the FDR. Gene names for the enhancer hijacking candidates are written in bold, and if a fusion transcript is detected, the fusion partner is named. chr, chromosome.
Figure 2.
Figure 2.
Activation of MECOM and its homolog PRDM16 by a GATA2 enhancer. A, Expression of MECOM in all samples in TPM, ranked by expression of MECOM, in which samples 15PB19457 and 15KM20146 with breakpoints near MECOM are highlighted in green. B, Variant allele frequencies in WGS (DNA) and RNA-seq for SNPs in MECOM for sample 15PB19457 (major allele frequencies in blue and minor allele frequencies in red). C, Copy numbers (CN) and SVs on chromosome 3 for sample 15PB19457. Copy number losses are indicated in blue, and gains in red. SVs are shown as arcs at the top, in which the color indicates the orientation of the breakpoint: blue for deletion, red for duplication, and purple for inversion. In the chromosome ideogram, the three regions that are displayed with a zoom-in in (D) are highlighted in colors, with colors matching the arrows in (D). D, ChIP-seq tracks for P300 and H3K27ac in the myeloid cell lines MOLM-1 and Kasumi-1 in the region around MECOM for the rearranged chromosome of sample 15PB19457. The putative enhancer is highlighted in orange. E, Expression of PRDM16 in all samples, ranked by PRDM16 expression, in which sample 16KM11270 with a breakpoint near PRDM16 is highlighted in green. F, Variant allele frequencies in WGS (DNA) and RNA-seq for SNPs in PRDM16 in TPM for sample 16KM11270 (major allele frequency in blue and minor allele frequency in red). G, ChIP-seq tracks for P300 and H3K27ac in the myeloid cell lines MOLM-1 and Kasumi-1 in the region around PRDM16 on the rearranged chromosome of sample 16KM11270. The putative enhancer is highlighted in orange. chr, chromosome.
Figure 3.
Figure 3.
Aberrant EPO expression might cooperate with EPOR amplification in AEL. A,EPO expression in all samples in TPM, with sample 15KM18875 with EPO overexpression highlighted in green. B, Proportion of samples with nonzero EPO expression in three AEL cohorts profiled with RNA-seq (–49). C, Copy numbers (CN) and SVs on chromosome 7 (containing EPO) and chromosome 11 in sample 15KM18875. Copy number losses are indicated in blue, and gains in red. SVs are shown at the top, with arcs connecting breakpoints or lines indicating the chromosome of the other side of the breakpoint (for C, D, and F the colors of SVs indicate the orientation: blue for deletion, red for duplication, purple for inversion, and green for interchromosomal SV). D, A 300 kb circular piece of DNA containing EPO and a putative enhancer (highlighted in orange), with P300 and H3K27ac peaks in the erythroid cell line K562. E,EPOR expression in TPM in all samples, with sample 15KM18875 highlighted in green. F, Copy numbers and SVs on chromosome 19 for sample 15KM18875. chr, chromosome.
Figure 4.
Figure 4.
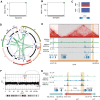
The homeobox genes GSX2 and MNX1 can be activated by atypical mechanisms. A,GSX2 expression in all samples in TPM, with sample 16PB5693 with GSX2 expression highlighted in green. B,MNX1 expression in all samples in TPM, with sample 15PB8708 with MNX1 overexpression highlighted in green. C, Variant allele frequencies in WGS and RNA-seq for an SNP in MNX1 in sample 15PB8708 (major allele frequency in blue and minor allele frequency in red). D, Circos plot showing CNAs and SVs in sample 16PB5693 for the chromosomes involved in a chromothripsis event. Copy number (CN) losses are indicated in blue, and gains in red. SVs are shown as arcs at the center, with interchromosomal breakpoints in green, duplications in red, deletions in blue, and inversion in purple. E, HiC data from HSPCs (19) and ChIP-seq data from myeloid cell lines in the region around GSX2. The putative enhancer is highlighted in orange, and the region in gray is deleted in sample 16PB5693. F, CNs and breakpoints on chromosome 7 for sample 15PB8708. In the chromosome ideogram, regions highlighted in red and teal correspond to the regions shown in (G), with matching colors. G, ChIP-seq tracks for P300 and H3K27ac in the myeloid cell lines MOLM-1 and Kasumi-1 in the region around MNX1 on the rearranged chromosome of sample 15PB8708. Enhancers of the CDK6 region are highlighted in orange. chr, chromosome.
Figure 5.
Figure 5.
MNX1 is expressed in 1.4% of all AML cases, often with del(7)(q22q36). A, qRT-PCR screen for MNX1 expression in three AML cohorts (Rotterdam, Ulm, and Jena). B, Fifteen MNX1-expressing samples with del(7)(q22q36) profiled with WGS, with a zoom-in around the breakpoints (hg19 reference). The blue rectangles indicate the genomic regions that are retained, and dashed lines represent breaks. C, Percentage of samples with mutations in frequently mutated genes for MNX1+ samples with breakpoints near MNX1, MNX1+ samples without breakpoints, and TCGA-LAML samples. D, scRNA-seq analysis for MNX1+ and control del(7q) AML samples. Left, UMAP showing cell type labels of 53,479 cells integrated across eight patients. Right, UMAP highlighting MNX1 expression (top) and the presence of a del(7q) (bottom) as predicted for patients with del(7q) (n = 4) and patients with del(7q) and MNX1 activation (n = 4). chr, chromosome; UMAP, Uniform Manifold Approximation and Projection.
Figure 6.
Figure 6.
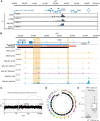
Putative enhancers in the CDK6 region interact with MNX1 in del(7q) AML. A, Chromatin interaction detected with 4C in the region around CDK6 using MNX1 as viewpoint, for three different del(7)(q22q36) samples and one control sample (GDM-1 cell line) without del(7q). B, The 200 kb search region based on the enhancer duplication (sample 15PB8708) and the sample with the leftmost deletion (MLL215704), with tracks for enhancer marks: ATAC-seq in del(7q) samples MTM9 and 2KFQ, ATAC-seq and ACT-seq against H3K27ac and H3K4me1 in the PDX sample AML-661 derived from a del(7q) patient, and ChIP-seq against P300 and H3K27ac in the MOLM-1 cell line. The putative enhancers are highlighted in orange. C, Copy number (CN) profile and SVs on chromosome 7 in the engineered cell line validating the insertion of the 1 kb region. D, Circos plot for the same cell line showing the absence of other rearrangements. Copy number losses are indicated in blue, and gains in red. SVs are shown as arcs at the center, with interchromosomal breakpoints in green, duplications in red, deletions in blue, and inversion in purple. E,MNX1 expression in TPM for the parental ChiPSC22 HSPCs (n = 5, from independent differentiation experiments) compared with the engineered cell with the enhancer insertion (enh ins; n = 8, from independent differentiation experiments for two different cell lines). **, P < 0.01 using a two-sided t test. chr, chromosome.
Figure 7.
Figure 7.
Knockdown of MNX1 reduces tumor load of AML PDX cells in vivo. A, Scheme depicting the experimental setup of the in vivo constitutive experiment. AML-661 PDX cells expressing the cassettes for both CRE-ERT2 and the shRNA addressing MNX1 or a control gene were amplified in mice. Fresh PDX cells were stimulated with TAM (single dose, 200 nmol/L, 72 hours) to induce the knockdown in vitro. Cells with knockdown were enriched by flow cytometry gating on the respective fluorochrome markers GFP (knockdown of MNX1) and T-Sapphire (control knockdown). The two populations were mixed at a 1:1 ratio and injected into mice. The ratio between both populations was measured at advanced leukemic disease in different organs (more than 60% hCD33+ cells in PB). B, The results of the experiment described in (A) using five mice. C, Scheme depicting the experimental setup of the in vivo inducible experiment. The cell populations described in (A) were mixed in a 1:1 ratio and injected into 13 mice. Fourteen days after injection, three mice were sacrificed (N = 3) to quality control the 1:1 ratio of the two cell populations by flow cytometry. TAM (50 mg/kg) was orally administered to the 10 remaining mice. Five mice were sacrificed 3 days later to measure the rate of shRNA induction by TAM. At an advanced stage of leukemia, the remaining five mice were sacrificed to determine the ratio between the control vs. MNX1 knockdown populations. D, The results of the experiment described in (C). P values determined by a one-tailed unpaired t test. **, P < 0.01; ****, P < 0.0001.

References

    1. Cancer Genome Atlas Research Network; Ley TJ, Miller C, Ding L, Raphael BJ, Mungall AJ, Robertson A, et al. Genomic and epigenomic landscapes of adult de novo acute myeloid leukemia. N Engl J Med 2013;368:2059–74. - PMC - PubMed
    1. Papaemmanuil E, Gerstung M, Bullinger L, Gaidzik VI, Paschka P, Roberts ND, et al. Genomic classification and prognosis in acute myeloid leukemia. N Engl J Med 2016;374:2209–21. - PMC - PubMed
    1. Arber DA, Orazi A, Hasserjian RP, Borowitz MJ, Calvo KR, Kvasnicka H-M, et al. International consensus classification of myeloid neoplasms and acute leukemias: integrating morphologic, clinical, and genomic data. Blood 2022;140:1200–28. - PMC - PubMed
    1. Mrózek K. Cytogenetic, molecular genetic, and clinical characteristics of acute myeloid leukemia with a complex karyotype. Semin Oncol 2008;35:365–77. - PMC - PubMed
    1. Korbel JO, Campbell PJ. Criteria for inference of chromothripsis in cancer genomes. Cell 2013;152:1226–36. - PubMed

MeSH terms