. 2025 Mar 31;20(3):e0320538.
doi: 10.1371/journal.pone.0320538. eCollection 2025.

Exposure to circadian disrupting environment and high-fat diet during pregnancy and lactation alter reproductive competence and lipid profiles of liver, mammary, plasma and milk of ICR mice

Affiliations

Exposure to circadian disrupting environment and high-fat diet during pregnancy and lactation alter reproductive competence and lipid profiles of liver, mammary, plasma and milk of ICR mice

Leriana Garcia Reis et al. PLoS One. .

Abstract

This study's objective was to determine the effects of pre-pregnancy obesity induced by a high-fat diet and exposure to circadian-disrupting light-dark phase shifts on birth littler size, pup survival to 24h and growth to lactation day 12, and their relationship to maternal feeding patterns, fecal corticosterone levels, milk composition, and lipid profiles of liver, plasma, mammary gland, and milk. A 2 by 2 factorial designed experiment of female ICR mice assigned to control (CON; 10% fat) or high-fat (HF; 60% fat) and either a 12-hour light-dark (LD) cycle or a chronic jet lag model of 6-hour phase-shifts (PS) in light-dark cycle every 3 days throughout pregnancy and lactation, resulted in 4 treatment groups: CON-LD, CON-PS, HF-LD and HF-PS. HF diet increased maternal pre-pregnancy body weight and elevated milk lactose. Whereas PS reduced milk lactose within the CON diet group, and increased maternal feed intake and fecal corticosterone levels. PS exposure also affected the time of day of birth. Neither PS nor HF affected birth litter size or pup survival. Only diet impacted final litter weight, with HF greater than CON. Among the 1204 lipids detected by multiple reaction monitoring (MRM)-profiling, diet altered 67.1% in milk, 58.1% in mammary gland, 27.2% in the liver, and 10.9% in plasma, with HF increasing the carbon length of diacylglycerols in the liver and milk, and carbon length of triacylglycerols in plasma, mammary gland and milk. Although exposure to PS had no overall impact on maternal lipid profiles, interactions (P < 0.05) were found between PS and diets in the phosphatidylcholine and phosphatidylethanolanine class of lipids. Findings support that high fat diet and exposure to circadian disrupting environments impact maternal feeding behavior and stress responses as well as lipid profiles, which may relate to their negative association with maternal health and offspring development.


Conflict of interest statement

The authors have declared that no competing interests exist.

Figures

Fig 1
Fig 1. Experimental design and data collection overview of the 2 x 2 factorial study.
The study investigated the combined effects of diet, high fat (60% fat, HF) or control (10% fat, CON), and light exposures that maintain homeostasis, regular 24 h cycles of 12 h of light and 12 h of dark (LD), or disrupt the circadian timing system, 6 h light phase shifts every 3 days (PS), on birth littler size, pup survival to 24 h and growth to lactation day 12, and their relationship to maternal feeding patterns, fecal corticosterone levels, milk composition, and lipid profiles of liver, plasma, mammary gland, and milk. Female ICR mice began experimental diets 4 weeks (CON or HF) prior to mating to males at a 2:1 ratio to achieve differential body weight prior to pregnancy. After mating, females remained on respective diets and were housed individually under experimental lighting conditions until 12 days postpartum. Lighting conditions included a control (LD) 12 h light (114 lux at mouse eye level) - 12 h dark cycle (LD) or a chronic 6 h light phase-shift (PS), where the light phase was advanced by 6 h every three days. This resulted in 4 treatment groups: CON-LD, CON-PS, HF-LD, and HF-PS, with final group sizes of n = 8, n = 9, n = 8, and n = 7, respectively (A). Feed intake was measured twice daily to capture ‘day’ (0600-1800) and ‘night’ (1800-0600) feeding patterns. Feces were also collected twice daily from the cages to capture day (0600-1800) and night (1800-0600) output in early pregnancy (d5-d7), late pregnancy (d14 to parturition (~d18), and lactation (d4 to d6 of lactation). Females were allowed to birth naturally, time of day of birth was recorded and at 24 h postnatal, litters were standardized to n = 8 neonates/dam. Birth litter size, and pup survival to 24 h were recorded. Litter weight was taken every 2 days from day 0 to day 12 of lactation (L12). On L12, dams and pups were separated at 0600. Pups were weighed and then immediately euthanized. After 3 h of separation from pups, dams were milked, euthanized and blood and tissues collected (B).
Fig 2
Fig 2. Impact of light/dark (LD) exposure and phase shifts (PS) on diurnal feed and energy intake (A, B) and effect of light exposure, physiological stage, and time of day on feed and energy intake in mice (C, D).
LD, regular cycles of 12 hours of light and 12 hours of dark, and PS, mice exposed to 6-hour shifts in light-dark cycles every three days. Values are LS means ±  SEM. Fig A and B: different letters indicate significant differences at P < 0.001, with uppercase indicating a difference between treatments during the day, and lowercase indicating a difference between treatments during the night. Fig C and D: different letters indicate a tendency (P =  0.05) for feed intake and a significant difference (P < 0.05) for energy intake, with uppercase indicating a difference between day and night for LD, and lowercase indicating a difference between day and night for PS treatment.
Fig 3
Fig 3. Interaction between light and stage on fecal corticosterone levels (A), interaction between light exposure and diet on fecal weight (B) and interaction between light and day on corticosterone output in feces (C).
LD, regular cycles of 12 hours of light and 12 hours of dark, and PS, mice exposed to 6-hour shifts in light-dark cycles every three days. Control (CON) mice were fed a diet of 10% fat, and high-fat (HF) diet were fed a diet of 60% fat. Values are LS means ±  SEM. Early pregnancy (EP) was from d5-d7, late pregnancy (LP) was from d14-d16, and lactation was d4-d6. Fig A: This interaction was significant, with a P-value of 0.004. Uppercase indicates a significant difference between stages within LD light, and lowercase indicates a significant difference between stages within PS light. Fig B: This interaction was significant, with a P-value of 0.008. Bracket indicates a significant difference (P < 0.002) between diets within lights. Uppercase indicates a significant difference between CON diet, and lowercase indicates a significant difference between HF diet across the lights. Fig C: This interaction tended to be significant, with a P-value of 0.068. Uppercase indicates a tendency to be a significant difference between day, and lowercase indicates a tendency to be a significant difference between night across the lights.
Fig 4
Fig 4. Interaction of diet and physiological stage (pre-pregnancy and lactation d12) on dam’s weight.
Control (CON) mice were fed a diet of 10% fat, and high-fat (HF) diet were fed a diet of 60% fat. Values are LS means ±  SEM. Mice were fed respective diets ad libitum 4 weeks before mating. Neonates were euthanized on lactation day 12. Interaction diet*physiological stage had a P-value of 0.026. Brackets indicate significant difference at P < 0.001 between diets within pre-pregnancy. Uppercase indicates a difference between CON diet, and lowercase indicating a difference between HF diet across the stages.
Fig 5
Fig 5. Impact of diet and light on milk lactose.
LD, regular cycles of 12 hours of light and 12 hours of dark, and PS, mice exposed to 6-hour shifts in light-dark cycles every three days. Control (CON) mice were fed a diet of 10% fat, and high-fat (HF) diet were fed a diet of 60% fat. Values are LS means ±  SEM. Interaction diet*light had a P-value of 0.037. Different letters indicate significant difference at P < 0.001, with uppercase indicating a difference between LD, and lowercase indicating a difference between PS.
Fig 6
Fig 6. Interaction between light and time of day (TOD) of birth (A) and interaction between diet and time of day (TOD) of birth (B).
LD, regular cycles of 12 hours of light and 12 hours of dark, and PS, mice exposed to 6-hour shifts in light-dark cycles every three days. Control (CON) mice were fed a diet of 10% fat, and high-fat (HF) diet were fed a diet of 60% fat. Values are LS means ±  SEM. Significance was determined using a Chi-square test at a P < 0.05. Interaction light*time of day of birth had a P-value of 0.056 and diet*time had a P-value of 0.407. “Day” refers to the period from 0600 to 1800, and “night” refers to 1800 to 0600, regardless of the light pattern in the PS group.
Fig 7
Fig 7. Impact of phase shift (PS) and high-fat (HF) diet on litter weight.
LD, regular cycles of 12 hours of light and 12 hours of dark, and PS, mice exposed to 6-hour shifts in light-dark cycles every three days. Control (CON) mice were fed a diet of 10% fat, and high-fat (HF) diet were fed a diet of 60% fat. Values are LS means ±  SEM.
Fig 8
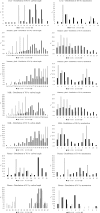
Fig 8. PCA of lipid profiles in liver, mammary gland, milk, and plasma affected by diet but not by light.
Red and green represent CON and HF diet, respectively, while triangles and circles represent the PS and LD treatment, respectively.
Fig 9
Fig 9. Effects of HF diet on distribution of lipid classes in the liver, mammary gland, milk and plasma by total carbon chain length and degree of unsaturation.
Fig 10
Fig 10. Distribution of downregulated and upregulated lipids in mammary gland under PS within the HF or CON diet (A, B) and lipid classes downregulated in HF-PS and upregulated in CON-PS highlight the consistent effect of PS treatment across diets (C, D).

References

    1. Lunn RM, Blask DE, Coogan AN, Figueiro MG, Gorman MR, Hall JE, et al.. Health consequences of electric lighting practices in the modern world: A report on the National Toxicology Program’s workshop on shift work at night, artificial light at night, and circadian disruption. Sci Total Environ. 2017;607–608:1073–84. doi: 10.1016/j.scitotenv.2017.07.056 - DOI - PMC - PubMed
    1. Smolensky MH, Hermida RC, Reinberg A, Sackett-Lundeen L, Portaluppi F. Circadian disruption: New clinical perspective of disease pathology and basis for chronotherapeutic intervention. Chronobiol Int. 2016;33(8):1101–19. doi: 10.1080/07420528.2016.1184678 - DOI - PubMed
    1. Gangwisch JE. Epidemiological evidence for the links between sleep, circadian rhythms and metabolism. Obes Rev. 2009;10 Suppl 2(0 2):37–45. doi: 10.1111/j.1467-789X.2009.00663.x - DOI - PMC - PubMed
    1. Sen A, Sellix MT. The Circadian Timing System and Environmental Circadian Disruption: From Follicles to Fertility. Endocrinology. 2016;157(9):3366–73. doi: 10.1210/en.2016-1450 - DOI - PubMed
    1. Rasmussen KM, Kjolhede CL. Maternal obesity: a problem for both mother and child. Obesity (Silver Spring). 2008;16(5):929–31. doi: 10.1038/oby.2008.36 - DOI - PubMed