

Marker selection strategies for circulating tumor DNA guided by phylogenetic inference
- PMID: 40163695
- PMCID: PMC12002908
- DOI: 10.1093/bioinformatics/btaf145
Marker selection strategies for circulating tumor DNA guided by phylogenetic inference
Abstract
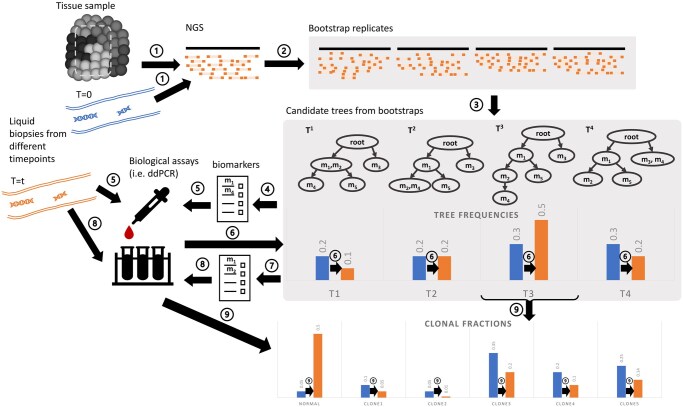
Motivation: Blood-based profiling of tumor DNA ("liquid biopsy") offers great prospects for non-invasive early cancer diagnosis and clinical guidance, but requires further computational advances to become a robust quantitative assay of tumor clonal evolution. We propose new methods to better characterize tumor clonal dynamics from circulating tumor DNA (ctDNA), through application to two specific tasks: (i) applying longitudinal ctDNA data to refine phylogeny models of clonal evolution, and (ii) quantifying changes in clonal frequencies that may be indicative of treatment response or tumor progression. We pose these through a probabilistic framework for optimally identifying markers and using them to characterize clonal evolution.
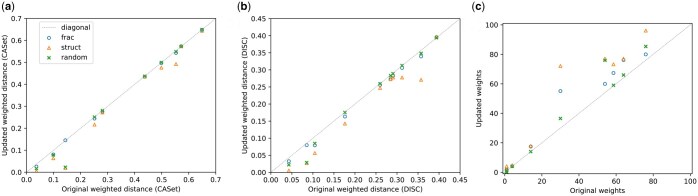
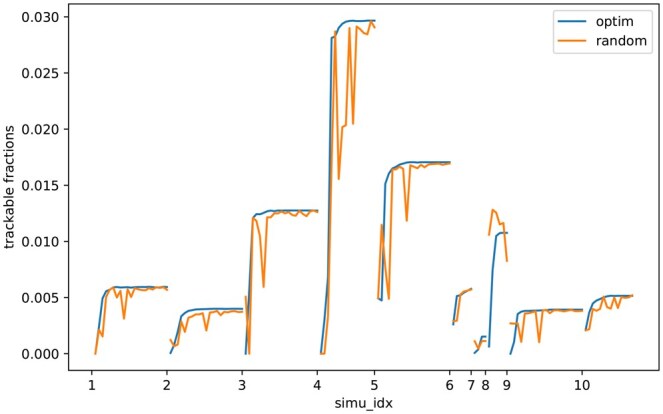
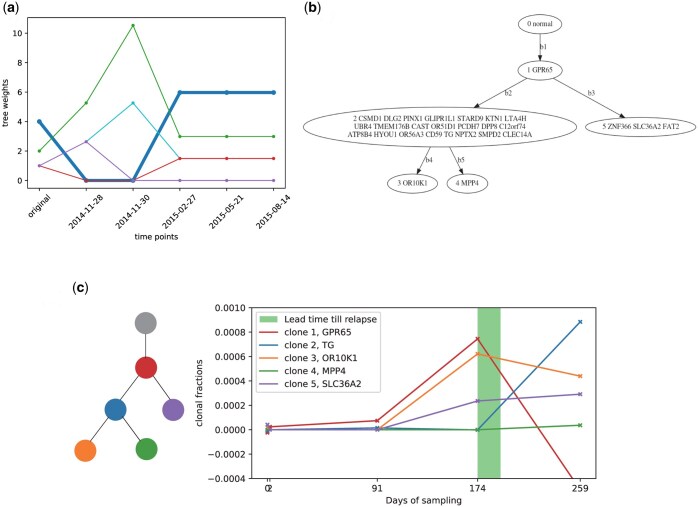
Results: We first estimate a density over clonal tree models using bootstrap samples over pre-treatment tissue-based sequence data. We then refine these models over successive longitudinal samples. We use the resulting framework for modeling and refining tree densities to pose a set of optimization problems for selecting ctDNA markers to maximize measures of utility for reducing uncertainty in phylogeny models and quantifying clonal frequencies given the models. We tested our methods on synthetic data and showed them to be effective at refining tree densities and inferring clonal frequencies. Application to real tumor data further demonstrated the methods' effectiveness in refining a lineage model and assessing its clonal frequencies. The work shows the power of computational methods to improve marker selection, clonal lineage reconstruction, and clonal dynamics profiling for more precise and quantitative assays of somatic evolution and tumor progression.
Availability and implementation: https://github.com/CMUSchwartzLab/Mase-phi.git. (DOI: 10.5281/zenodo.14776163).
© The Author(s) 2025. Published by Oxford University Press.
Figures
Update of
-
Marker selection strategies for circulating tumor DNA guided by phylogenetic inference.bioRxiv [Preprint]. 2024 Mar 27:2024.03.21.585352. doi: 10.1101/2024.03.21.585352. bioRxiv. 2024. Update in: Bioinformatics. 2025 Mar 29;41(4):btaf145. doi: 10.1093/bioinformatics/btaf145. PMID: 38586041 Free PMC article. Updated. Preprint.
Similar articles
-
Marker selection strategies for circulating tumor DNA guided by phylogenetic inference.bioRxiv [Preprint]. 2024 Mar 27:2024.03.21.585352. doi: 10.1101/2024.03.21.585352. bioRxiv. 2024. Update in: Bioinformatics. 2025 Mar 29;41(4):btaf145. doi: 10.1093/bioinformatics/btaf145. PMID: 38586041 Free PMC article. Updated. Preprint.
-
Modeling clonal structure over narrow time frames via circulating tumor DNA in metastatic breast cancer.Genome Med. 2021 May 20;13(1):89. doi: 10.1186/s13073-021-00895-x. Genome Med. 2021. PMID: 34016182 Free PMC article.
-
Capturing Tumor Heterogeneity and Clonal Evolution by Circulating Tumor DNA Profiling.Recent Results Cancer Res. 2020;215:213-230. doi: 10.1007/978-3-030-26439-0_11. Recent Results Cancer Res. 2020. PMID: 31605231 Review.
-
Dynamic Treatment Stratification Using ctDNA.Recent Results Cancer Res. 2020;215:263-273. doi: 10.1007/978-3-030-26439-0_14. Recent Results Cancer Res. 2020. PMID: 31605234 Review.
-
Clonal dynamics of circulating tumor DNA during immune checkpoint blockade therapy for melanoma.Cancer Sci. 2021 Nov;112(11):4748-4757. doi: 10.1111/cas.15088. Epub 2021 Sep 22. Cancer Sci. 2021. PMID: 34477284 Free PMC article.
References
-
- Cescon DW, Bratman SV, Chan SM et al. Circulating tumor DNA and liquid biopsy in oncology. Nat Cancer 2020;1:276–90. - PubMed
MeSH terms
Substances
Grants and funding
LinkOut - more resources
Full Text Sources
Medical
