. 2025 Apr 8;122(14):e2426742122.
doi: 10.1073/pnas.2426742122. Epub 2025 Mar 31.

Therapeutic targeting of the NOTCH1 and neddylation pathways in T cell acute lymphoblastic leukemia

Affiliations

Therapeutic targeting of the NOTCH1 and neddylation pathways in T cell acute lymphoblastic leukemia

Kalay Bertulfo et al. Proc Natl Acad Sci U S A. .

Abstract

Gamma Secretase Inhibitors (GSIs) effectively block oncogenic Notch homolog-1 (NOTCH1), a characteristic feature of T cell acute lymphoblastic leukemias (T-ALL). However, their clinical application has been stalled by the induction of severe gastrointestinal toxicity resulting from the inhibition of NOTCH signaling in the gut, which translates into increased goblet cell differentiation. Genome-wide CRISPR loss-of-function screen in the colon cancer cell line LS174T identified the neddylation pathway as a main regulator of goblet cell differentiation upon NOTCH1 inhibition. Consistently, pharmacologic inhibition of the neddylation pathway with the small molecule inhibitor MLN4924, rescued GSI-induced differentiation in LS174T cells. Mechanistically, neddylation inhibition by MLN4924 increases the protein stability of Hairy and enhancer of split-1, a direct NOTCH1 transcriptional target and key regulator of absorptive and secretory cell fate decisions. Combined treatment with GSI and MLN4924 in a murine Notch1-dependent model of T-ALL led to leukemia regression and improved overall survival in the absence of gut toxicity. Overall, these results support the combined targeting of the NOTCH1 and neddylation pathways for the treatment of NOTCH1-induced T-ALL.

Keywords: HES1; NOTCH1; T cell lymphoblastic leukemia (T-ALL); experimental therapeutics; neddylation.


Conflict of interest statement

Competing interests statement:P.P.-D. is currently employed by Revvity, Waterbeach, United Kingdom; A.A.-I. is currently employed at PsychoGenics Inc., Paramus, NJ; J.S. is currently employed by Bristol Myers Squibb, Lawrenceville, NJ; A.F. is currently employed by Regeneron Pharmaceuticals, Tarrytown, NY. None of the data presented in this manuscript is in any way related to their current activities.

Figures
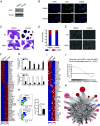
Fig. 1.
Fig. 1.
Effect of Notch1 inhibition on LS174T and intestinal stem differentiation. (A) Western blot analysis of intracellular activated NOTCH1 in LS174T cells treated with 250 nM CompE or vehicle for 48 h. (B) Immunofluorescence staining for DAPI and intracellular activated Notch1 in LS174T cells after treatment with 250 nM CompE or vehicle for 48 h. Images were captured on a Leica Microsystems DM IL LED Fluo microscope and correspond to representative images of triplicate experiments. (Scale bar, 200 µM.) (C) PAS staining of LS174T cells infected with EV or HES1 treated with 250 nM CompE and vehicle control for 48 h. 20× magnification. (D) Cell cycle analysis in LS174T cells after treatment with 250 nM CompE or vehicle for 48 h. Data are represented as percentage of cells within G1 and S + G2/M assessed by BrdU incorporation and 7-AAD staining. Data correspond to mean ± SD of triplicate experiments. (E) Brightfield microscopic images of LS174T cells overexpressing HES1 or EV control treated with 250 nM or vehicle for 5 d. (Scale bar, 200 µM.) (F) Gene expression changes in LS174T cells treated with DMSO or 250 nM CompE at 48 h posttreatment. The heat map diagram shows average values from triplicate samples. Relative expression levels are color-coded as indicated at the Bottom. Fold change > 2 and P < 0.05 were used as cut-offs. (G) Quantitative RT-PCR analysis of selected genes in LS174T cells treated with DMSO or 250 nM CompE. Data correspond to mean ± SD of triplicate experiments. (H) FACS plot and bar graph showing GFPHigh cell populations isolated from Lgr5-EGFP-IRES-creERT2 mice treated with vehicle or DBZ (30 µmol kg−1) for 24 h (n = 3 mice per group). (I) Gene expression changes in Lgr5-EGFP+ intestinal stem cells at 24-h posttreatment with vehicle or 30 µmol kg−1 DBZ. The heat map diagram shows average values from triplicate samples. Relative expression levels are color-coded as indicated at the Bottom. Fold change > 2 and P < 0.05 were used as cut-offs. (J) GSEA of the top differentially expressed genes in CompE-treated LS174T cells in (F) vs. top 300 upregulated genes in DBZ-treated Lgr5-EGFPHigh mouse intestinal stem cells in (I). (K) Master regulator analysis in CompE-treated LS174T cells performed using MARINa. Shown in red are TFs with increased activity and in blue are TFs with decreased activity. P values in all panels were calculated using two-tailed Student’s t test. NS, not significant.
Fig. 2.
Fig. 2.
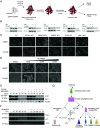
Genome-wide CRISPR screen in LS174T cells to uncover genetic mechanisms involved in goblet cell differentiation in response to GSI. (A) Schematic illustration of the design of the genome-wide CRISPR–Cas9 screen in LS174T cells. Cells were treated with 100 nM CompE for 14 days (d14) and 200 nM CompE for an additional 14 days (d28). (B) CRISPR screen gRNA fold change after CompE treatment (d14 or d28) vs. DMSO. (C) GSEA of gRNA enriched (>1.5) at d14 vs. at d28. (D) DAVID gene ontology analysis of gRNAs enriched at d28. (E) MAGecK Rank plot of the genes that induce resistance (red) or sensitivity (blue) to goblet cell differentiation when knocked-out in LS174T cells. CompE-DMSO beta score <−0.5 or >0.5 and P < 0.05 were used as cut-offs. (F) Schematic representation of the neddylation pathway. Top resistance hits identified in the CRISPR screen are shown in red. MLN492, which forms a stable covalent adduct with NEDD8 in the NAE catalytic pocket, is shown next to its target.
Fig. 3.
Fig. 3.
Effects of genetic and pharmacological inhibition of the neddylation pathway on secretory cell differentiation in LS174T intestinal model. (A) Schematic illustration of genetic inhibition in LS174T cells using the dox-inducible CRISPR-Cas9 system. (B) Western Blot analysis showing expression of ATOH1, SENP8, UBE2F, CUL5, and NAE1 in LS174T cells after doxycycline-induced CRISPR mediated knockdown (dox) and after treatment with 250 nM CompE for 5 d. (C) Brightfield images of differentiation phenotype 48 h after 200 nM CompE or vehicle treatment in corresponding LS174T line. (Scale bar, 200 μM.) (D) Brightfield images of LS174T cells treated with increasing concentrations of neddylation inhibitor MLN4924. (Scale bar is 200 μM.) (E) Western blot analysis of ICN1 and HES1 protein levels in LS174T cells treated with vehicle, 250 nM CompE, 50 nM MLN4924, and CompE + MLN4924. (F) Western blot analysis of HES1 and p21 protein abundance at different time points after addition of 100 µg mL−1 cycloheximide in LS174T cells treated with vehicle or 50 nM MLN4924. (G) Schematic representation of the transcriptional regulatory network controlling goblet cell differentiation downstream of Notch and the MLN4924-induced stabilization of Hes1. Positive (in green) and negative (in red) effects on Hes1 protein levels by MLN4924 and GSI, respectively, are shown.
Fig. 4.
Fig. 4.
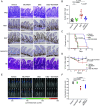
Therapeutic targeting of the Notch1 and neddylation pathways in T-ALL. (A) Histological and histochemical analysis of small intestine from C57BL/6 mice treated with vehicle, MLN4924 (20 mg kg−1), DBZ (5 μmol kg−1), or MLN4924 (20 mg kg−1) + DBZ (5 μmol kg−1) for 5 d. PAS, periodic acid–Schiff stain, HE, hematoxylin, and eosin stain. (Scale bar is 100 μM.) (B) Corresponding number of goblet cells per field from a is shown. (C) Kaplan–Meier plot of overall survival among Notch1-induced leukemia mice treated with vehicle, MLN4924 (20 mg kg−1), DBZ (5 μmol kg−1), or MLN4924 (20 mg kg−1) + DBZ (5 μmol kg−1) for 3 wk (n = 10 for each group). P value was estimated with the log-rank test. (D) Changes in body weight, (E) bioluminescence images and (F) quantification of leukemic load of mice in (C). P values were calculated using the unpaired t test. Red lines in the X-axis in (C) and (D) indicate treatment schedule. Individual data are shown in (B) and (F). Data in (D) shows mean ± SD.

References

    1. Inaba H., Greaves M., Mullighan C. G., Acute lymphoblastic leukaemia. Lancet 381, 1943–1955 (2013). - PMC - PubMed
    1. Gianni F., Belver L., Ferrando A., The genetics and mechanisms of T-cell acute lymphoblastic leukemia. Cold Spring Harb. Perspect. Med. 10, (3) (2020). - PMC - PubMed
    1. Stock W., et al. , Dose intensification of daunorubicin and cytarabine during treatment of adult acute lymphoblastic leukemia: Results of Cancer and Leukemia Group B Study 19802. Cancer 119, 90–98 (2013). - PMC - PubMed
    1. Sutton R., et al. , Persistent MRD before and after allogeneic BMT predicts relapse in children with acute lymphoblastic leukaemia. Br. J. Haematol. 168, 395–404 (2015). - PubMed
    1. Weng A. P., et al. , Activating mutations of NOTCH1 in human T cell acute lymphoblastic leukemia. Science 306, 269–271 (2004). - PubMed

MeSH terms

LinkOut - more resources