. 2025 Apr 8;122(14):e2425992122.
doi: 10.1073/pnas.2425992122. Epub 2025 Mar 31.

Single cell-resolved cellular, transcriptional, and epigenetic changes in mouse T cell populations linked to age-associated immune decline

Affiliations

Single cell-resolved cellular, transcriptional, and epigenetic changes in mouse T cell populations linked to age-associated immune decline

Jing He et al. Proc Natl Acad Sci U S A. .

Abstract

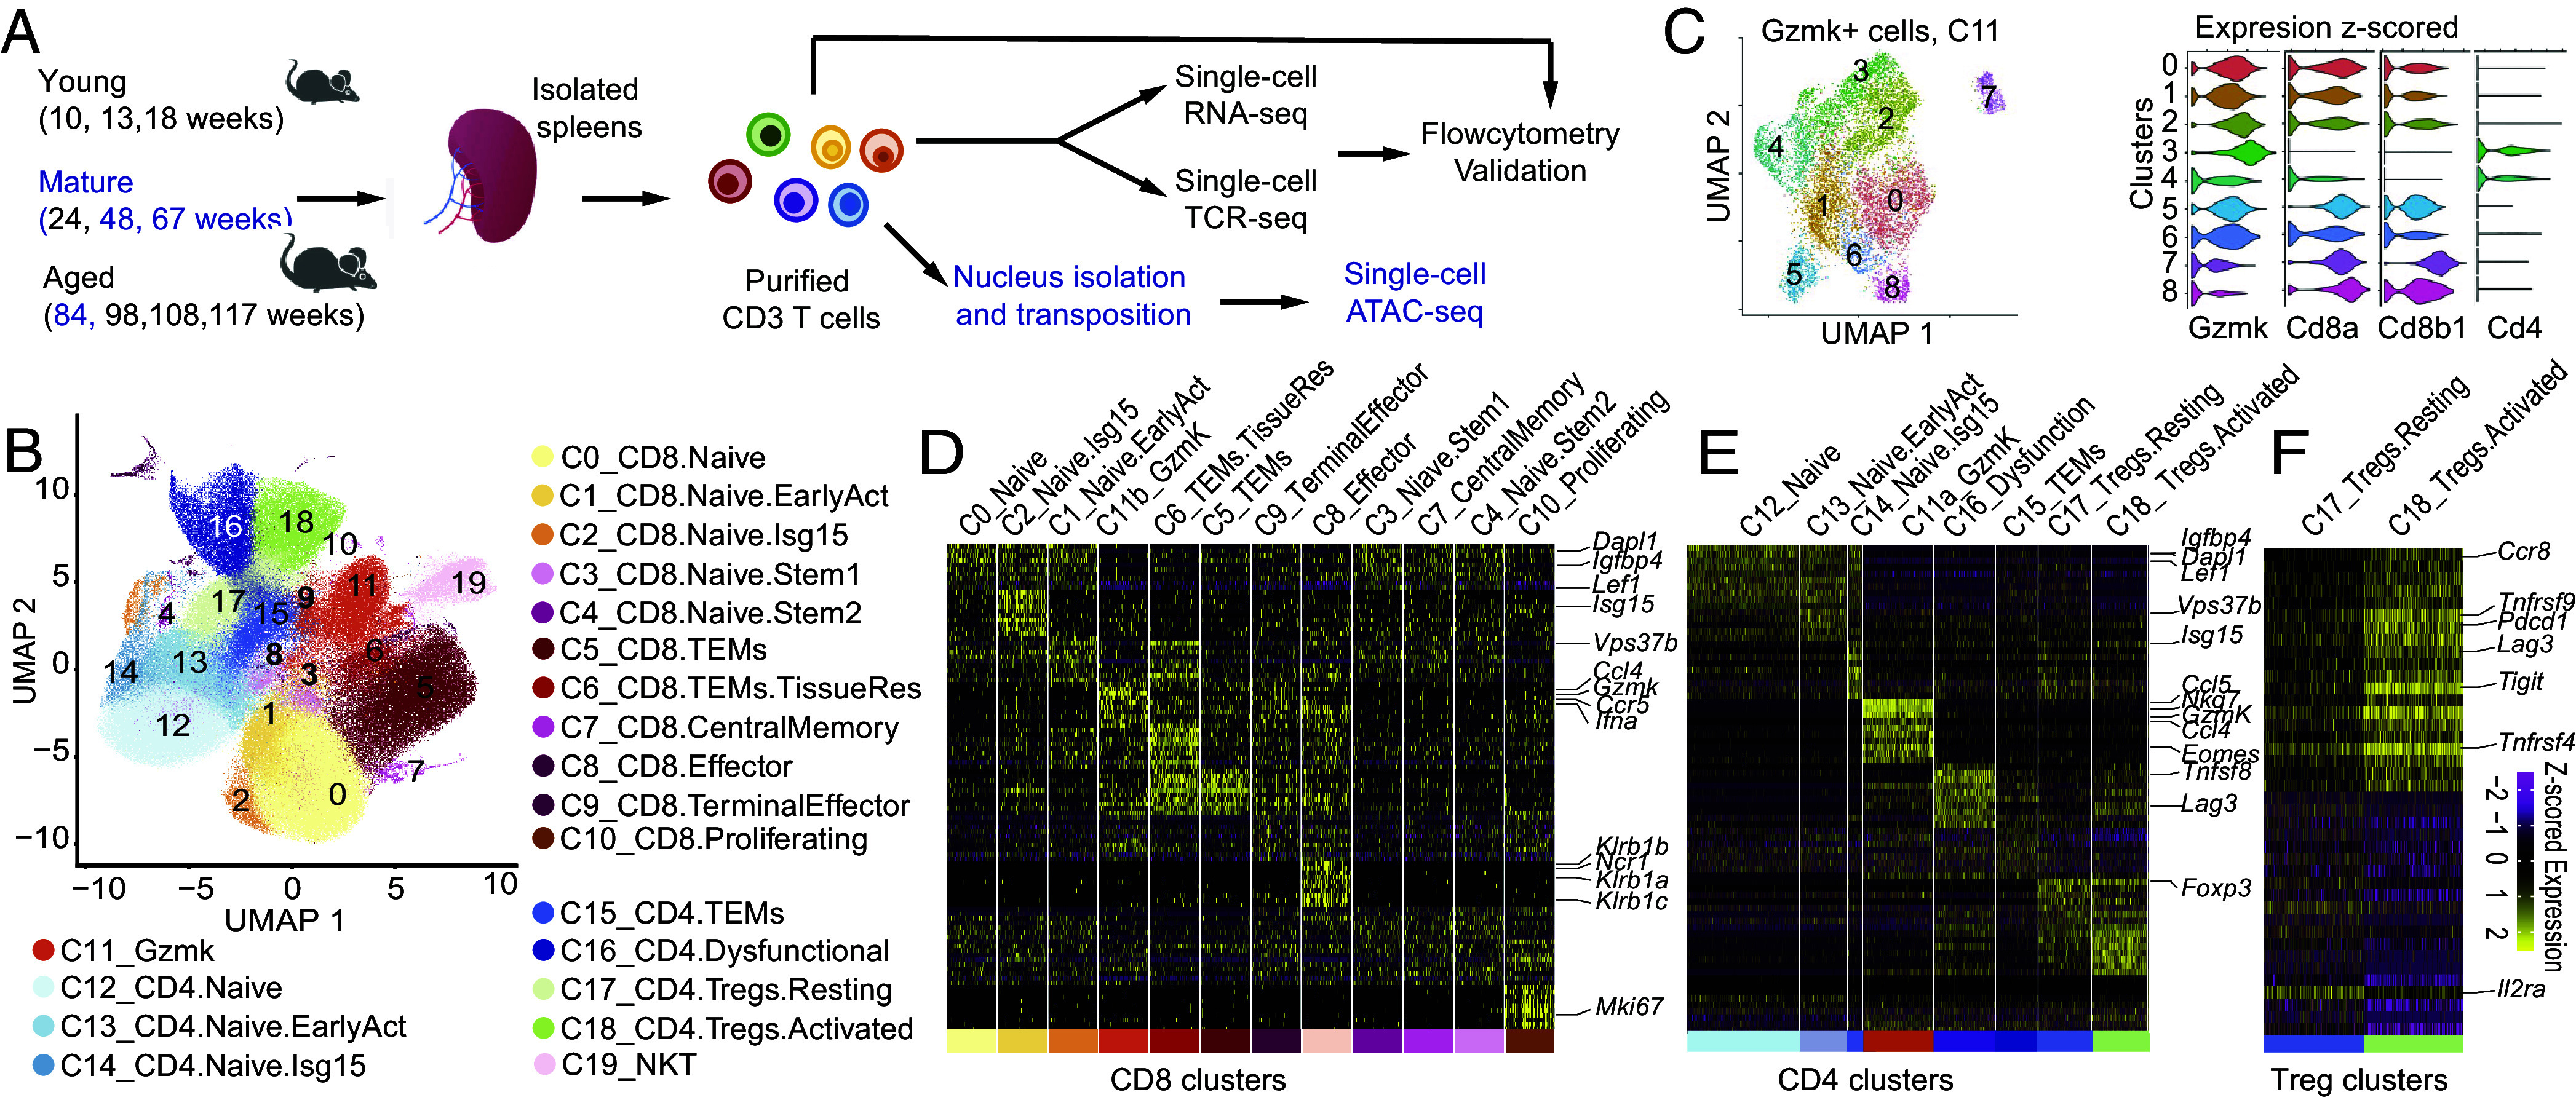
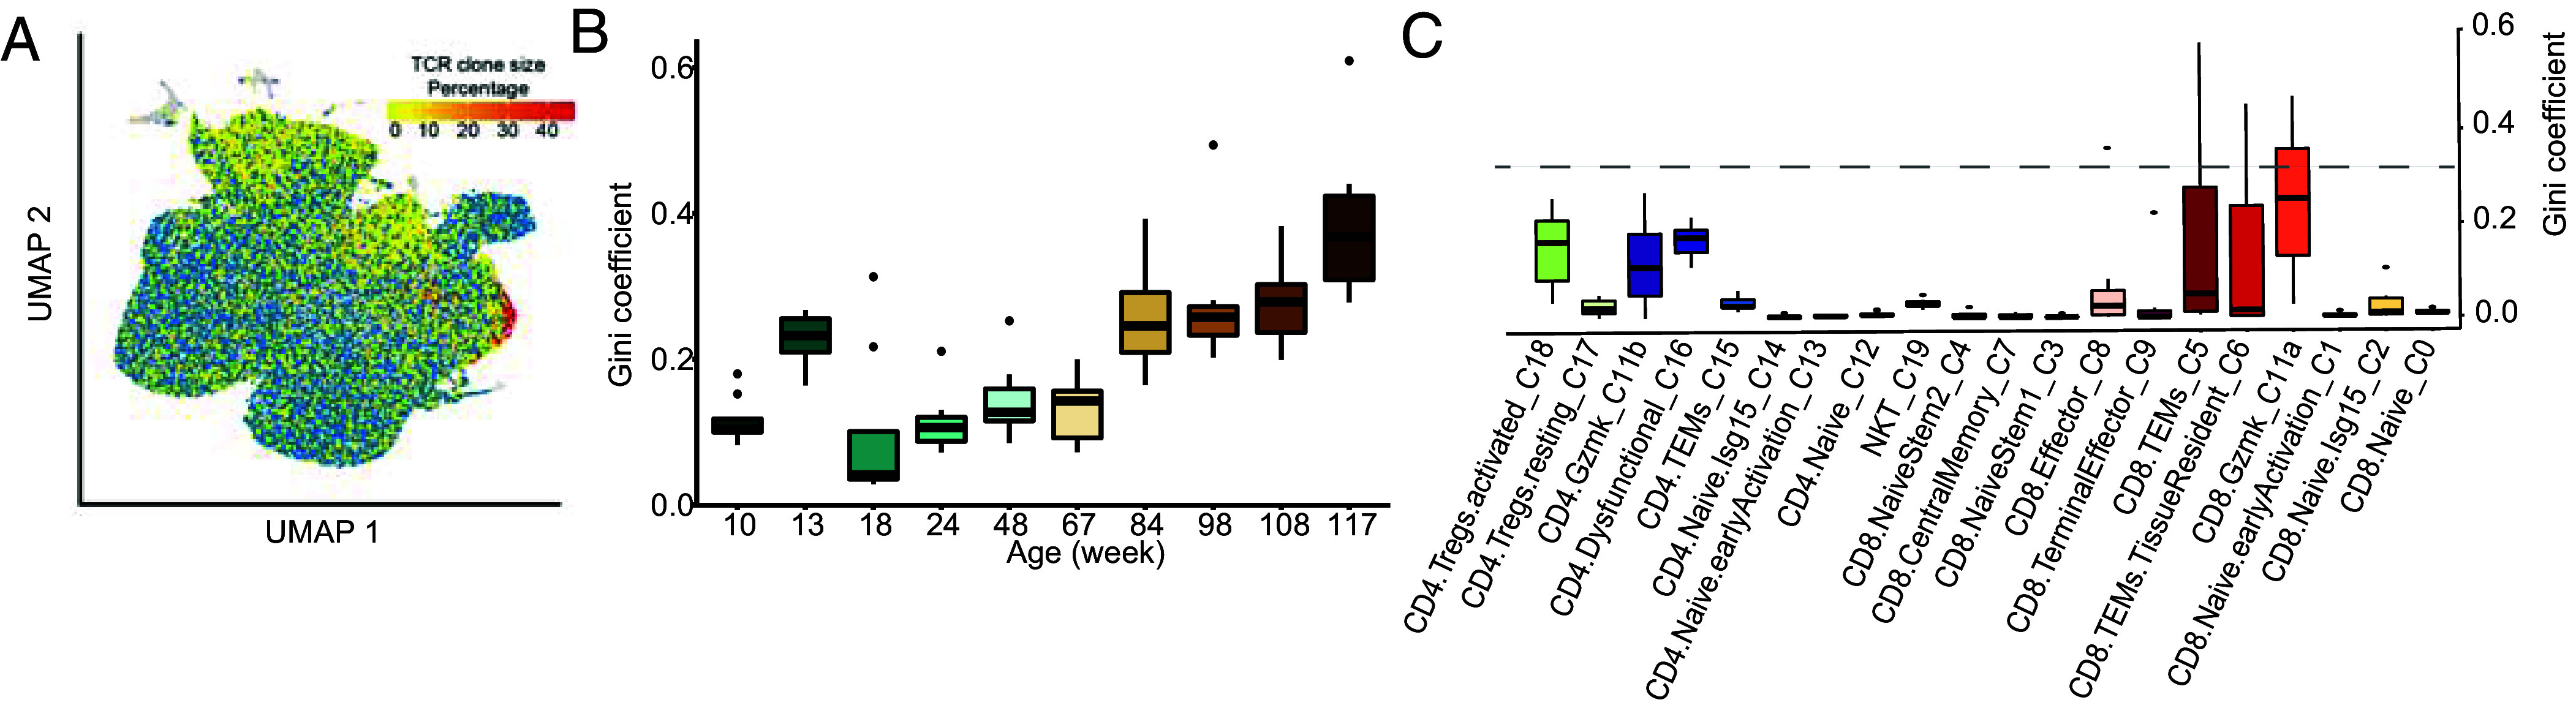
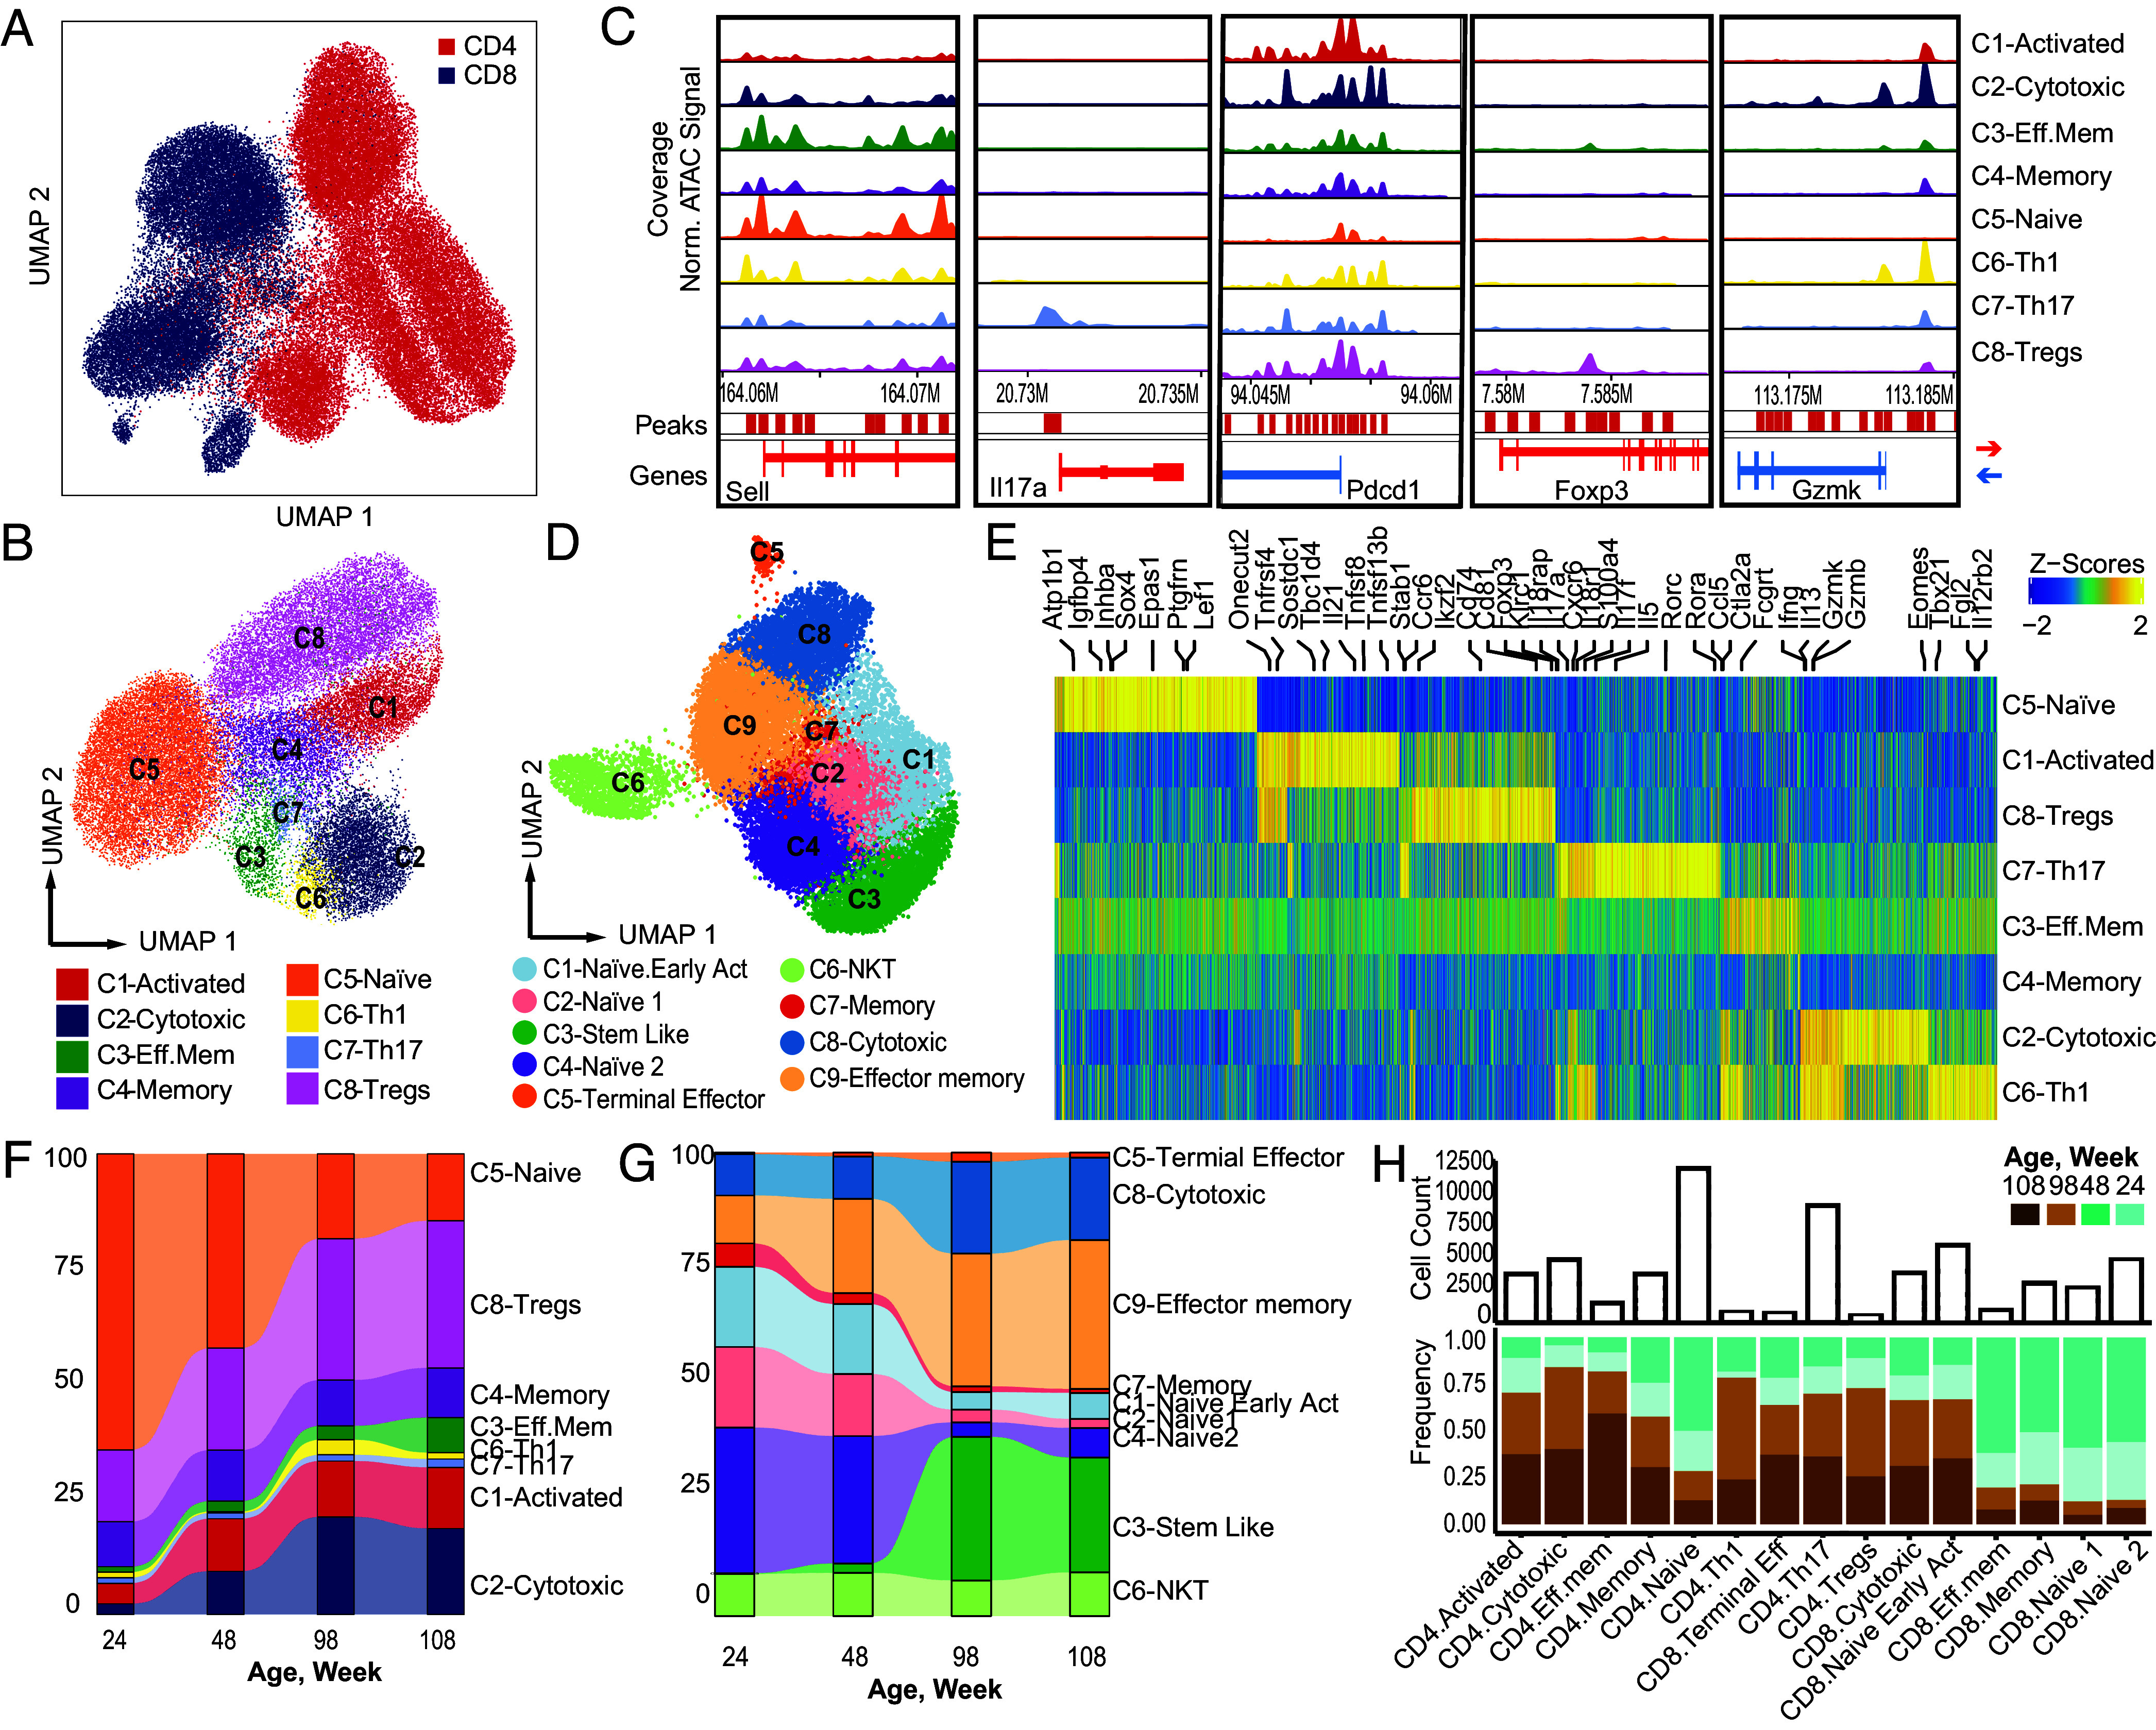
Splenic T cells are pivotal to the immune system, yet their function deteriorates with age. To elucidate the specific aspects of T cell biology affected by aging, we conducted a comprehensive multi-time point single-cell RNA sequencing study, complemented by single-cell Assay for Transposase Accessible Chromatin (ATAC) sequencing and single-cell T cell repertoire (TCR) sequencing on splenic T cells from mice across 10 different age groups. This map of age-related changes in the distribution of T cell lineages and functional states reveals broad changes in T cell function and composition, including a prominent enrichment of Gzmk+ T cells in aged mice, encompassing both CD4+ and CD8+ T cell subsets. Notably, there is a marked decrease in TCR diversity across specific T cell populations in aged mice. We identified key pathways that may underlie the perturbation of T cell functions with aging, supporting cytotoxic T cell clonal expansion with age. This study provides insights into the aging process of splenic T cells and also highlights potential targets for therapeutic intervention to enhance immune function in the elderly. The dataset should serve as a resource for further research into age-related immune dysfunction and for identifying potential therapeutic strategies.

Keywords: T cells; aging; aging gene signature; granzyme K; single-cell RNA.


Conflict of interest statement

Competing interests statement:The authors were all employees of Regeneron Pharmaceuticals when this work was performed. Most hold stock or stock options exceeding $5000 in value.

Figures

Fig. 1.
Fig. 1.
Single-cell transcriptional profiling of aging mouse splenic T cells. (A) Experimental flow chart. Mouse splenocytes were harvested from 10 different age groups. CD3+ T cells were purified. CD3+ T cells were barcoded using 10× platform and profiled by scRNA-seq and scTCR-seq. Flow cytometry was used to evaluate age-associated functional changes. Mouse T cell scATAC-seq was done on 4 age groups. (B) UMAP of 20 annotated CD3+ T cell clusters. (C) Heterogeneity of Gzmk+ cells. (Left) UMAP of Gzmk+ CD3+ T cells (C11), a mixture of CD4+ and CD8+ T cells. (Right) Z-scored expression of marker genes across nine subsets (DF). Heatmaps of marker gene expression z-scores across different populations of (D) CD8+ T, (E) CD4+ T, and (F) CD4+ Tregs cells. (D and E) Genes shown were upregulated significantly [ln(fold change) > 0.4, combined p < 10E−3) in at least one subset compared to all other cells. Genes were ordered by significance and associated with the subset with higher detection rates. (F) Genes shown were upregulated significantly in activated Tregs compared to resting Tregs.
Fig. 2.
Fig. 2.
Age-associated alterations in splenic T cell populations in mice. (A) UMAP projections of CD3+ T cell clusters separated by young, mature, and aged group. (B) Age-related shifts in T cell single-set defined cluster distribution with age. Absolute numbers of each T cell subset as a function of age analyzed out of total sequenced cells in a subset.
Fig. 3.
Fig. 3.
TCR repertoire diversity decreases in aging splenic CD3+ T cells. (A) TCR clones are shown on UMAP projection of all CD3+ T cells isolated from spleens. (B) Paired single-cell TCRα/β repertoire (measured as Gini coefficient) per T cells across different age groups. (C) Low TCR diversity of CD4.Gzmk and CD8.Gzmk and CD8.TEMs cells. Paired single-cell TCR α/β repertoire (measured as Gini coefficient) per T cells across different CD3-positive clusters. Data are mean ± SEM for all mice (n = 83) of all 10 age groups.
Fig. 4.
Fig. 4.
Single-cell analysis of chromatin accessibility associated with age in mouse splenic T cells. (A) scATAC-seq clusters of T cells isolated from the spleen (60,934 cells) from young and aged C57Bl/6J male mice (pool of n = 8 per age group; mice of 24, 48, 84, and 108 wk old). Shown is CD4+ T cell and CD8+ T cell cluster composition. (B) UMAP projection of annotated clusters of CD4+ T cells. (C) Genome tracks of aggregate scATAC-seq data visualization of the locus Sell, Il17a, FoxP3, Pdcd1, Gzmk, clustered as indicated in B. (D) UMAP projection of annotated clusters of CD8+ T cells. Gene activity of selected T cell markers in CD4+ T clusters. Color gradient indicates z-scored gene activity level (yellow represents high; blue represents low). (E) Top peak/gene score per clusters. Scores are column-wise z-scored. Peak score represents chromatin accessibility of a given peak (each row). Gene score (each row) represents the aggregated score of all peaks of a given gene after normalization. (F and G) Representative plots showing the frequencies dynamics of ATAC-seq defined (F) CD4+ and (G) CD8+ cell clusters along aging. (H) Representative plots showing the frequencies and cell count of cells belonging to each of the subsets as defined by scATAC-seq of 24-, 48-, 98-, and 108-wk mice. (H) Representative plots showing the frequencies and cell counts of cells belonging to each of the subsets as defined by scATAC-seq of 24-, 48-, 98-, and 108-wk mice.
Fig. 5.
Fig. 5.
CD4 NaiveT cell subsets fall along a developmental trajectory. (A) Further subclustering of CD4+ T cells reveals three naive cell populations. (B) Cell alignment to the pseudotime developmental trajectory within the naive CD4+ T cell populations. The smoothened arrow represents a visualization of the interpreted trajectory in the UMAP embedding. (C) Pseudotime heatmap ordering of the top 10% most variable chromVAR TF motif bias-corrected deviations in the CD4+ naive T cell trajectory. For BD, n = 11,954 cells. (D) Tcf7 TFBS leaves a “deepest footprint” in a CD4+ naive cluster. Comparison of aggregate footprints for Tcf7 in CD4.naive, CD4.naiveIsgHi, CD4.naive Early Activation for mice of all four age groups. Y-axis values are average normalized reads per motif site, per mouse, at sites that are close with age.
Fig. 6.
Fig. 6.
Single-cell analysis of age-associated Gzmk+ CD4+ T cells and Gzmk+ CD8+ T cells. (A) scRNA-seq clusters of CD3+ T cells from spleens of C57BL/6 mice of 10 age groups (10 to 117 wk, n = 8 to 10 mice per age group). Dotplot of selected genes’ average expression per cluster. (B) Normalized transcription factor enrichment profile for EOMES for all CD4+ T cell clusters in scATAC-seq. (C) Heatmap of transcription factors motifs enrichment scores of the most accessible genes in each scATAC-seq CD4+ T cell cluster. (D) Graphic representation of pathways enriched by differential age-related genes (aging DEG) for Gzmk+ T cell cluster–based pseudobulk across multiple ages (comparing samples from week 48 to week 117 to samples from week 24). Dark squares on the left indicate enrichment of a specific pathway was statistically significant. Each column of circles corresponds to the comparison between 24 wk and the older age. Circle size represents the number of age-related genes enriched to each pathway. The circle color indicates the average fold-change in the expression levels of these genes versus 24 wk, with the deepest red being an increase of ≥ four-fold. Right panels show the aging DEG patterns included in the pathway analysis in Left and Middle panels.

References

    1. Liu Z., et al. , Immunosenescence: Molecular mechanisms and diseases. Signal Transduct. Target. Ther. 8, 200 (2023). - PMC - PubMed
    1. Goronzy J. J., Weyand C. M., Immune aging and autoimmunity. Cell. Mol. Life Sci. 69, 1615 (2012). - PMC - PubMed
    1. Mannick J. B., Lamming D. W., Targeting the biology of aging with mtor inhibitors. Nat. Aging 3, 642–660 (2023). - PMC - PubMed
    1. Panwar V., et al. , Multifaceted role of mtor (mammalian target of rapamycin) signaling pathway in human health and disease. Signal Transduct. Target. Ther. 8, 375 (2023). - PMC - PubMed
    1. Ortega-Molina A., et al. , A mild increase in nutrient signaling to mtorc1 in mice leads to parenchymal damage, myeloid inflammation and shortened lifespan. Nat. Aging 4, 1102–1120 (2024). - PMC - PubMed

Substances

LinkOut - more resources