. 2025 Jun 24;9(12):2935-2952.
doi: 10.1182/bloodadvances.2024015000.

AhR activation mitigates graft-versus-host disease of the central nervous system by reducing microglial NF-κB signaling

Affiliations

AhR activation mitigates graft-versus-host disease of the central nervous system by reducing microglial NF-κB signaling

Alexander Zähringer et al. Blood Adv. .

Abstract

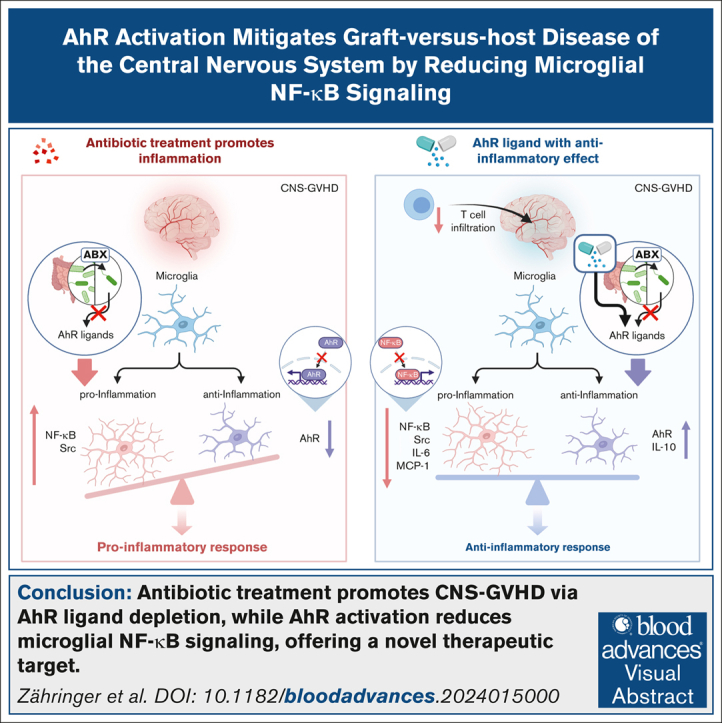
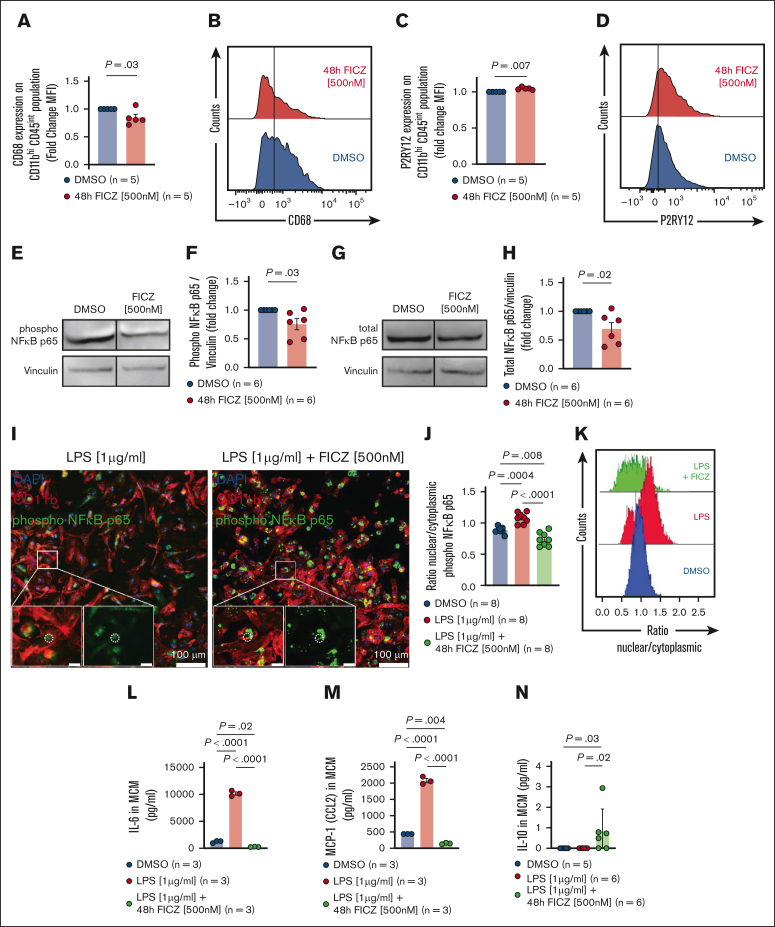
Acute graft-versus-host disease (GVHD) that occurs after allogeneic hematopoietic cell transplantation (allo-HCT) can affect the central nervous system (CNS). Most patients who have undergone allo-HCT receive antibiotic treatment, which alters the microbiome and essential microbiome-derived metabolites. We investigated the impact of microbiome modifications on CNS GVHD and therapeutic strategies to overcome the microbiome-derived metabolite depletion. Antibiotic treatment of mice undergoing allo-HCT increased microglia numbers in the brain, indicating increased inflammation. In addition, microglial morphology shifted toward a highly branched phenotype. Consistent with a proinflammatory phenotype, the microglia exhibited increased NF-κB and Src activity. Antibiotic treatment caused the depletion of the bacteria-derived aryl hydrocarbon receptor (AhR) ligand indole-3-acetate in the brain. Conversely, treatment of the primary microglia with the AhR ligand 6-formylindolo(3,2-b)carbazole (FICZ) reduced NF-κB activity and phagocytic potential. Microglia expansion and morphological changes were reversed by AhR ligand FICZ treatment. Moreover, the AhR ligand indole-3-acetate was also reduced in the CNS of patients who developed acute GVHD concomitant with increased microglial NF-κB expression. In summary, we demonstrated that antibiotic treatment and a subsequent decrease of AhR ligands resulted in increased microglial activation in CNS GVHD. FICZ treatment hampered CNS inflammation by inhibiting NF-κB activity, thereby providing a metabolic modifier to interfere with pathogenic microglia signaling and CNS GVHD in vivo.


Conflict of interest statement

Conflict-of-interest disclosure: R.Z. has received honoraria from Novartis, Incyte, Sanofi, and Mallinckrodt. D.M. received research grants from Novartis and Sanofi, and consulting fees from Novartis, Incyte, Sanofi, CSL Behring, Jazz Pharmaceuticals, and Mallinckrodt. The remaining authors declare no competing financial interests.

Figures

None
Graphical abstract
Figure 1.
Figure 1.
The microglia expand and exhibit highly branched morphology after antibiotic treatment in allo-HCT mice. (A) Schematic overview of the murine GVHD model. BALB/c mice were treated with antibiotics (daily dose of 1 mg metronidazole, 1 mg vancomycin, 1 mg gentamicin, and 1 mg cefoxitin in 200 μL water by oral gavage) or vehicle for 14 days before and 14 days after transplantation. BALB/c mice were lethally irradiated (split-dose 10 Gy) and transplanted with allogeneic or syngeneic BM (5 × 10⁶ cells) and T cells (3 × 10⁵ cells) from C57BL/6 (allo-HCT) or BALB/c (syn-HCT) donor mice. Organs were analyzed on day 14 after transplantation. (B) Representative images showing IF staining for Iba-1 in the cortex of BALB/c mice transplanted with either syngeneic BM and T cells (upper left), T-cell–depleted (TCD) allogeneic BM only (upper right), or allogeneic BM and T cells. Allo-HCT mice were treated with either vehicle (lower left) or antibiotics (lower right). The primary antibody was incubated for 24 hours at 4°C. Goat anti-rabbit immunoglobulin G (IgG; H + L) Alexa Fluor Plus 647 secondary antibody was incubated for 90 minutes at 4°C. Sections were imaged with Zeiss Axio Imager M2m fluorescence microscope with Plan-Apochromat 20×/0.8 M27 objective. Scale bar, 50 μm. (C-D) Scatter dot plots showing numbers of Iba-1+ cells per mm2 cortex (C) and cerebellum (D). BALB/c mice were transplanted with syngeneic BM and T cells, TCD allogeneic BM only, or allogeneic BM and T cells. Allo-HCT mice were treated with either vehicle or antibiotics as indicated. Experiment was performed twice and results were pooled. Dots represent individual mice. Error bars showing mean ± standard error of mean (SEM). P values were calculated using ordinary 1-way analysis of variance (ANOVA). (E) Representative images showing IMARIS-based 3-dimensional (3D) reconstruction of the microglia (upper panel) and IF staining for Iba-1 (red) and DAPI (4′,6-diamidino-2-phenylindole; blue; lower panel) in the cortex of GVHD mice treated with either vehicle (right column) or antibiotics (left column). The primary antibody was incubated for 48 hours at 4°C. Goat anti-rabbit IgG (H + L) Alexa Fluor 568 secondary antibody was incubated for 48 hours at 4°C. Nuclei were stained using DAPI. Sections were imaged with Zeiss LSM710 (Plan-Apochromat 63×/1.4 Oil DIC M27) or Zeiss LSM880 (Plan-Apochromat 63×/1.4 Oil DIC M27) confocal laser scanning microscopes. Scale bar: 5 μm. (F-K) Scatter dot plots showing IMARIS-based semiautomated quantification of the morphological parameter filament dendrite length (F), filament number of terminal points (G), filament number of dendrite branch points (H), filament number of dendrite segments (I), filament dendrite volume (J), and filament dendrite area (K). BALB/c mice were transplanted with allogeneic BM and T cells and treated with vehicle or antibiotics as indicated. Experiment was performed twice and results were pooled. Dots represent individual mice. Error bars showing mean ± SEM. P values were calculated using unpaired t test.
Figure 2.
Figure 2.
Microglia display reactive phenotype upon antibiotic treatment in GVHD mice. (A) Heat map based on RNA sequencing depicts differentially expressed genes involved in TNF-α signaling via NF-κB pathway isolated from the microglia of syn-HCT (n = 4) or allo-HCT mice (n = 4) on day 14. BALB/c mice were transplanted with either syngeneic BM and T cells (syn-HCT) or allogeneic BM and T cells (allo-HCT). z score intensity (upper part) and log2 fold change (FC; lower part). Asterisks (∗) indicate significant changes (adjusted P < .05). (B) Representative images showing IF staining for Iba-1 (green), phospho–NF-κB p65 (red), and DAPI (blue) in the cortex of GVHD mice transplanted with allogeneic BM and T cells and treated with vehicle (upper panel) or antibiotics (lower panel). The primary antibody was incubated for 24 hours at 4°C. Goat anti-rabbit IgG (H + L) Alexa Fluor Plus 647 and goat anti-rat IgG (H + L) Alexa Fluor 488 secondary antibodies were incubated for 90 minutes at 4°C. Nuclei were stained using DAPI. Sections were imaged with Zeiss LSM710 (Plan-Apochromat 63×/1.4 Oil DIC M27) or Zeiss LSM880 (Plan-Apochromat 63×/1.4 Oil DIC M27) confocal laser scanning microscopes. Scale bar, 7 μm. (C) Scatter dot plot showing IMARIS-based quantification (FC mean fluorescence intensity [MFI]) of phospho–NF-κB p65 in the microglia. The quantification was based on a semiautomated 2-dimensional (2D) reconstruction of Iba-1+ cells. GVHD mice were transplanted with allogeneic BM and T cells and treated with vehicle or antibiotics as indicated. Experiment was performed twice and results were pooled. Dots represent individual mice. Error bars showing mean ± SEM. P values were calculated using unpaired t test. (D) Scatter dot plot showing IMARIS-based quantification (FC MFI) of the nuclear phospho–NF-κB p65 expression in the microglia. The quantification was based on a semiautomated 2D reconstruction of Iba-1+ cells and DAPI for nuclei. GVHD mice were transplanted with allogeneic BM and T cells and treated with vehicle or antibiotics as indicated. Experiment was performed twice and results were pooled. Dots represent individual mice. Error bars showing mean ± SEM. P values were calculated using unpaired t test. (E) Representative images showing IF staining for Iba-1 (green), IκBα (red), and DAPI (blue) in the cortex of GVHD mice transplanted with allogeneic BM and T cells and treated with vehicle (upper) or antibiotics (lower). The primary antibody was incubated for 24 hours at 4°C. Goat anti-rabbit IgG (H + L) Alexa Fluor Plus 647 and Goat anti-rat IgG (H + L) Alexa Fluor 488 secondary antibodies were incubated for 90 minutes at 4°C. Nuclei were stained using DAPI. Sections were imaged with Zeiss LSM710 (Plan-Apochromat 63×/1.4 Oil DIC M27) or Zeiss LSM880 (Plan-Apochromat 63×/1.4 Oil DIC M27) confocal laser scanning microscopes. Scale bar, 7 μm. (F) Scatter dot plot showing IMARIS-based quantification (FC MFI) of the expression of IκBα. The quantification was based on a semiautomated 2D reconstruction of Iba-1+ cells. GVHD mice were transplanted with allogeneic BM and T cells and treated with vehicle or antibiotics as indicated. Experiment was performed twice and results were pooled. Dots represent individual mice. Error bars showing mean ± SEM. P values were calculated using unpaired t test. (G) Scatter dot plot showing percentage of IκBα expressing microglia. GVHD mice were transplanted with allogeneic BM and T cells and treated with vehicle or antibiotics as indicated. Dots represent individual mice. Error bars showing mean ± SEM. P values were calculated using unpaired t test. (H) Representative images showing IF staining for Iba-1 (green), phospho-Src (red), and DAPI (blue) in the cortex of GVHD mice transplanted with allogeneic BM and T cells and treated with vehicle (upper) or antibiotics (lower). The primary antibody was incubated for 24 hours at 4°C. Goat anti-rabbit IgG (H + L) Alexa Fluor Plus 647 and goat anti-rat IgG (H + L) Alexa Fluor 488 secondary antibodies were incubated for 90 minutes at 4°C. Nuclei were stained using DAPI. Sections were imaged with Zeiss LSM710 (Plan-Apochromat 63×/1.4 Oil DIC M27) or Zeiss LSM880 (Plan-Apochromat 63×/1.4 Oil DIC M27) confocal laser scanning microscopes. Scale bar, 7 μm. (I) Scatter dot plot showing IMARIS-based quantification (FC MFI) of the phospho-Src expression in the microglia. The quantification was based on a semiautomated 2D reconstruction of Iba-1+ cells. GVHD mice were transplanted with allogeneic BM and T cells and treated with vehicle or antibiotics as indicated. Experiment was performed twice and results were pooled. Dots represent individual mice. Error bars showing mean ± SEM. P values were calculated using unpaired t test. TNF-α, tumor necrosis factor α.
Figure 3.
Figure 3.
Nuclear translocation of AhR is reduced upon antibiotic treatment owing to the depletion of bacterial AhR ligands in the brain. (A) Representative images showing IF staining for indole-3-acetic acid (red, upper), kynurenine (red, lower), and DAPI (blue) in the cortex of mice transplanted with either syngeneic BM and T cells (syn-HCT) or allogeneic BM and T cells (allo-HCT) and treated with vehicle or antibiotics as indicated. The primary antibody was incubated for 24 hours at 4°C. Goat anti-rabbit IgG (H + L) Alexa Fluor Plus 647 or donkey anti-mouse IgG (H + L) Alexa Fluor Plus 647 secondary antibodies were incubated for 90 minutes at 4°C. Nuclei were stained using DAPI. Sections were imaged with Zeiss Axio Imager M2m fluorescence microscope with Plan-Apochromat 20×/0.8 M27 objective. Scale bar, 100 μm. (B) Scatter dot plot showing QuPath-based quantification (MFI) of the abundance of indole-3-acetic acid in the cortex. The MFI was calculated by DAPI-based cell segmentation with 2 μm cytoplasm thickness. Mice were transplanted with either syngeneic BM and T cells (syn-HCT) or allogeneic BM and T cells (allo-HCT) and treated with vehicle or antibiotics as indicated. Experiment was performed twice and results were pooled. Dots represent individual mice. Error bars showing mean ± SEM. P values were calculated using ordinary 1-way ANOVA. (C) Scatter dot plot showing QuPath-based quantification (MFI) of the abundance of kynurenine in the cortex. The MFI was calculated by DAPI-based cell segmentation with 2 μm cytoplasm thickness. Mice were transplanted with either syngeneic BM and T cells (syn-HCT) or allogeneic BM and T cells (allo-HCT) and treated with vehicle or antibiotics as indicated. Experiment was performed twice and results were pooled. Dots represent individual mice. Error bars showing mean ± SEM. P values were calculated using ordinary 1-way ANOVA. (D) Representative images showing IF staining for AhR (red) and DAPI (blue) in the cortex of GVHD mice transplanted with allogeneic BM and T cells and treated with vehicle (left) or antibiotics (right). Antibody was incubated for 24 hours at 4°C. Nuclei were stained using DAPI. Sections were imaged with Zeiss Axio Imager M2m fluorescence microscope with Plan-Apochromat 20×/0.8 M27 objective. Scale bar, 30/10 μm. (E) Scatter dot plot showing quantification of AhR translocation as nuclear-to-cytoplasmic expression ratio in the cortex of GVHD mice that were transplanted with allogeneic BM and T cells and treated with vehicle or antibiotics as indicated. Experiment was performed twice and results were pooled. Dots represent individual mice. Error bars showing mean ± SEM. P values were calculated using unpaired t test. (F) Representative images showing IF staining for Iba-1 (green) and AhR (red) in the cortex of GVHD mice that were transplanted with allogeneic BM and T cells and treated with vehicle (left) or antibiotics (right). White arrows indicating AhR-expressing Iba-1+ cells. The primary antibody was incubated for 24 hours at 4°C. Goat anti-rabbit IgG (H + L) AlexaFluor488 secondary antibody was incubated for 90 minutes at 4°C. Nuclei were stained using DAPI. (G) Scatter dot plot showing the number of AhR-expressing cells in the cortex of GVHD mice that were transplanted with allogeneic BM and T cells and treated with vehicle or antibiotics as indicated. Experiment was performed twice and results were pooled. Dots represent individual mice. Error bars showing mean ± SEM. P values were calculated using unpaired t test.
Figure 4.
Figure 4.
FICZ reduces microglial activation in vitro by inhibiting NF-κB/MAPK signaling. (A) Scatter dot plot showing fluorescence-activated cell sorting (FACS)–based quantification of CD68 expression in the primary microglia treated with DMSO or 500 nM FICZ for 48 hours as indicated. Experiment was performed twice and results were pooled. Dots represent independent biological replicates. Error bars showing mean ± SEM. P value was calculated using unpaired t test. (B) Representative histogram for the data shown in panel A. (C) Scatter dot plot showing FACS-based quantification of P2RY12 expression in the primary microglia treated with DMSO or 500 nM FICZ for 48 hours as indicated. Experiment was performed twice and results were pooled. Dots represent independent biological replicates. Error bars showing mean ± SEM. P value was calculated using unpaired t test. (D) Representative histogram for the data shown in panel C. (E-H) Representative western blots showing the expression of phospho–NF-κB p65 (E) and total NF-κB p65 (G) isolated from the primary microglia that were treated with DMSO or 500 nM FICZ for 48 hours as indicated. Scatter dot plots showing quantification (FC, normalized to vinculin) of phospho–NF-κB p65 (F) and total NF-κB p65 (H) protein isolated from the primary microglia treated with DMSO or 500 nM FICZ for 48 hours as indicated. Experiment was performed twice and results were pooled. Dots represent independent biological replicates. Error bars showing mean ± SEM. P values were calculated using unpaired t test. (I) Representative IF images depicting phospho–NF-κB p65 (green), CD11b (red), and DAPI (blue) derived from the primary microglia treated with either 1 μg/mL LPS or 500 nM FICZ for 48 hours + 1 μg/mL LPS as indicated. Primary antibodies and goat anti-rabbit IgG (H + L) Alexa Fluor 488 and anti-CD11b Alexa Fluor 647 antibodies were incubated for 1 hour at room temperature. Nuclei were stained using DAPI and high-content screening/image cytometry was performed using Olympus ScanR microscope (UPLSAPO 20×/0.75). Dotted circle, nucleus; scale bar, 100 μm. (J) Scatter dot plot showing quantification of the translocation of phospho–NF-κB p65 in the primary microglia treated with DMSO, 1 μg/mL LPS, or 500 nM FICZ for 48 hours + 1 μg/mL LPS as indicated. Quantification was done using Olympus ScanR analysis software 3.4.1. Cells were segmented using DAPI and CD11b, nuclei were defined by DAPI, and cytoplasm was defined by CD11b. Experiment was performed twice and results were pooled. Dots represent independent biological replicates. Error bars showing mean ± SEM. P values were calculated using ordinary 1-way ANOVA. (K) Representative histograms showing the quantification of nuclear translocation for phospho–NF-κB p65 in the primary microglia treated with DMSO, 1 μg/mL LPS, or 500 nM FICZ for 48 hours + 1 μg/mL LPS as indicated. (L-N) Scatter dot plots showing concentration (picograms per milliliter) of IL-6 (L), MCP-1 (M), and IL-10 (N) from the supernatant (MCM) of the primary microglia that were treated with DMSO, 1 μg/mL LPS, or 500 nM FICZ for 48 hours + 1 μg/mL LPS as indicated. Concentrations were determined by cytometric bead array. Dots represent independent biological replicates. Error bars showing mean ± SEM. P values were calculated using ordinary 1-way ANOVA. (O) Representative images indicating pHrodo intake (red) of the primary microglia treated with DMSO (left) or 500 nM FICZ for 48 hours (right) after 0 minute (upper) and 195 minutes (lower) as indicated. Nuclei stained with Hoechst 33342 (blue). High-content screening/image cytometry with live cell imaging was performed using Olympus ScanR microscope (UPLSAPO 20×/0.75). Scale bar, 100 μm. (P) Line diagram showing quantification (FC total intensity) of pHrodo intake of the primary microglia treated with DMSO or 500 nM FICZ for 48 hours as indicated. Analysis was done using the Olympus ScanR system and software 3.4.1. Cells were detected by an artificial intelligence–based approach. Experiment was performed twice and results were pooled. Dots represent independent biological replicates. Error bars showing mean ± SEM. P value was calculated using nonlinear fit. (Q-R) Scatter dot plots showing quantification of migration distance (Q) and mean migration speed (R) of the primary microglia during pHrodo intake. The cells were treated with DMSO or 500 nM FICZ for 48 hours as indicated. Analysis was done using the Olympus ScanR system and software 3.4.1. Cells were detected by an artificial intelligence–based approach. Experiment was performed twice and results were pooled. Dots represent independent biological replicates. Error bars showing mean ± SEM. P value was calculated using unpaired t test. MCM, microglia-conditioned medium.
Figure 4.
Figure 4.
FICZ reduces microglial activation in vitro by inhibiting NF-κB/MAPK signaling. (A) Scatter dot plot showing fluorescence-activated cell sorting (FACS)–based quantification of CD68 expression in the primary microglia treated with DMSO or 500 nM FICZ for 48 hours as indicated. Experiment was performed twice and results were pooled. Dots represent independent biological replicates. Error bars showing mean ± SEM. P value was calculated using unpaired t test. (B) Representative histogram for the data shown in panel A. (C) Scatter dot plot showing FACS-based quantification of P2RY12 expression in the primary microglia treated with DMSO or 500 nM FICZ for 48 hours as indicated. Experiment was performed twice and results were pooled. Dots represent independent biological replicates. Error bars showing mean ± SEM. P value was calculated using unpaired t test. (D) Representative histogram for the data shown in panel C. (E-H) Representative western blots showing the expression of phospho–NF-κB p65 (E) and total NF-κB p65 (G) isolated from the primary microglia that were treated with DMSO or 500 nM FICZ for 48 hours as indicated. Scatter dot plots showing quantification (FC, normalized to vinculin) of phospho–NF-κB p65 (F) and total NF-κB p65 (H) protein isolated from the primary microglia treated with DMSO or 500 nM FICZ for 48 hours as indicated. Experiment was performed twice and results were pooled. Dots represent independent biological replicates. Error bars showing mean ± SEM. P values were calculated using unpaired t test. (I) Representative IF images depicting phospho–NF-κB p65 (green), CD11b (red), and DAPI (blue) derived from the primary microglia treated with either 1 μg/mL LPS or 500 nM FICZ for 48 hours + 1 μg/mL LPS as indicated. Primary antibodies and goat anti-rabbit IgG (H + L) Alexa Fluor 488 and anti-CD11b Alexa Fluor 647 antibodies were incubated for 1 hour at room temperature. Nuclei were stained using DAPI and high-content screening/image cytometry was performed using Olympus ScanR microscope (UPLSAPO 20×/0.75). Dotted circle, nucleus; scale bar, 100 μm. (J) Scatter dot plot showing quantification of the translocation of phospho–NF-κB p65 in the primary microglia treated with DMSO, 1 μg/mL LPS, or 500 nM FICZ for 48 hours + 1 μg/mL LPS as indicated. Quantification was done using Olympus ScanR analysis software 3.4.1. Cells were segmented using DAPI and CD11b, nuclei were defined by DAPI, and cytoplasm was defined by CD11b. Experiment was performed twice and results were pooled. Dots represent independent biological replicates. Error bars showing mean ± SEM. P values were calculated using ordinary 1-way ANOVA. (K) Representative histograms showing the quantification of nuclear translocation for phospho–NF-κB p65 in the primary microglia treated with DMSO, 1 μg/mL LPS, or 500 nM FICZ for 48 hours + 1 μg/mL LPS as indicated. (L-N) Scatter dot plots showing concentration (picograms per milliliter) of IL-6 (L), MCP-1 (M), and IL-10 (N) from the supernatant (MCM) of the primary microglia that were treated with DMSO, 1 μg/mL LPS, or 500 nM FICZ for 48 hours + 1 μg/mL LPS as indicated. Concentrations were determined by cytometric bead array. Dots represent independent biological replicates. Error bars showing mean ± SEM. P values were calculated using ordinary 1-way ANOVA. (O) Representative images indicating pHrodo intake (red) of the primary microglia treated with DMSO (left) or 500 nM FICZ for 48 hours (right) after 0 minute (upper) and 195 minutes (lower) as indicated. Nuclei stained with Hoechst 33342 (blue). High-content screening/image cytometry with live cell imaging was performed using Olympus ScanR microscope (UPLSAPO 20×/0.75). Scale bar, 100 μm. (P) Line diagram showing quantification (FC total intensity) of pHrodo intake of the primary microglia treated with DMSO or 500 nM FICZ for 48 hours as indicated. Analysis was done using the Olympus ScanR system and software 3.4.1. Cells were detected by an artificial intelligence–based approach. Experiment was performed twice and results were pooled. Dots represent independent biological replicates. Error bars showing mean ± SEM. P value was calculated using nonlinear fit. (Q-R) Scatter dot plots showing quantification of migration distance (Q) and mean migration speed (R) of the primary microglia during pHrodo intake. The cells were treated with DMSO or 500 nM FICZ for 48 hours as indicated. Analysis was done using the Olympus ScanR system and software 3.4.1. Cells were detected by an artificial intelligence–based approach. Experiment was performed twice and results were pooled. Dots represent independent biological replicates. Error bars showing mean ± SEM. P value was calculated using unpaired t test. MCM, microglia-conditioned medium.
Figure 5.
Figure 5.
AhR ligand FICZ treatment reverses microglia expansion, T-cell infiltration, and morphological changes of the microglia in GVHD mice. (A) Schematic overview of the murine model. BALB/c mice were treated with antibiotics and either vehicle or FICZ (200 μg/kg body weight FICZ [MedChemExpress, catalog no. HY-12451] in 5% DMSO + 40% polyethylene glycol (PEG) 300 + 5% Tween 80 + 50% phosphate-buffered saline) for 14 days before and 14 days after transplantation. BALB/c mice were lethally irradiated and transplanted with allo-BM (5 × 10⁶ cells) and T cells (3 × 10⁵ cells) from C57BL/6 donor mice. Organs were analyzed on day 14 after transplantation. (B) Representative images showing immunohistochemistry staining for CD3 in meninges of GVHD mice transplanted with allogeneic BM and T cells and treated with antibiotics + vehicle (left) or antibiotics + FICZ (right). Sections were imaged with Zeiss Axio Imager M2m fluorescence microscope with Plan-Apochromat 20×/0.8 M27 objective. Scale bar, 50 μm. (C-D) Scatter dot plots showing numbers of CD3+ cells per mm2 meninges (C) and cortex (D) of GVHD mice transplanted with allogeneic BM and T cells and treated with antibiotics + vehicle or antibiotics + FICZ as indicated. Experiment was performed twice and results were pooled. Dots represent individual mice. Error bars showing mean ± SEM. P values were calculated using unpaired t test. (E) Representative images showing IF staining for Iba-1 in the cortex of GVHD mice transplanted with allogeneic BM and T cells and treated with either antibiotics + vehicle (left) or antibiotics + FICZ (right). The primary antibody was incubated for 24 hours at 4°C. Goat anti-rabbit IgG (H + L) Alexa Fluor Plus 647 secondary antibody was incubated for 90 minutes at 4°C. Nuclei were stained using DAPI. Sections were imaged with Zeiss Axio Imager M2m fluorescence microscope with Plan-Apochromat 20×/0.8 M27 objective. Scale bar, 50 μm. (F-G) Scatter dot plots showing numbers of Iba-1+ cells per mm2 in the cortex (F) and cerebellum (G) of GVHD mice transplanted with allogeneic BM and T cells and treated with antibiotics + vehicle or antibiotics + FICZ as indicated. Experiment was performed twice and results were pooled. Dots represent individual mice. Error bars showing mean ± SEM. P values were calculated using unpaired t test. (H) Representative images showing IF staining for VCAM1 (red) and DAPI (blue) in the cortex of GVHD mice transplanted with allogeneic BM and T cells and treated with antibiotics + vehicle (left) or antibiotics + FICZ (right). The primary antibody was incubated for 24 hours at 4°C. Goat anti-rabbit IgG (H + L) Alexa Fluor Plus 647 secondary antibody was incubated for 90 minutes at 4°C. Nuclei were stained using DAPI. Sections were imaged with Zeiss LSM710 (Plan-Apochromat 63×/1.4 Oil DIC M27) or Zeiss LSM880 (Plan-Apochromat 63×/1.4 Oil DIC M27) confocal laser scanning microscopes. Scale bar, 10 μm. (I) Scatter dot plot showing quantification (area per 20× HPF) of VCAM1 expression in the cortex of GVHD mice transplanted with allogeneic BM and T cells and treated with antibiotics + vehicle or antibiotics + FICZ as indicated. Experiment was performed twice and results were pooled. Dots represent individual mice. Error bars showing mean ± SEM. P values were calculated using unpaired t test. (J) Representative images showing IMARIS-based 3D reconstruction of the microglia (upper) and IF staining for Iba-1 (red) and DAPI (blue; lower) in the cortex of GVHD mice transplanted with allogeneic BM and T cells and treated with antibiotics + vehicle (left) or antibiotics + FICZ (right). The primary antibody was incubated for 48 hours at 4°C. Goat anti-rabbit IgG (H + L) Alexa Fluor 568 secondary antibody was incubated for 48 hours at 4°C. Nuclei were stained using DAPI. Sections were imaged with Zeiss LSM710 (Plan-Apochromat 63×/1.4 Oil DIC M27) or Zeiss LSM880 (Plan-Apochromat 63×/1.4 Oil DIC M27) confocal laser scanning microscopes. Scale bar, 5 μm. (K-P) Scatter dot plots showing IMARIS-based semiautomated quantification of the morphological parameters including filament dendrite length (K), filament number of terminal points (L), filament number of dendrite branch points (M), filament number of dendrite segments (N), filament dendrite volume (O), and filament dendrite area (P). GVHD mice were transplanted with allogeneic BM and T cells and treated with antibiotics + vehicle or antibiotics + FICZ as indicated. Experiment was performed twice and results were pooled. Dots represent individual mice. Error bars showing mean ± SEM. P values were calculated using unpaired t test. HPF, high power field.
Figure 6.
Figure 6.
FICZ rescues activation of the microglia upon antibiotic treatment in vivo and improves cognitive function and GVHD without impairing the antitumor efficacies. (A) Representative images showing IF staining for Iba-1 (green), phospho–NF-κB p65 (red), and DAPI (blue) in the cortex of GVHD mice transplanted with allogeneic BM and T cells and treated with antibiotics + vehicle (upper) or antibiotics + FICZ (lower). The primary antibody was incubated for 24 hours at 4°C. Goat anti-rabbit IgG (H + L) Alexa Fluor Plus 647 and goat anti-rat IgG (H + L) Alexa Fluor 488 secondary antibodies were incubated for 90 minutes at 4°C. Nuclei were stained using DAPI. Sections were imaged with Zeiss LSM710 (Plan-Apochromat 63×/1.4 Oil DIC M27) or Zeiss LSM880 (Plan-Apochromat 63×/1.4 Oil DIC M27) confocal laser scanning microscopes. Scale bar, 7 μm. (B) Scatter dot plot showing IMARIS-based quantification (FC MFI) of phospho–NF-κB p65 expression in the microglia. The quantification was based on a semiautomated 2D reconstruction of Iba-1+ cells. GVHD mice were transplanted with allogeneic BM and T cells and treated with either antibiotics + vehicle or antibiotics + FICZ as indicated. Experiment was performed twice and results were pooled. Dots represent individual mice. Error bars showing mean ± SEM. P values were calculated using unpaired t test. (C) Scatter dot plot showing IMARIS-based quantification (FC MFI) of phospho–NF-κB p65 nuclear expression in the microglia. The quantification was based on a semiautomated 2D reconstruction of Iba-1+ cells and DAPI for nuclei. GVHD mice were transplanted with allogeneic BM and T cells and treated with vehicle or antibiotics as indicated. Experiment was performed twice and results were pooled. Dots represent individual mice. Error bars showing mean ± SEM. P values were calculated using unpaired t test. (D) Representative images showing IF staining for Iba-1 (green), phospho-Src (red), and DAPI (blue) in the cortex of GVHD mice transplanted with allogeneic BM and T cells and treated with antibiotics + vehicle (upper) or antibiotics + FICZ (lower). The primary antibody was incubated for 24 hours at 4°C. Goat anti-rabbit IgG (H + L) Alexa Fluor Plus 647 and goat anti-rat IgG (H + L) Alexa Fluor 488 secondary antibodies were incubated for 90 minutes at 4°C. Nuclei were stained using DAPI. Sections were imaged with Zeiss LSM710 (Plan-Apochromat 63×/1.4 Oil DIC M27) or Zeiss LSM880 (Plan-Apochromat 63×/1.4 Oil DIC M27) confocal laser scanning microscopes. Scale bar, 7 μm. (E) Scatter dot plot showing IMARIS-based quantification (FC MFI) of phospho-Src expression in the microglia. The quantification was based on a semiautomated 2D reconstruction of Iba-1+ cells. GVHD mice were transplanted with allogeneic BM and T cells and treated with antibiotics + vehicle or antibiotics + FICZ as indicated. Experiment was performed twice and results were pooled. Dots represent individual mice. Error bars showing mean ± SEM. P values were calculated using unpaired t test. (F) Schematic overview of the murine model. C57BL/6 mice were treated with either vehicle or antibiotics and additionally with either vehicle (for FICZ) or FICZ for 14 days before and 14 days after transplantation. C57BL/6 mice were lethally irradiated and transplanted with allo-BM (5 × 10⁶ cells) and T cells (5 × 10⁵ cells) from BALB/c donor mice or did not receive a transplant (naïve). Behavior studies were performed on day 14 after transplantation. (G) Scatter dot plot showing the number of entries into open arm (%) made by naïve (nontransplanted) mice treated with antibiotics or vehicle and GVHD mice transplanted with allo-BM and T cells and treated with antibiotics as indicated in the elevated plus maze test. Experiment was performed twice and results were pooled. Dots represent individual mice. Error bars showing mean ± SEM. P value was calculated using ordinary 1-way ANOVA. (H) Scatter dot plot showing the number of entries into open arm (%) made by GVHD mice transplanted with allo-BM and T cells and treated with antibiotics + vehicle or antibiotics + FICZ as indicated in the elevated plus maze test. Experiment was performed twice and results were pooled. Dots represent individual mice. Error bars showing mean ± SEM. P value was calculated using unpaired t test. (I) Schematic overview of the murine model. BALB/c mice were treated with antibiotics and either vehicle or FICZ for 14 days before and 14 days after transplantation. BALB/c mice were lethally irradiated and transplanted with allogeneic BM (5 × 10⁶ cells) and T cells (3 × 10⁵ cells) from C57BL/6 donor mice. Organs were analyzed on day 14 after transplantation. (J-L) Scatter dot plots showing GVHD pathology scores in the colon (J), small intestine (K), and liver (L) of GVHD mice transplanted with allogeneic BM and T cells and treated with antibiotics + vehicle or antibiotics + FICZ as indicated. Experiment was performed twice and results were pooled. Dots represent individual mice. Error bars showing mean ± SEM. P values were calculated using unpaired t test. (M) Schematic overview of the murine model. C57BL/6 mice were treated with either antibiotics or vehicle and additionally with either vehicle or FICZ for 14 days before and 14 days after transplantation. C57BL/6 mice were lethally irradiated and transplanted with allogeneic BM (5 × 10⁶ cells, BALB/c) and FLT3-ITD-MLL-PTD (acute myeloid leukemia [AML]) cells (5000 cells) from C57BL/6 background. On day 2, 5 × 10⁵ T cells were injected into allogeneic BALB/c donor mice. (N) Survival rates of C57BL/6 mice transplanted with AML (FLT3-ITD/MLL-PTD) cells and BALB/c (wild-type) BM and allogeneic T cells or no T cells. Mice were treated with antibiotics + vehicle, antibiotics + FICZ, or vehicle (no antibiotics) + vehicle as indicated. Experiment was performed twice and results were pooled. Tc, T cells.
Figure 7.
Figure 7.
Indole-3-acetic acid is reduced in the blood and brain of patients with aGVHD. (A) Violin plots showing the abundance of different AhR ligands in blood samples of patients developing GVHD and patients without GHVD. (B) Heat map showing the column-scaled log abundance of different AhR ligands in blood samples of patients developing GVHD (red) and patients without GHVD (blue). (C) Scatterplot showing the correlation between indole-3-acetate concentration in blood samples and GVHD score of patients developing GVHD. Black line depicts the mean of a linear regression model with shaded areas indicating the 95% confidence interval. (D) Scatterplot showing the correlation between methyl indole-3-acetate concentration in blood samples and GVHD score of patients developing GVHD. Black line depicts the mean of a linear regression model with shaded areas indicating the 95% confidence interval. (E) Representative images showing IF staining for indole-3-acetic acid (red) and DAPI (blue) in the cortex of control patients (left), patients who had undergone allo-HCT without GVHD (middle), and patients who had received allo-HCT with GVHD (right). The primary antibody was incubated for 24 hours at 4°C. Goat anti-rabbit IgG (H + L) Alexa Fluor Plus647 secondary antibody was incubated for 90 minutes at 4°C. Nuclei were stained using DAPI. Sections were imaged with Zeiss Axio Imager M2m fluorescence microscope with Plan-Apochromat 20×/0.8 M27 objective. Scale bar, 100 μm. (F) Scatter dot plot showing quantification of the abundance of indole-3-acetic acid in human cortex of control patients, patients who had received allo-HCT without GVHD, and patients who had received allo-HCT with GVHD, as expressed MFI. Error bars showing mean ± SEM. P values were calculated using ordinary 1-way ANOVA. (G) Representative images showing IF staining for Iba-1 (green), phospho–NF-κB p65 (red), and DAPI (blue) in the cortex of control patients (left), patients who had received allo-HCT without GVHD (middle), and patients who had undergone allo-HCT with GVHD (right). The primary antibody was incubated for 24 hours at 4°C. Goat anti-rabbit IgG (H + L) Alexa Fluor Plus 647 and goat anti-rat IgG (H + L) Alexa Fluor 488 secondary antibodies were incubated for 90 minutes at 4°C. Nuclei were stained using DAPI. Sections were imaged with Zeiss LSM710 (Plan-Apochromat 63×/1.4 Oil DIC M27) or Zeiss LSM880 (Plan-Apochromat 63×/1.4 Oil DIC M27) confocal laser scanning microscopes. Scale bar, 10 μm. (H) Scatter dot plot showing quantification of the expression of phospho–NF-κB p65 in the cortical microglia of control patients, patients who had received allo-HCT without GVHD, and patients who had undergone allo-HCT with GVHD, as expressed FC MFI. Error bars showing mean ± SEM. P values were calculated using ordinary 1-way ANOVA. AUC, area under the curve; Max, maximum.

References

    1. Cusatis R, Litovich C, Feng Z, et al. Current trends and outcomes in cellular therapy activity in the United States, including prospective patient-reported outcomes data collection in the Center for International Blood and Marrow Transplant Research registry. Transpl Cell Ther. 2024;30(9):917.e1–917.e12. - PMC - PubMed
    1. Zeiser R, Blazar BR. Acute graft-versus-host disease — biologic process, prevention, and therapy. N Engl J Med. 2017;377(22):2167–2179. - PMC - PubMed
    1. Zeiser R, Teshima T. Nonclassical manifestations of acute GVHD. Blood. 2021;138(22):2165–2172. - PubMed
    1. Hartrampf S, Dudakov JA, Johnson LK, et al. The central nervous system is a target of acute graft versus host disease in mice. Blood. 2013;121(10):1906–1910. - PMC - PubMed
    1. Unger ER, Sung JH, Manivel JC, Chenggis ML, Blazar BR, Krivit W. Male donor-derived cells in the brains of female sex-mismatched bone marrow transplant recipients: a Y-chromosome specific in situ hybridization study. J Neuropathol Exp Neurol. 1993;52(5):460–470. - PubMed

MeSH terms