. 2025 Apr 1;16(1):229.
doi: 10.1038/s41419-025-07557-5.

Immune evasion mechanisms in early-stage I high-grade serous ovarian carcinoma: insights into regulatory T cell dynamics

Affiliations

Immune evasion mechanisms in early-stage I high-grade serous ovarian carcinoma: insights into regulatory T cell dynamics

Joanna Mikulak et al. Cell Death Dis. .

Erratum in

Abstract

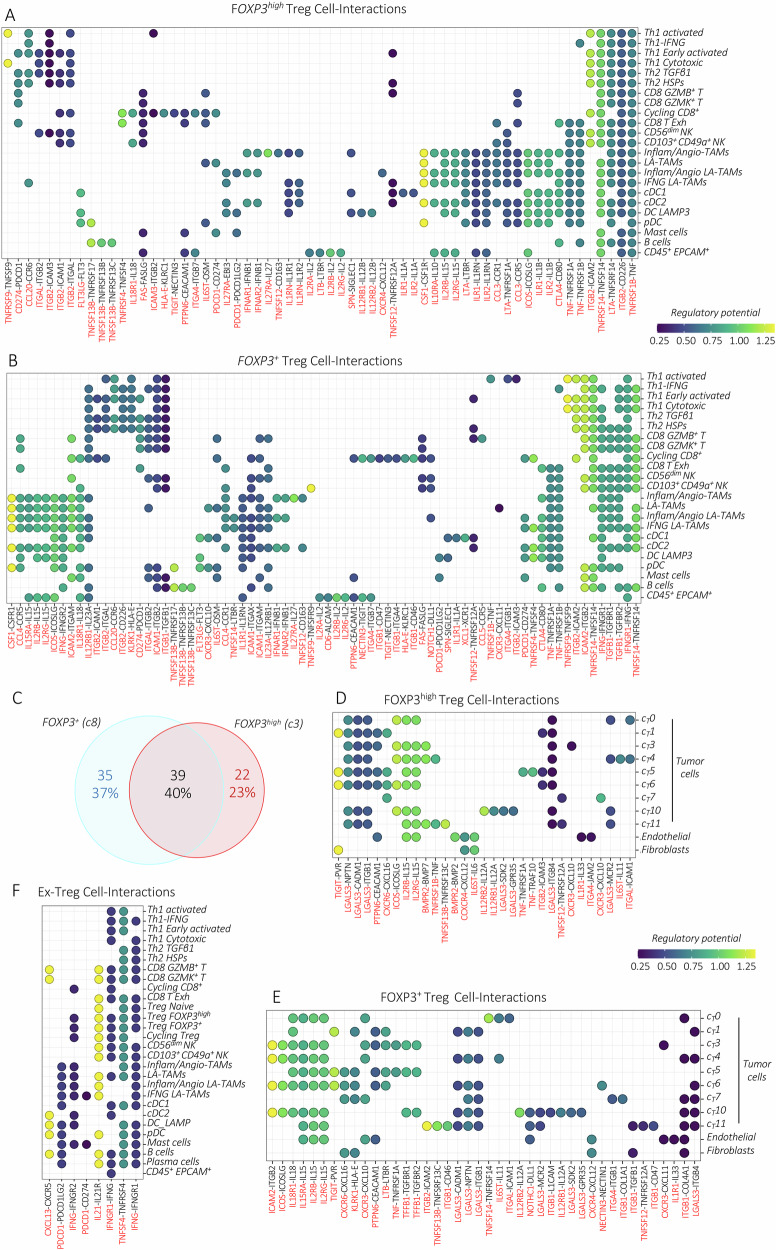
The mechanisms driving immune evasion in early-stage I high-grade serous ovarian carcinoma (HGSOC) remain poorly understood. To investigate this, we performed single-cell RNA-sequencing analysis. Our findings revealed a highly immunosuppressive HGSOC microenvironment, characterized by abundant infiltration of regulatory T cells (Tregs). Trajectory analysis uncovered differentiation pathways of naïve Tregs, which underwent either activation and proliferation or transcriptional instability. The predicted Treg-cell interaction network, including crosstalk within tumor cells, facilitates Treg mobility and maturation while reinforcing their immunosuppressive function and persistence in the tumor. Moreover, their interactions with immune cells likely inhibit CD8 T cells and antigen-presenting cells, supporting tumor immune escape. Additionally, more immunogenic tumor conditions, marked by IFNγ production, may contribute to Treg destabilization. Our findings underscore the pivotal role of Tregs in early immune evasion of HGSOC and provide insights into potential therapeutic strategies targeting their activity and differentiation fate.


Conflict of interest statement

Competing interests: The authors declare no competing interests.

Figures

Fig. 1
Fig. 1. Integrated scRNA-seq analysis reveals heterogeneous immune cell composition in the stage I HGSOC.
A Workflow illustrating the processing of blood and tumor samples followed by experimental and analytical procedures. UMAP visualization of all 21,697 integrated cells derived from tumor-associated CD45+ immune cells, their CD45 tumor counterparts, and matched PBMCs. Cells are color-coded based on tissue origin (B) or cell types (C). D Bar plot showing the frequency (%) of each cell type detected among blood and tumor-derived CD45+ and CD45 cells in two patients. Cell numbers were normalized to the total loaded cell number for each tissue-origin. E Dot plot displaying the expression of canonical gene markers used for annotation of blood and tumor-associated CD45+ and CD45 cell types. Dots are colored by the average expression of each gene scaled across all clusters and sized by the percentage of cells within a cluster (min.pct ≥ 10%).
Fig. 2
Fig. 2. Dissecting the complexity of tumor-infiltrating CD4 T lymphocytes in stage I HGSOC.
A UMAP visualization (upper panel) with relative frequency (%) distribution (lower panel) of re-clustered total blood and tumor-infiltrating CD4 T cell subsets. B, C Profiling of blood and tumor-infiltrating CD4 T cell subsets. Heatmap showing the Pearson correlation matrix for different CD4 T cell subsets (B), dot plot showing the expression of key selected differentiation and activating gene markers (C), dots are colored by the average expression of each gene scaled across all clusters and sized by the percentage of cells within a cluster (min.pct ≥ 10%). D Heatmap displaying the selection of significantly enriched Reactome and KEGG pathways with FDR-value < 0.05 (Reactome) or q-value (KEGG) < 0.05, identified among DEGs (refer to the Method section) in different CD4 T cell subtypes. E Bar plot showing the relative frequencies (%) of Th1, Th2, and Treg subtypes among tumor-infiltrating CD4 T lymphocytes analyzed for each patient, P1 and P2. Cell numbers were normalized to the total number of tumor-infiltrating CD4 T lymphocyte for each patient. F One representative IHC staining of CD4 and FOXP3 proteins in stage-I HGSOC (out of 11). IHC study showing statistical analysis of the mean ( ± SEM) of immunopositive CD4+ and FOXP3+ areas (G), and total FOXP3+ cell density (H), represented as dot plots (n = 11). Dots highlighted in dark blue (CD4) and dark purple (FOXP3) indicate samples analyzed by scRNA-seq.
Fig. 3
Fig. 3. Dissecting the heterogeneity of Treg cells in stage I HGSOC.
A Dot plot displaying the expression of selected gene markers used for different Treg subsets annotation. Dots are colored by the average expression of each gene scaled across all clusters and sized by the percentage of cells within a cluster (min.pct ≥ 10%). B Kaplan–Meier curves with corresponding Forest plots for patients with advanced OC (TCGA dataset), demonstrating OS differences between high-risk and low-risk expression of LAYN (upper panel) and CXCL13 (lower panel). Significant differences between the two groups are indicated by the P value < 0.05. C The top 10 predicted transcription factors (TFs) driving the activation of different tumor-infiltrating Treg subsets in c3/8/9/12/13/14. The TFs are ranked by their specificity score shown on the y-axis, ranging from 0 to 1, with 1 indicating complete specificity. D Pseudotime trajectory of distinct tumor-infiltrating Treg subtypes for each patient (P1, P2), colored by clusters c3/8/9/12/14. The arrows represent the two trajectory paths starting from naïve Tregs in c12: Path-I leading to FOXP3high Tregs in c3 and proliferative Tregs in c14, and Path-II leading to FOXP3+ Tregs in c8 and to ex-Tregs in c9. E Heatmap of the top 50 significantly branch-dependent genes (q-value < 0.01) variable along the two pseudotime Path-I and Path-II. The x-axis represents cells ordered by pseudotime values along Path-I (from middle to right), and along Path-II (from middle to left), and different colors correspond to the scaled (Z-scored) expression of each gene in each cell.
Fig. 4
Fig. 4. Profiling of cytotoxic lymphocytes in stage I HGSOC.
UMAP visualization of re-clustered blood and tumor-associated cytotoxic CD8 T and NK cells, colored by tissue origin (A), or by cell types (B; left panel), alongside the corresponding relative frequency (%) distribution (right panel) of each cell subtype for tissue-origin. Profiling of blood and tumor-infiltrating CD8 T (C) and NK cell subsets (D) by analyzing the expression of key selected differentiation and effector genes depicting various cell patterns: cycling, exhausted T (TExh), TN, TEM, TCM, TEMRA, NK CD56dim (CD56dimCD16+), NK decidual-like (CD9+CD151+CSF1+VEGFA+LGALS3+) and NK tissue-resident (CD49a+CD103+); displayed in dot plots. Dots are colored by the average expression of each gene scaled across all clusters and sized by the percentage of cells within a cluster (min.pct ≥ 10%). E Heatmap displaying the selection of significantly enriched Reactome and KEGG pathways with FDR-value < 0.05 (Reactome) or q-value (KEGG) < 0.05, identified among DEGs (refer to the Method section) in different CD8 T and NK cell subtypes.
Fig. 5
Fig. 5. Profiling of myeloid cell subsets in stage I HGSOC.
UMAP visualization of re-clustered blood monocytes (Mono) and tumor-associated macrophages (TAMs), dendritic cells (DCs), and Mast cells, colored by tissue origin (A) or by cell type subsets (B; left panel), alongside the corresponding relative frequency (%) distribution (right panel) of each cell type for tissue-origin. C Dot plot showing profiling of blood and tumor-associated myeloid cells analyzed by the expression of key selected differentiation and effector gene markers depicting specific cell patterns: CD14+, CD16+ (FCGR3A), inflammatory (Inflam), pro-angiogenesis (Angio), lipid-associated (LA), IFNG+ conventional (c)DCs, plasmacytoid (p)DCs and LAMP3+. Dots are colored by the average expression of each gene scaled across all clusters and sized by the percentage of cells within a cluster (min.pct ≥ 10%). D Radial graphs showing the expression level of the specific lipid-associated, pro-angiogenesis, and inflammatory gene module scores (refer to the Method section) calculated for each myeloid cell group. E Bar plot illustrating the relative frequencies (%) of specific cell cycle phase G1, G2M, and S distribution in all detected myeloid cell subsets. FUMAP showing the inferred development dynamics of myeloid cell subsets by RNA-velocity.
Fig. 6
Fig. 6. Dissecting the heterogeneity of tumor cells in stage I HGSOC.
UMAP visualization of tumor-derived CD45 cells analyzed in the two stage I HGSOC lesions. Cells are colored by patient (A) or cluster identity (cT0-cT11) (B). C Dot plot displaying the expression of canonical markers used for annotating different tumor-associated cell types. D Dot plot showing the expression of selected gene markers for each malignant epithelial cell cluster. Dots are colored by the average expression of each gene scaled across all clusters and sized by the percentage of cells within a cluster (min.pct ≥ 10%). E Feature plot depicting the expression of cycling-gene score (refer to the Method section). Pseudotime trajectory of malignant epithelial cells for P1 (F) and P2 (G). Each cell is colored by its pseudotime values from dark to light blue (right panels) or by cluster identity (left panels). The arrows indicate the initial point of the trajectory starting from proliferative cells in c6 and c4 for P1 and P2, respectively. Kaplan–Meier curves with corresponding Forest plots for patients with advanced OC (TCGA dataset), showing OS differences between high- and low-risk patients separated based on the specific 35 top DEGs obtained separately for cT5 (H) and cT0 (I). Significant differences between groups are indicated by the P value < 0.05.
Fig. 7
Fig. 7. Treg cells shape the cellular interaction in stage I HGSOC.
Dot plots displaying ligand-receptor interactions on the y-axis, showcasing the top 25 prioritized (by Pearson correlation coefficient) paired ligand-receptor interactions of FOXP3high Tregs (A) and FOXP3+ Tregs (B) with immune cell family. Dots are colored according to the regulatory potential values. Ligands or receptors expressed in Tregs (in red) are matched with their corresponding receptors or ligands (in black) expressed on different cell subsets shown on the x-axis. C The Venn diagram shows the overlapping or specifically paired ligand-receptor engagements among different cell types and FOXP3high and FOXP3+ Tregs. Dot plots displaying ligand-receptor interactions on the y-axis, showcasing the top 25 prioritized (by Pearson correlation coefficient) paired ligand-receptor interactions of FOXP3high Tregs (D) and FOXP3+ Tregs with cancer cells (E). Dots are colored according to the regulatory potential values. Ligands or receptors expressed in Tregs (in red) are matched with their corresponding receptors or ligands (in black) expressed on different cell subsets shown on the x-axis. (F) Dot plot showing selected paired ligand-receptor engagements detected in ex-Tregs.

References

    1. Upadhyay A, Garg V, Mathur S, Singh Malik P, Bhatla N, Kumar S, et al. Early-stage epithelial ovarian cancer: predictors of survival. Gynecol Oncol Rep. 2022;44:101083. - PMC - PubMed
    1. Zhang L, Conejo-Garcia JR, Katsaros D, Gimotty PA, Massobrio M, Regnani G, et al. Intratumoral T cells, recurrence, and survival in epithelial ovarian cancer. N Engl J Med. 2003;348:203–13. - PubMed
    1. Bray F, Ferlay J, Soerjomataram I, Siegel RL, Torre LA, Jemal A. Global cancer statistics 2018: GLOBOCAN estimates of incidence and mortality worldwide for 36 cancers in 185 countries. CA Cancer J Clin. 2018;68:394–424. - PubMed
    1. Joyce JA, Fearon DT. T cell exclusion, immune privilege, and the tumor microenvironment. Science. 2015;348:74–80. - PubMed
    1. Goode EL, Block MS, Kalli KR, Vierkant RA, Chen W, et al. Dose-response association of CD8+ tumor-infiltrating lymphocytes and survival time in high-grade serous ovarian cancer. JAMA Oncol. 2017;3:e173290. - PMC - PubMed