Meta-Analysis
. 2025 Apr 1;16(1):3101.
doi: 10.1038/s41467-025-58310-7.

Integration of GWAS, QTLs and keratinocyte functional assays reveals molecular mechanisms of atopic dermatitis

Affiliations
Meta-Analysis

Integration of GWAS, QTLs and keratinocyte functional assays reveals molecular mechanisms of atopic dermatitis

Meritxell Oliva et al. Nat Commun. .

Abstract

Atopic dermatitis is a highly heritable and common inflammatory skin condition affecting children and adults worldwide. Multi-ancestry approaches to atopic dermatitis genetic association studies are poised to boost power to detect genetic signal and identify loci contributing to atopic dermatitis risk. Here, we present a multi-ancestry GWAS meta-analysis of twelve atopic dermatitis cohorts from five ancestral populations totaling 56,146 cases and 602,280 controls. We report 101 genomic loci associated with atopic dermatitis, including 16 loci that have not been previously associated with atopic dermatitis or eczema. Fine-mapping, QTL colocalization, and cell-type enrichment analyses identified genes and cell types implicated in atopic dermatitis pathophysiology. Functional analyses in keratinocytes provide evidence for genes that could play a role in atopic dermatitis through epidermal barrier function. Our study provides insights into the etiology of atopic dermatitis by harnessing multiple genetic and functional approaches to unveil the mechanisms by which atopic dermatitis-associated variants impact genes and cell types.


Conflict of interest statement

Competing interests: B.R.G., M.O., K.M.S. are employees of AbbVie. F.T. and C.H. were employees of AbbVie at the time of the study. J.E.G. (University of Michigan) has received research support from AbbVie, Janssen, Almirall, Prometheus Biosciences/Merck, BMS/Celgene, Boehringer Ingelheim, Galderma, Eli Lilly, and advisor to Sanofi, Eli Lilly, Galderma, BMS, Boehringer Ingelheim. M.K.S., R.U., M.T.P., Q.L., R.B., J.M.K., L.C.T. are employees of University of Michigan and have no funding to disclose. M.E.M., A.H.S., F.D.M., D.W., J.T.G, L.Y., H.V., H.H. are employees of the Children’s Hospital of Philadelphia and have no funding to disclose. The design, study conduct, and financial support for this research were provided by AbbVie. AbbVie participated in the interpretation of data, review, and approval of the publication.

Figures

Fig. 1
Fig. 1. Scheme of data generation and analysis overview.
Ancestry-stratified GWAS meta-analyses were utilized to identify and fine-map genome-wide significant GWAS loci for atopic dermatitis risk. GWAS signal was integrated with functional maps and evaluated for cell-type context-specific enrichment and QTL colocalization; genes were prioritized per GWAS locus. The expression of a subset of prioritized genes was functionally characterized in keratinocytes for differentiation, cell-subtype specificity, knock-out (KO) and Quantitative Trait Loci (QTL) signal. This figure contains illustrations from BioRender. Oliva, M. (2025) [https://BioRender.com/r58o311].
Fig. 2
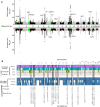
Fig. 2. AD GWAS loci annotation by ancestry and AD-related phenotypes.
a Nominal p-values (y-axis) derived from the multiple ancestry-combined (MULTI) (top panel) and the European-ancestry stratified (EUR) (bottom panel) GWAS meta-analysis are plotted by corresponding genomic coordinate (x-axis). P-values are derived from a two-sided test for effect size in a fixed-effect inverse variance weighted approach (Methods). Novel associations are highlighted in green and annotated with the nearest gene. Associations that reached significance (P < 5e−08) in both MULTI and EUR GWAS meta-analyses are annotated in the top panel; associations that reached significance (P < 5e−08) in only the EUR GWAS meta-analysis are annotated in the bottom panel. b Top panel illustrates the presence of significant (P < 5e−08) AD GWAS loci (x-axis) across ancestry-stratified and -combined GWAS meta-analyses (y-axis); significant loci per ancestry endpoint are indicated with a darker color shade. P-values are derived from a two-sided test for effect size in a fixed-effect inverse variance weighted approach (Methods). Bottom panel illustrates overlap of significant AD GWAS loci with previously reported genome-wide significant (P < 5e−08) and suggestive (P < 5e−06) GWAS loci for AD/eczema, allergy, and asthma phenotypes (Supplementary Data 10, 11). Bold frame indicates the 16 novel AD GWAS loci reported herein, annotated with corresponding cytoband, lead variant and nearest gene. P-values are shown as reported in the EBI GWAS Catalog (Methods).
Fig. 3
Fig. 3. Cell-type and context-specific enrichment of AD GWAS signal.
a Significance of AD GWAS heritability enrichment (x-axis) in accessible chromatin per immune cell type (y-axis) of stimulated (red) and non-stimulated (gray) isolated immune cell ATAC-seq data annotations. P-values were derived from Linkage disequilibrium (LD) score regression in specifically expressed genes (LD-SEG) analysis (Methods). Red dashed line corresponds to FDR < 0.05 threshold. b Significance of AD GWAS signal enrichment (x-axis) in differentially expressed genes per skin cell type (y-axis). P-values correspond to MAGMA gene-program enrichment for AD associated variants with genes expressed in healthy and AD-affected skin profiled with sc-RNAseq. (Methods). Differential expression corresponds to Healthy (gray), Lesional (pink) and AD progression (red) programs. Healthy and Lesional programs are defined by genes highly expressed in a particular skin cell type compared to others. Disease progression program is defined as differential expressed genes between cells of the same type in AD-lesional relative to healthy tissue. Red and gray dashed line corresponds to FDR < 0.05 and P < 0.05 thresholds, respectively.
Fig. 4
Fig. 4. AD GWAS-QTL colocalization results.
a Number of AD GWAS loci with identified QTL colocalizations (PP4 > 0.75), stratified by QTL molecular phenotype and GWAS ancestry and novelty endpoints, colored in red—if previously reported—or blue—if novel. Bold or pale color hue represents loci identified in the multi-ancestry or European ancestry AD GWAS, respectively. PP4 corresponds to the posterior probability of whether a shared causal variant exists in the region (Methods). b Number of genes with identified QTL colocalizations (PP4 > 0.75), stratified by QTL molecular phenotype type. The inset heatmap represents the number of QTL endpoints per QTL type (x-axis) for each of the four genes supported by all QTL types (y-axis); barplot shows aggregated cross-QTL support per gene. c Genotype-phenotype association p-values of the CRAT locus. Panels illustrate CRAT pQTL signal in ARIC EA plasma (top) and GWAS signal for AD (middle) and GWAS signal for increased levels of 2-methylmalonylcarnitine (bottom). d Genotype-phenotype association p-values of the CD207 locus. Panels illustrate CD207 eQTL signal in GTEx skin not exposed to sun (top), ImmuNexUT myeloid dendritic cells (mDC) (middle) and GWAS signal for AD (bottom). Lead GWAS variant mapped to AD risk allele is typed and illustrated by a triangle-shaped point pointing upwards, indicating allele association with positive phenotype effect. Linkage disequilibrium between loci is quantified by squared Pearson coefficient of correlation (r2). P-values correspond to nominal GWAS and QTL associations, derived from multiple regression two-sided t-tests.
Fig. 5
Fig. 5. Prioritized candidate genes at novel loci.
a Supporting evidence by candidate per GWAS locus. b Scheme of ligand-receptor and proximal components of IL-6 and IL-22 signaling pathway. Corresponding expression and protein QTL associations mapped to the lead AD GWAS variant risk allele are shown. This figure contains illustrations from BioRender. Oliva, M. (2025) [https://BioRender.com/d11f365]. c Genotype-phenotype association p-values of the IL6ST, IL22RA2, ITK and BATF locus. First panel illustrates ITK ENST00000522616 sQTL signal in T helper 2 cells (Th2), second panel illustrates BATF eQTL signal in CD8+ memory T-cells, third panel illustrates IL6ST eQTL signal in T follicular helper cells (Tfh), forth panel illustrates IL22RA2 pQTL signal in plasma. For all panels, bottom part illustrates GWAS signal for AD. Lead GWAS variant mapped to AD risk allele is typed and indicated by a triangle-shaped point, pointing upwards or downwards for positive or negative effect size, respectively. Linkage disequilibrium between loci is quantified by squared Pearson coefficient of correlation (r2). P-values correspond to nominal GWAS and QTL associations, derived from multiple regression two-sided t tests.
Fig. 6
Fig. 6. Functional characterization of prioritized AD keratinocyte-linked gene candidates.
1st panel, Keratinocyte subtype differential expression (x-axis) by gene (y-axis). Differential expression values correspond to expression log fold change (FC) between a total of 96,194 keratinocyte and 178,640 non-keratinocyte cells, mean-averaged across body sites (n = 7 sites, Methods), and whiskers represent the standard deviation of the mean. 2nd panel, Differential expression (x-axis) of gene (y-axis) as a function of epidermal raft differentiation. Differential expression values correspond to log expression fold change as a function of differentiation timepoints (n = 7 timepoints, Methods), and whiskers represent the 95% confidence interval of the value. 3rd panel, Differential expression of pathway (x-axis) proxy genes by candidate gene (y-axis). Differential expression values correspond to the standardized mean difference (SMD) of the expression of genes that are proxies of IL-22 and IL-13 pathways between the presence or absence of siRNA targeting corresponding gene candidate. SMD values were derived from across-proxy-genes per-pathway meta-analysis (n = 3 proxies, Methods). Whiskers represent the 95% confidence interval of the value. 4th panel, Keratinocyte eQTL effect size (x-axis) by candidate gene (y-axis) (n  =  50 subjects). Effects are mapped to AD risk alleles of the corresponding GWAS locus lead variants. Whiskers represent the 95% confidence interval of the value. CEBPA effect size is not shown due to insufficient AD risk allele frequency (Methods).

References

    1. Weidinger, S. & Novak, N. Atopic dermatitis. Lancet387, 1109–1122 (2016). - PubMed
    1. Bieber, T. Atopic dermatitis. N. Engl. J. Med.358, 1483–1494 (2008). - PubMed
    1. Chovatiya, R. & Silverberg, J. I. The heterogeneity of atopic dermatitis. J. Drugs Dermatol.21, 172–176 (2022). - PMC - PubMed
    1. Schuler, C. F. T., Billi, A. C., Maverakis, E., Tsoi, L. C. & Gudjonsson, J. E. Novel insights into atopic dermatitis. J. Allergy Clin. Immunol.151, 1145–1154 (2023). - PMC - PubMed
    1. Sanders, K. M. & Akiyama, T. The vicious cycle of itch and anxiety. Neurosci. Biobehav. Rev.87, 17–26 (2018). - PMC - PubMed

Publication types

MeSH terms

LinkOut - more resources