. 2025 Apr;57(4):759-774.
doi: 10.1038/s12276-025-01426-z. Epub 2025 Apr 1.

PGC-1α mediates migrasome secretion accelerating macrophage-myofibroblast transition and contributing to sepsis-associated pulmonary fibrosis

Affiliations

PGC-1α mediates migrasome secretion accelerating macrophage-myofibroblast transition and contributing to sepsis-associated pulmonary fibrosis

Yawen Peng et al. Exp Mol Med. 2025 Apr.

Abstract

Sepsis-associated pulmonary fibrosis (SAPF) is a critical pathological stage in the progression of sepsis-induced acute respiratory distress syndrome. While the aggregation and activation of lung fibroblasts are central to the initiation of pulmonary fibrosis, the macrophage-myofibroblast transition (MMT) has recently been identified as a novel source of fibroblasts in this context. However, the mechanisms driving MMT remain inadequately understood. Given the emerging role of migrasomes (novel extracellular vesicles mediating intercellular communication), we investigated their involvement in pulmonary fibrosis. Here we utilized a lipopolysaccharide-induced SAPF mouse model and an in vitro co-culture system of fibroblasts and macrophages to observe the MMT process during SAPF. We found that lipopolysaccharide exposure suppresses PGC-1α expression in lung fibroblasts, resulting in mitochondrial dysfunction and the accumulation of cytosolic mitochondrial DNA (mtDNA). This dysfunction promotes the secretion of mtDNA-containing migrasomes, which, in turn, initiate the MMT process and contribute to fibrosis progression. Notably, the activation of PGC-1α mitigates mitochondrial dysfunction, reduces mtDNA-migrasome release, inhibits MMT and alleviates SAPF. In conclusion, our study identifies the suppression of PGC-1α in lung fibroblasts and the subsequent release of mtDNA migrasomes as a novel mechanism driving MMT in SAPF. These findings suggest that targeting the crosstalk between fibroblasts and immune cells mediated by migrasomes could represent a promising therapeutic strategy for SAPF.


Conflict of interest statement

Competing interests: The authors declare no competing interests.

Figures

Fig. 1
Fig. 1. MMT involved in LPS-induced pulmonary fibrosis.
a UMAP and clustering based on RNA expression data of mouse lung tissue. ILC, innate lymphoid cell; LEC, lymphatic endothelial cell. b RNA velocity analysis of fibroblast, mesenchymal cell and macrophage clusters of the control group and the LPS group respectively. c Pseudotime expression trends of fibroblast, mesenchymal cell and macrophage clusters over the pseudotime trajectory. d Violin plots of pseudotime of macrophage, mesenchymal cell and fibroblast clusters sorted by pseudotime. e MMTs (α-SMA+ CD68+), M1-MMTs (α-SMA+ CD86+) and M2-MMTs (α-SMA+ CD206+) in murine lung quantified by flow cytometry analysis. f Bar plots representing the percentage of α-SMA+ CD68+ cells to CD68+ cells, percentage of α-SMA+ CD86+ cells to CD86+ cells and percentage of α-SMA+ CD206+ cells to CD206+ cells in murine lung quantified by flow cytometry analysis (*P < 0.05, unpaired t-test, n = 4). g Multiplex immunofluorescence enlarged merged images of F4/80+ CD86+ α-SMA+ cells in mouse lung tissues. The arrows indicate the positive co-localized cell. Scale bar, 50 μm. h Multiplex immunofluorescence enlarged merged images of F4/80+ CD206+ α-SMA+ cells in mouse lung tissues. The arrows indicate the positive co-localized cell. Scale bar, 50 μm.
Fig. 2
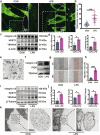
Fig. 2. LPS stimulation increases fibroblast migrasome release in vitro and in vivo.
a A typical confocal image of fibroblasts with WGA staining. Enlarged migrasomes are shown in the right panels. The white arrows show migrasomes. Scale bar, 5 µm. b Statistics of migrasome number per cell in migrasome-containing fibroblasts (****P < 0.0001, unpaired t-test, n = 30). c, d The protein expression of migrasome-specific markers integrin α5, NDST1 and TSPAN4 in fibroblasts was determined using western blot (c). The bar plots (d) show the relative expression (*P < 0.05, unpaired t-test, n = 3). e Purified migrasomes derived from fibroblasts were determined using TEM analysis. f Purified migrasomes derived from fibroblasts were determined using western blot. g, h Microscopic inspection (g) of L929 fibroblasts with or without LPS stimulation after scratching (0 h) and after 48 h of wound healing. The bar plots (h) show the relative fibroblast migration area percentage (*P < 0.05, ****P < 0.0001, unpaired t-test, n = 6). i, j The protein expression of migrasome-specific markers integrin α5, NDST1 and TSPAN4 in mouse lung was determined using western blot (i). The bar plots (j) show the relative expression (*P < 0.05, **P < 0.01, unpaired t-test, n = 3). k TEM images of the migrasome observed in normal and fibrotic mouse lung tissues. Scale bar, 2 µm. Enlarged migrasomes are shown in the right panels. Scale bar, 500 nm.
Fig. 3
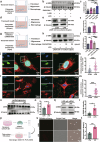
Fig. 3. Fibroblast-released mtDNA migrasomes contribute to MMT in LPS-induced pulmonary fibrosis.
a The experimental scheme of fibroblast and macrophage co-culture using transwell inserts with a pore size of 3 µm. b, c Immunoblotting images of the α-SMA protein in macrophages co-cultured with fibroblasts with or without LPS stimulation (b) The bar blots (c) show the relative α-SMA protein expression (*P < 0.05, **P < 0.01, ***P < 0.001, one-way ANOVA, n = 6). d The experimental scheme of fibroblast and macrophage co-culture using transwell inserts with a pore size of 0.4 μm to inhibit migrasomes’ access to the lower chamber. e, f Immunoblotting images (e) and analysis of the relative α-SMA protein expression in macrophages (f) which co-cultured with fibroblasts with or without LPS stimulation under obstruction of migrasome access to the lower chamber (transwell inserts with a pore size of 0.4 µm; NS, not significant, unpaired t-test, n = 3). g The experimental scheme of fibroblasts challenged with different concentrations of migrasome inhibitor co-culture with macrophages using transwell inserts with a pore size of 3 µm. h, i Immunoblotting images (h) and analysis of the relative α-SMA protein expression in macrophages (i) which co-cultured with fibroblasts challenged with different concentrations of migrasome inhibitor SAR407899 using transwell inserts with a pore size of 3 µm (*P < 0.05, **P < 0.01, ***P < 0.001, one-way ANOVA, n = 3). j Confocal images of mitochondrial morphology (red) and dsDNA (green) in a L929 cell. Scale bar, 5 µm. k Quantification of extranuclear dsDNA foci per cell (****P < 0.0001, unpaired t-test, n = 50). l Confocal images of migrasomes with WGA staining (red) and dsDNA (green) in a L929 cell. Scale bar, 10 µm. m Quantitative analysis of dsDNA-positive migrasome number in each L929 cell (****P < 0.0001, unpaired t-test, n = 50). n, o Immunoblotting images (n) and analysis of the relative α-SMA protein expression (o) in macrophages after challenge by purified migrasomes from both control and LPS-stimulated fibroblasts (*P < 0.05, unpaired t-test, n = 4). p A schematic of fibroblast mitochondrial mtDNA isolation and transfection into macrophage. q, r Immunoblotting images (q) and analysis of relative α-SMA protein expression (r) in macrophages after transduction with mtDNA from control or LPS-stimulated fibroblast donors (*P < 0.05, unpaired t-test, n = 3). s Immunofluorescence microscopy image of TSPAN4-mCherry-labeled migrasomes derived from fibroblasts seeded in the upper chamber taken up by macrophages seeded in the lower chamber in a transwell setup with a pore size of 3 µm. The arrow indicates TSPAN4-mCherry-positive signal in the macrophages. Scale bar, 50 µm. t Quantification of the phagocytosis rate (****P < 0.0001, unpaired t-test, n = 6).
Fig. 4
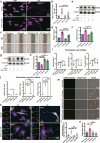
Fig. 4. Activating PGC-1α alleviates LPS-induced mitochondrial dysfunction and suppresses the fibroblast mtDNA-migrasome formation.
a Typical confocal images of PGC-1α-overexpressing (OE) or vector fibroblasts with or without LPS stimulation by WGA staining. Scale bar, 10 µm. b Statistics of migrasome number per cell in migrasome-containing fibroblasts (**P < 0.01, ***P < 0.001, ****P < 0.0001, one-way ANOVA, n = 30). c, d Microscopic inspection (c) of PGC-1α-overexpressing or vector fibroblasts with or without LPS stimulation after scratching (0 h) and after 48 h of wound healing. The bar plots (d) show the relative fibroblast migration area percentage (*P < 0.05, ****P < 0.0001, one-way ANOVA, n = 6). e, f Western blot images of migrasome marker protein PIGK relative protein expression from vector-transfected or PGC-1α-overexpressing transfected fibroblasts with or without LPS exposures (e) and quantified (f) (*P < 0.05, **P < 0.01, ***P < 0.001, one-way ANOVA, n = 3). OE means overexpression. g, h mtTFA protein expression of PGC-1α-overexpressing L929 cells or vector-transfected L929, and stimulated with or without LPS, detected using western blot (g) and quantified (h) (*P < 0.05, **P < 0.01 ***P < 0.001, one-way ANOVA, n = 4). OE means overexpression. i Relative total mtDNA amounts in stable PGC-1α-overexpressing L929 cells or vector-transfected L929 cells stimulated with or without LPS. The ratios of ND1 mtDNA to 18S nDNA, Cox1 mtDNA to 18S nDNA and D-loop mtDNA to B2M nDNA are shown (*P < 0.05, **P < 0.01, ***P < 0.001, ****P < 0.0001, one-way ANOVA, n = 4). OE means PGC-1α-overexpressing. j Relative cytosolic mtDNA amounts in PGC-1α-overexpressing or vector control fibroblasts stimulated with or without LPS (*P < 0.05, ****P < 0.0001, one-way ANOVA, n = 3). OE means PGC-1α-overexpressing. k Representative fluorescent confocal images of L929 cells stably overexpressing PGC-1α or vector-transfected L929 cells stimulated with or without LPS and co-stained for dsDNA (blue) and migrasome (fuchsia). EGFP (green) fluorescent signal from the transfected plasmid. Scale bar, 10 µm. l Quantitative analysis of dsDNA-positive migrasome number in each L929 cell (*P < 0.05, ****P < 0.0001, one-way ANOVA, n = 15). OE means overexpression. m Immunofluorescence microscopy images of TSPAN4-mScarlet-labeled migrasomes derived from PGC-1α-overexpressing or vector-transfected L929 fibroblasts seeded in the upper chamber, showing uptake by macrophage seeded in the lower chamber of a transwell setup with a pore size of 3 µm. The arrow indicates TSPAN4-mScarlet-positive signal in the macrophages. Scale bar, 50 µm. n Quantification of the phagocytosis rate (***P < 0.001, ****P < 0.0001, one-way ANOVA, n = 6).
Fig. 5
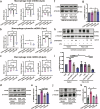
Fig. 5. PGC-1α-mediated mtDNA-migrasome release from fibroblasts is required for MMT.
a Relative total mtDNA amounts in macrophage co-cultured with PGC-1α-overexpressing fibroblasts or vector-transfected fibroblasts challenged with or without LPS using a transwell insert system with a pore size of 3 µm (*P < 0.05, **P < 0.01, one-way ANOVA, n = 3). b Relative cytosolic mtDNA amounts in macrophages co-cultured with PGC-1α-overexpressing fibroblasts or vector-transfected fibroblasts challenged with or without LPS using a transwell insert system with a pore size of 3 µm. The relative ratios of ND1 mtDNA, COX1 mtDNA and D-loop mtDNA are shown (*P < 0.05, ****P < 0.0001, one-way ANOVA, n = 3). c Relative total mtDNA amounts in macrophages co-cultured with PGC-1α-overexpressing fibroblasts or vector-transfected fibroblasts challenged with or without LPS using a transwell insert system with a pore size of 0.4 µm (one-way ANOVA, n = 3). d, e Immunoblotting images (d) and quantification analysis (e) of the α-SMA protein in macrophages co-cultured with PGC-1α-overexpressing fibroblasts or vector control fibroblasts with or without LPS stimulation while migrasome gets access to macrophage in the lower chamber (transwell inserts with a pore size of 3 µm) (*P < 0.05, **P < 0.01, ***P < 0.001, one-way ANOVA, n = 4). f, g Immunoblotting images (f) and quantification analysis (g) of the α-SMA protein in macrophages co-cultured with PGC-1α-overexpressing fibroblasts or vector control fibroblasts with or without LPS stimulation while migrasome was considered impassable (transwell inserts with a pore size of 0.4 µm) (n = 3). h, i Immunoblotting images (h) and quantification analysis (i) of the α-SMA protein in macrophages co-cultured with PGC-1α-overexpressing fibroblasts or vector control fibroblasts challenged with different concentrations of migrasome inhibitor SAR407899 using transwell inserts with a pore size of 3 µm (*P < 0.05, **P < 0.01, ****P < 0.0001, one-way ANOVA, n = 3). j, k Immunoblotting images (j) and quantification analysis (k) of the α-SMA protein in macrophages transduced with the same dosage of mtDNA donated from PGC-1α-overexpressing fibroblasts or vector control fibroblasts stimulated with or without LPS (*P < 0.05, one-way ANOVA, n = 3).
Fig. 6
Fig. 6. PGC1α activation alleviates LPS-associated pulmonary fibrosis by restraining the MMT process.
a Kaplan–Meier survival curve of PGC-1α-overexpressing or vector-transfected mice after LPS or saline administration (log-rank (Mantel–Cox) test, n = 10 mice). b Typical images of H&E (top) and Masson’s trichrome (bottom) staining of PGC-1α-overexpressing AAV or vector-transfected mouse lung sections. Scale bar, 200 µm. c, d mtTFA, α-SMA and PIGK protein expression of PGC-1α-overexpressing or vector-transfected mouse lung tissue with or without LPS exposure detected using western blot (c), followed by quantification analysis (d) (*P < 0.05, **P < 0.01, ***P < 0.001, ****P < 0.0001, one-way ANOVA, n = 3 for PIGK, n = 4 for mtTFA, n = 5 for α-SMA). e TEM images of the mouse lung fibroblast mitochondria. PGC-1α overexpression in SAPF mouse lung fibroblasts significantly alleviated the mitochondria damage compared with vector-pretreated SAPF mice. The enlarged image shows mitochondria in fibroblasts. Scale bar, 5 µm. f MMTs (α-SMA+ CD68+), M1-MMTs (α-SMA+ CD86+) and M2-MMTs (α-SMA+ CD206+) in murine lung quantifyied by flow cytometry analysis. Gated on CD11b+ F4/80+ macrophages. g Bar plots representing the percentage of α-SMA+ CD68+ cells to CD68+ cells, α-SMA+ CD86+ cells to CD86+ cells and α-SMA+ CD206+ cells to CD206+ cells respectively (*P < 0.05, **P < 0.01, one-way ANOVA, n = 3, n = 4 for the CON+vector group and the CON + OE group of CD68+ analysis). h Multiplex immunofluorescence enlarged merged images of F4/80+ CD86+ α-SMA+ cells (top) and F4/80+ CD206+ α-SMA+ cells (bottom) in mouse lung tissues. Scale bar, 50 μm.

References

    1. Zhou, W. Q., Wang, P., Shao, Q. P. & Wang, J. Lipopolysaccharide promotes pulmonary fibrosis in acute respiratory distress syndrome (ARDS) via lincRNA-p21 induced inhibition of Thy-1 expression. Mol. Cell Biochem.419, 19–28 (2016). - PubMed
    1. Wan, H. et al. Thy-1 depletion and integrin beta3 upregulation-mediated PI3K–Akt–mTOR pathway activation inhibits lung fibroblast autophagy in lipopolysaccharide-induced pulmonary fibrosis. Lab. Invest.99, 1636–1649 (2019). - PMC - PubMed
    1. Otoupalova, E., Smith, S., Cheng, G. & Thannickal, V. J. Oxidative stress in pulmonary fibrosis. Compr. Physiol.10, 509–547 (2020). - PubMed
    1. Plikus, M. V. et al. Fibroblasts: origins, definitions, and functions in health and disease. Cell184, 3852–3872 (2021). - PMC - PubMed
    1. Adams, T. S. et al. Single-cell RNA-seq reveals ectopic and aberrant lung-resident cell populations in idiopathic pulmonary fibrosis. Sci. Adv.6, eaba1983 (2020). - PMC - PubMed

MeSH terms

Substances

LinkOut - more resources