. 2025 May;39(5):1206-1217.
doi: 10.1038/s41375-025-02572-z. Epub 2025 Mar 31.

Senescence profiling of monoclonal gammopathies reveals paracrine senescence as a crucial defense against disease progression

Affiliations

Senescence profiling of monoclonal gammopathies reveals paracrine senescence as a crucial defense against disease progression

Gabriel Alvares Borges et al. Leukemia. 2025 May.

Abstract

Multiple myeloma (MM) is a plasma cell (PC) malignancy that is preceded by monoclonal gammopathy of undetermined significance (MGUS) and/or smoldering multiple myeloma (SMM). MGUS and SMM PCs exhibit the same primary oncogenic abnormalities as MM but lack the end-organ damage that defines proliferative disease, suggesting that clonal PCs in these precursor conditions could exhibit senescence or senescence-like growth arrest. Herein we identified monoclonal gammopathy patient-derived PCs that exhibit senescence features and found that senescent PCs were significantly increased in MGUS patients compared to SMM or MM. Spatial analysis of senescent PCs in stable MGUS and SMM patient biopsies demonstrated the activation of local paracrine senescence in the bone marrow microenvironment. Stable MGUS and SMM patients also exhibited disease-specific senescence-associated secretory phenotype (SASP) signatures that significantly correlated with PC burden and clonal antibody. In contrast, progressing MGUS, SMM, and new MM patients lacked local paracrine senescence responses and robust activation of disease specific SASP signatures. Overall, these data suggest that failure to activate tumor-specific paracrine senescence responses is key to disease progression in monoclonal gammopathies.


Conflict of interest statement

Competing interests: TT and JLK have a financial interest related to this research, including patents and pending patents covering senolytic drugs and their uses held by Mayo Clinic. This research has been reviewed by the Mayo Clinic Conflict of Interest Review Board and was conducted in compliance with Mayo Clinic conflict of interest policies. Ethics approval and consent to participate: All methods described in this manuscript were performed in accordance with the relevant guidelines and regulations. The human study protocols reported in this manuscript were conducted in accordance with the Declaration of Helsinki. Patients who donated bone marrow aspiration samples and peripheral plasma provided written informed consent in accordance with the biobanking study protocol, which was approved by the Mayo Clinic Institutional Review Board under the number 521-93. Analyses of these samples was approved by the Mayo Clinic Institutional Review Board under the number 20-002263. Trephine iliac crest bone biopsies from MGUS, SMM, and NDMM patients were obtained from Danish pathological biobanks under approval from the Danish National Committee on Biomedical Research Ethics (S-20190110) and in compliance with the Declaration of Helsinki. All patients provided written informed consent. Bone biopsies from healthy individuals were included from a previous study approved by the Danish National Committee on Biomedical Research Ethics under protocol number 1-10-72-223-20, with informed consent obtained from all participants.

Figures

Fig. 1
Fig. 1. Enrichment of senescence-related gene sets in MGUS and SMM PCs after analysis of an independent previously published human gene array dataset (GSE5900).
A Differential expression analysis of MGUS and SMM PCs revealed a significant upregulation of the senescence markers CDKN1A and GADD45A. Bars represent means with standard deviations (SD). p values were calculated using the one-way ANOVA test followed by Tukey’s multiple comparisons test. B Advaita iPathway Guide analysis showed that the ‘Cellular Senescence’ pathway (yellow dot) was significantly enriched in both MGUS and SMM PCs. Dots represent individual pathways, plotted based on their p-value for perturbation accumulation (pAcc) versus overrepresentation analysis (pORA). Other significant combined p-values are shown in red. C Single sample GSEA (ssGSEA) using “GenAge” and “SenMayo” gene sets resulted in no enrichment in MGUS or SMM PCs, suggesting that senescence gene enrichment is independent of age-related senescence. D To customize senescence phenotyping gene sets, input gene sets were compiled and tested against two independent senescence gene expression datasets (GSE66236 and GSE109700). Genes that were significantly upregulated in both datasets were added to the relevant senescence gene sets. The IFN-SASP gene set was compiled with genes from existing IFN gene sets and tested against a late senescence RNA-seq dataset (GSE109700). “SenUp” = Senescence Up; SCAPs = Senescent Cell Anti-Apoptosis Pathways; SenGA = Senescence Growth Arrest; iSASP = Inflammatory Senescence-Associated Secretory Phenotype (SASP); IFN-SASP = Interferon-SASP. E GSEA analysis revealed significant enrichment (Normalized Enrichment Score - NES > 1.5, q < 0.05) of gene sets “SenUp”, ‘SCAPs’, ‘SenGA’, and “IFN-SASP” in MGUS and SMM PCs, while the “iSASP” gene set was exclusively enriched in MGUS PCs (NES = 1.4, q = 0.11). F ssGSEA confirmed significant enrichment of senescence phenotyping gene sets throughout MGUS samples, with SMM samples showing enrichment in all gene sets except for “iSASP”. G Calculation of “IFN-SASP”/”iSASP” enrichment ratios showed a significant increase in SMM samples compared to healthy donors, indicating a higher prevalence of IFN-related SASP in SMM. Bars represent medians with interquartile ranges. p values were calculated using the Kruskal-Wallis test followed by Dunn’s multiple comparisons test.
Fig. 2
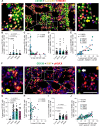
Fig. 2. Senescence cytologic features in MGUS, SMM, and NDMM patient PCs.
A Representative images of cells stained for DAPI (cyan), CENPB (centromeres—red), HMGB1 (yellow), and LaminB1 (green). Yellow arrow indicates a cell considered senescent, based on the number of senescence-associated distension of alpha-satellite (SADS) per nucleus (three or more), loss of HMGB1 (LoH), and loss of LaminB1 (LoL). White arrows indicate non-senescent cells, defined as cells with less than three SADS per nucleus, presence of HMGB1, and/or presence of LaminB1. Red numbers indicate the calculation of the major axis length / minor axis length ratio in distended centromeres. B MGUS patient PCs exhibited a significant increase in the percentage of cells positive for three or more SADS per nucleus compared to SMM and MM. Bars represent medians with interquartile ranges. p values were calculated using the Kruskal-Wallis test followed by Dunn’s multiple comparisons test. C When requiring LoH and LoL in addition to SADS to define senescence, the difference between MGUS and MM becomes more significant. Bars represent medians with interquartile ranges. p values were calculated using the Kruskal-Wallis test followed by Dunn’s multiple comparisons test. D Significant inverse correlations between the percentage of senescent PCs and monoclonal PC (PC) burden or M-protein levels were observed. r and p values were calculated using the Spearman correlation test.
Fig. 3
Fig. 3. Histological senescence analysis of diagnostic bone marrow biopsies from patients with MGUS, SMM, or newly diagnosed MM (NDMM).
A Representative images of a triple immunostaining for CD138 (green), LaminB1 (yellow), and HMGB1 (red). The yellow arrow indicates a senescent PC, defined as CD138+, LaminB1-, and HMGB1-. The white arrow indicates a non-senescent PC, defined as CD138+, LaminB1+, and/or HMGB1+. B Senescent (S + , LaminB1-, HMGB1-) PCs (CD138+) were observed across healthy (Control), MGUS, SMM, and NDMM biopsies. C Significant inverse correlation between the percentage of senescent PCs (defined by no LaminB1/HMGB1) and PC (PC) burden was observed by Spearman correlation test. D Senescent (S + , LaminB1-, HMGB1-) bone marrow microenvironment cells (BMME, CD138- cells) were observed across healthy (Control) MGUS, SMM, and NDMM biopsies. E The burden of senescent PCs significantly correlated with the percentage of senescent BMME across groups as measured by the Spearman correlation test. F Representative images of a triple immunostaining for CD138 (green), Ki67 (yellow), and γH2A.X (red). The yellow arrow indicates a senescent PC, defined as CD138+, Ki67-, and γH2A.X+. The white arrow indicates a non-senescent PC, defined as CD138+, Ki67+, and/or γH2A.X-. G Senescent (S + , Ki67-, γH2A.X+) PCs (CD138+) were observed across healthy (Control), MGUS, SMM, and NDMM biopsies. H Significant positive correlation between the percentage of senescent PCs (defined by Ki67-, γH2A.X+) and PC (PC) burden was observed by Spearman correlation test. I Senescent (S + , Ki67-, γH2A.X+) bone marrow microenvironment cells (BMME, CD138- cells) were observed across healthy (Control), MGUS, SMM, and NDMM biopsies. J The burden of senescent PCs was significantly correlated with the percentage of senescent BMME across groups as measured by the Spearman correlation test.
Fig. 4
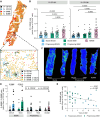
Fig. 4. Spatial analysis of senescent and non-senescent cells in MGUS, SMM and newly diagnosed MM (NDMM) patient biopsies stratified by disease progression status.
A Representative schematic of the spatial histological assessment in trephine bone biopsy. Each dot represents a cell, colored according to cell type, senescence status, and proximity to senescent PC. B Ratio of PCs (PC; CD138+) to bone marrow microenvironment cells (BMME; CD138-) neighboring senescent (S + , white dots) or non-senescent (S-, black dots) PCs. PCs surrounding both senescent and non-senescent PCs were increased in NDMM compared to stable or progressing MGUS and stable SMM. C Density heatmaps showed localized increases in senescent cells in stable MGUS and SMM patients, as compared to progressing or NDMM patients. D Comparing the ratio of senescent to non-senescent BMME neighboring non-senescent PCs (white dots) vs. senescent PCs (black dots) revealed significant enrichment of senescent BMME in the proximity of senescent PCs in stable MGUS and SMM biopsies, but not in progressing disease or NDMM biopsies. E The negative correlation between the average percentage of non-senescent BMME within 25 µm of senescent PCs and years to progression to MM in MGUS and SMM patients was significant, as measured by the Spearman correlation test.
Fig. 5
Fig. 5. SASP factor analysis of peripheral plasma isolated from stable MGUS and SMM patients.
A Peripheral plasma from stable MGUS and SMM patients was assessed for SASP factors associated with frailty, as well as cell-free mitochondrial (MT)-DNA. Heatmap shows the patients ranked per SASP factor. Among the twelve measured SASP factors, MT-DNA, and IL-7 were significantly elevated in stable MGUS, while osteopontin (OPN), GDF15, and TNF-α were significantly increased in stable SMM. Asterisks indicate a significant difference in the plasma concentration of a marker (*p < 0.05, **p < 0.01) between stable MGUS and stable SMM patients, as measured by the Mann–Whitney test. B Analysis of the top 50th percentile (in maroon) for each factor revealed certain markers skewed towards stable MGUS and others towards stable SMM, indicating distinct SASP profiles in these conditions. C A composite SASP score were generated for stable MGUS based on factors that skewed towards MGUS vs. SMM (odds ratio greater than 1.5). D Composite SASP score generated for stable SMM based on factors that skewed towards SMM vs. MGUS (odds ratio lower than 0.5). E MGUS-SMM SASP composite score, calculated by subtracting the SMM SASP score from the MGUS SASP score. Bars represent means with standard deviations (SD). p-values were calculated using the one-way ANOVA test followed by Tukey’s multiple comparisons test.
Fig. 6
Fig. 6. Evaluation of stable MGUS and SMM SASP composite scores across patients that progressed to MM and NDMM patients.
A Dataset was expanded from one presented in Fig. 5B. Redistribution of patients according to the 50th percentile (top 50th percentile in maroon, lower 50th percentile in gray) showed that the SASP markers that constitute the stable MGUS composite score (highlighted in red) and the stable SMM composite score (highlighted in blue) were still enriched in their respective sets of patients. B The analysis of the stable MGUS-SMM SASP composite score across the groups still showed significant enrichment in stable MGUS patients compared to stable SMM patients. Bars represent means with SD. p-values were calculated using the one-way ANOVA test followed by Tukey’s multiple comparisons test. C A significant inverse correlation between stable MGUS-SMM SASP score and PC (PC) burden was observed in stable patients, but no correlation was identified in progressing patients. r and p-values were calculated using the Spearman correlation test. D, E Schematic representation of time-course of senescence activation and clearing in stable vs. progressing MGUS/SMM conditions. D In patients with stable MGUS/SMM, oncogenic activation induces an acute cellular and paracrine senescence response that is partially cleared over time; a high burden of senescence cells remains upon immune clearing (blue circle), which may contribute to accelerated aging at expense of tumor inhibition in stable patients. E Patients with chronically increased senescent burden prior to oncogenic activation (purple circle) fail to activate cellular and paracrine senescence responses, which result in progression to MM.

References

    1. American Cancer Society. Cancer Facts & Figures 2024. Atlanta: American Cancer Society. 2024.
    1. Landgren O, Kyle RA, Pfeiffer RM, Katzmann JA, Caporaso NE, Hayes RB, et al. Monoclonal gammopathy of undetermined significance (MGUS) consistently precedes multiple myeloma: a prospective study. Blood. 2009;113:5412–7. - PMC - PubMed
    1. Weiss BM, Abadie J, Verma P, Howard RS, Kuehl WM. A monoclonal gammopathy precedes multiple myeloma in most patients. Blood. 2009;113:5418–22. - PMC - PubMed
    1. Kyle RA, Durie BG, Rajkumar SV, Landgren O, Blade J, Merlini G, et al. Monoclonal gammopathy of undetermined significance (MGUS) and smoldering (asymptomatic) multiple myeloma: IMWG consensus perspectives risk factors for progression and guidelines for monitoring and management. Leukemia. 2010;24:1121–7. - PMC - PubMed
    1. Kyle RA, Remstein ED, Therneau TM, Dispenzieri A, Kurtin PJ, Hodnefield JM, et al. Clinical course and prognosis of smoldering (asymptomatic) multiple myeloma. N Engl J Med. 2007;356:2582–90. - PubMed

LinkOut - more resources