. 2025 May;31(5):1592-1603.
doi: 10.1038/s41591-025-03565-2. Epub 2025 Mar 31.

A cerebrospinal fluid synaptic protein biomarker for prediction of cognitive resilience versus decline in Alzheimer's disease

Affiliations

A cerebrospinal fluid synaptic protein biomarker for prediction of cognitive resilience versus decline in Alzheimer's disease

Hamilton Se-Hwee Oh et al. Nat Med. 2025 May.

Abstract

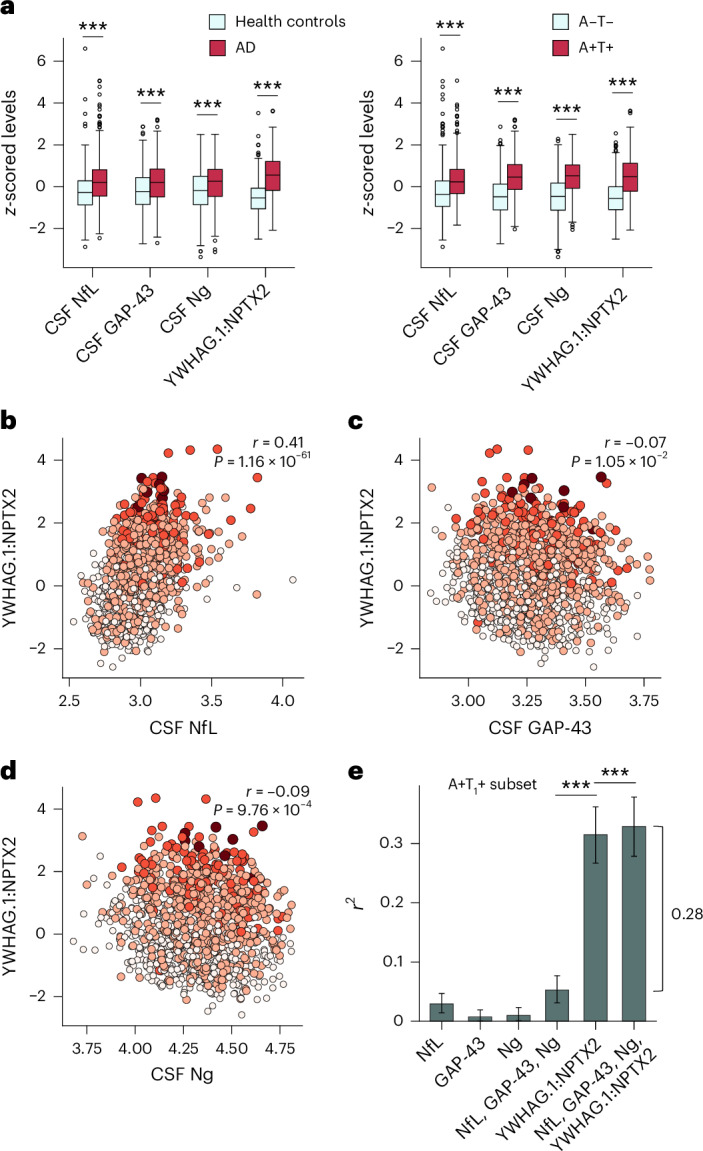
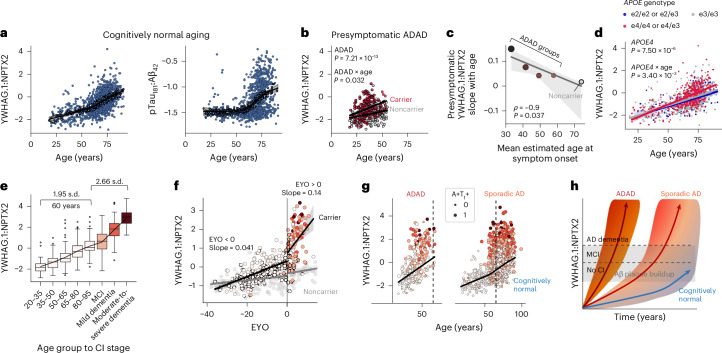
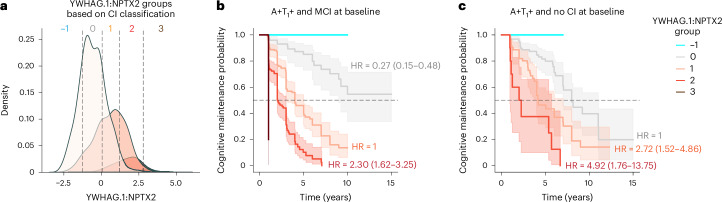
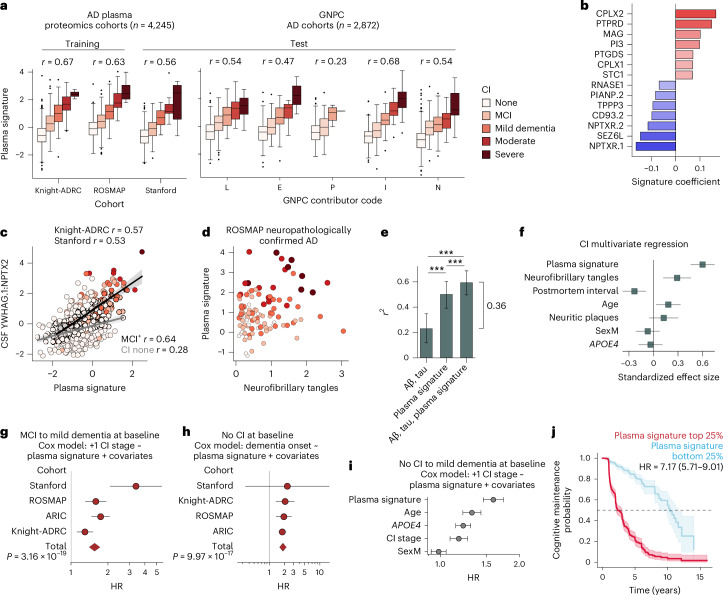
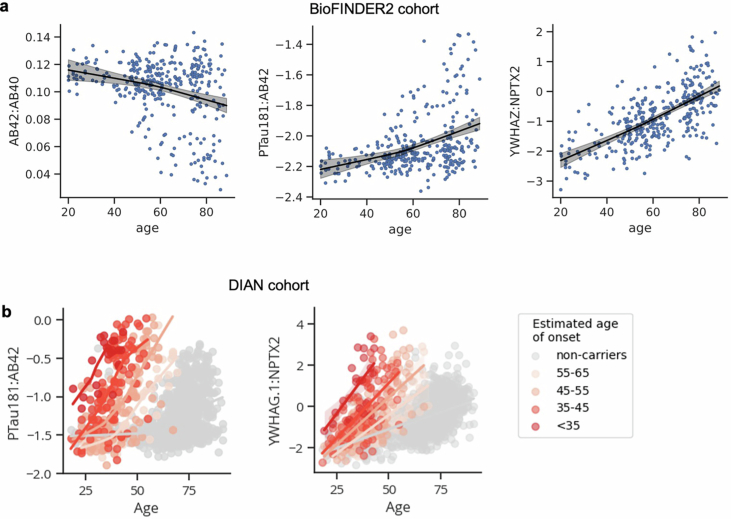
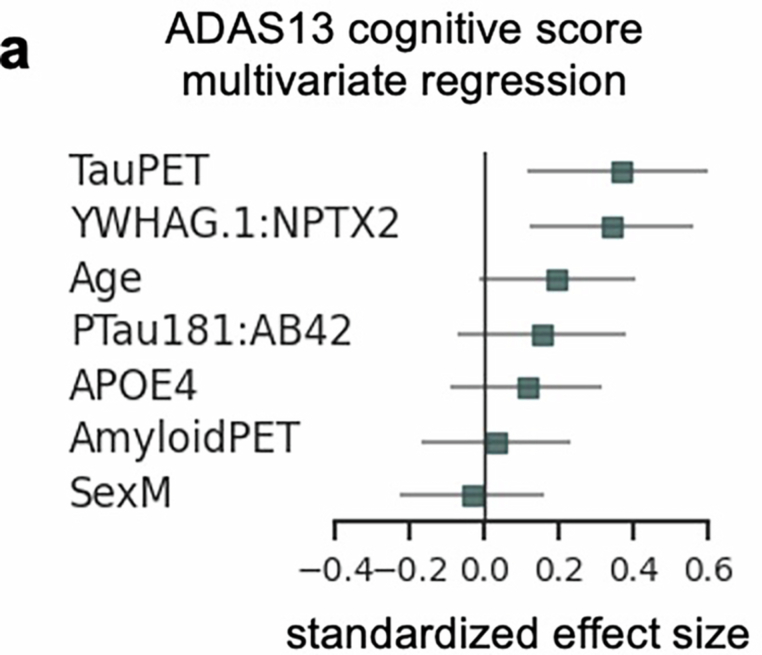
Rates of cognitive decline in Alzheimer's disease (AD) are extremely heterogeneous. Although biomarkers for amyloid-beta (Aβ) and tau proteins, the hallmark AD pathologies, have improved pathology-based diagnosis, they explain only 20-40% of the variance in AD-related cognitive impairment (CI). To discover novel biomarkers of CI in AD, we performed cerebrospinal fluid (CSF) proteomics on 3,397 individuals from six major prospective AD case-control cohorts. Synapse proteins emerged as the strongest correlates of CI, independent of Aβ and tau. Using machine learning, we derived the CSF YWHAG:NPTX2 synapse protein ratio, which explained 27% of the variance in CI beyond CSF pTau181:Aβ42, 11% beyond tau positron emission tomography, and 28% beyond CSF neurofilament, growth-associated protein 43 and neurogranin in Aβ+ and phosphorylated tau+ (A+T1+) individuals. CSF YWHAG:NPTX2 also increased with normal aging and 20 years before estimated symptom onset in carriers of autosomal dominant AD mutations. Regarding cognitive prognosis, CSF YWHAG:NPTX2 predicted conversion from A+T1+ cognitively normal to mild cognitive impairment (standard deviation increase hazard ratio = 3.0, P = 7.0 × 10⁻⁴) and A+T1+ mild cognitive impairment to dementia (standard deviation increase hazard ratio = 2.2, P = 8.2 × 10⁻¹⁶) over a 15-year follow-up, adjusting for CSF pTau181:Aβ42, CSF neurofilament, CSF neurogranin, CSF growth-associated protein 43, age, APOE4 and sex. We also developed a plasma proteomic signature of CI, which we evaluated in 13,401 samples, which partly recapitulated CSF YWHAG:NPTX2. Overall, our findings underscore CSF YWHAG:NPTX2 as a robust prognostic biomarker for cognitive resilience versus AD onset and progression, highlight the potential of plasma proteomics in replacing CSF measurement and further implicate synapse dysfunction as a core driver of AD dementia.


Conflict of interest statement

Competing interests: T.W-C. and H.S.-H.O. are cofounders and scientific advisers of Teal Omics and have received equity stakes. C.C. has received research support from GSK and Eisai. C.C. is a member of the scientific advisory board of Circular Genomics and owns stocks. C.C. is a member of the scientific advisory board of ADmit. C.C. and M.A. have an invention disclosure for AT1 prediction models, including protein IDs, weights, cutoffs and algorithms. O.H. has acquired research support (for the institution) from AVID Radiopharmaceuticals, Biogen, C2N Diagnostics, Eli Lilly, Eisai, Fujirebio, GE Healthcare and Roche. In the past 2 years, he has received consultancy and speaker fees from ALZpath, BioArctic, Biogen, Bristol Myers Squibb, Eisai, Eli Lilly, Fujirebio, Merck, Novartis, Novo Nordisk, Roche, Sanofi and Siemens. H.Z. has served at scientific advisory boards or as a consultant for Abbvie, Acumen, Alector, Alzinova, ALZPath, Amylyx, Annexon, Apellis, Artery Therapeutics, AZTherapies, Cognito Therapeutics, Cognition Therapeutics, Denali, Eisai, Labcorp, Merry Life Biomedical, NervGen Pharma, Novo Nordisk, OptoCeutics, Passage Bio, Pinteon Therapeutics, Prothena, Red Abbey Labs, reMYND, Roche, Samumed, Siemens Healthineers, Triplet Therapeutics and Wave, has given lectures in symposia sponsored by AlzeCure, Biogen, Cellectricon, Fujirebio, Lilly, Novo Nordisk and Roche, and is a cofounder of Brain Biomarker Solutions in Gothenburg, which is a part of the GU Ventures Incubator Program (outside the submitted work). The other authors declare no competing interests.

Figures

Fig. 1
Fig. 1. The CSF YWHAG:NPTX2 ratio explains a substantial proportion of variance in CI beyond amyloid and tau in AD.
a, Study design. Integration of CSF proteomics, AD pathology biomarkers and clinical cognitive scoring from six independent cohorts to identify the molecular correlates of CI, independently of AD pathology. b, Volcano plot showing the change with CI independent of age, sex, cohort, APOE4 dose and pTau181:Aβ42, and PC1 of the CSF proteome, in the Knight-ADRC and ADNI cohorts (n = 1,472). Bold indicates synapse proteins based on the SynGO database; q values are Benjamini–Hochberg-corrected P values. c, Rank-based pathway enrichment heatmap of differentially abundant proteins. Cells are color-coded according to − log10(q). d, A penalized linear model was trained to predict CI severity using synaptic proteins that significantly changed with CI. RFE showed that two proteins sufficiently captured 83% of the full model performance. Model coefficients show the normalized ratio between YWHAG.1 and NPTX2. e, Box plot showing YWHAG.1:NPTX2 versus CI severity across cohorts with the SomaScan data (n = 2,067). The box bounds are the Q1, median and Q3; the whiskers show Q1 − 1.5× the interquartile range (IQR) and Q3 + 1.5× the IQR. f, CSF YWHAG.1:NPTX2 regressed against age, CI, sex and cohort in a linear model (n = 2,067). The points and error bars represent the standardized effect sizes and 95% confidence intervals. g, AUC results from the logistic regression to classify CI stage based on YWHAG.1:NPTX2 or pTau181:Aβ42. All SomaScan cohorts are included (n = 2,067). h, YWHAG.1:NPTX2 versus pTau181:Aβ42, color-coded according to CI. Linear correlation and P value are shown. i, r2 results from a linear model regressing CI against covariates displayed on the x axis in A+T1+ individuals (n = 898). The difference in r2 values between the full model and the model with only pTau181:Aβ42 is shown. j, As in h but for YWHAZ:NPTX2 versus tau PET in Aβ+ individuals in BioFINDER2. k, As in i but with different covariates in BioFINDER2 (n = 512). The difference of r2 values between the full model and the model with only Aβ42:Aβ40 + tau PET is shown. The bars and error bars in g, i and k represent bootstrapped (n = 1,000) means and 95% confidence intervals. Two-sided P values were calculated using the empirical distribution of the bootstrapped test statistic. **P < 0.01, ***P < 0.001. Graphics in a created with BioRender.com.
Fig. 2
Fig. 2. CSF YWHAG:NPTX2 versus established neurodegeneration AD biomarkers.
a, Levels of CSF NfL, GAP-43, Ng and YWHAG.1:NPTX2 between AD and healthy and A+T1+ and A–T1− in the Knight-ADRC and ADNI cohorts are shown. ***P < 0.001 based on a standard two-sided t-test. The box bounds show the Q1, median and Q3; the whiskers show the Q1 − 1.5× the IQR and Q3 + 1.5× the IQR. b, Linear correlation and P value between CSF YWHAG.1:NPTX2 and CSF NfL in the Knight-ADRC and ADNI cohorts. The colors indicate the CI stage as shown in Fig. 1e. c, As in b but for CSF GAP-43. d, As in b but for CSF Ng. e, r2 results from linear models regressing CI against covariates displayed on the x axis in the Knight-ADRC and ADNI cohorts (n = 1,472). The bars and error bars represent bootstrapped (n = 1,000) means and 95% confidence intervals. Two-sided P values were calculated using the empirical distribution of the bootstrapped test statistic. The difference in r2 values between the full model and the model with NfL, GAP-43 and Ng is shown. ***P < 0.001.
Fig. 3
Fig. 3. CSF YWHAG:NPTX2 ratio increases with normal aging and presymptomatic ADAD.
a, Changes with age of YWHAG.1:NPTX2 and pTau181:Aβ42 in cognitively normal non-ADAD mutation carriers. Locally weighted scatterplot smoothing regression lines with 95% confidence intervals are shown. b, Changes with age of YWHAG.1:NPTX2 in cognitively normal individuals aged under 55 years stratified according to ADAD mutation carrier status. P values from a linear model regressing YWHAG.1:NPTX2 against ADAD carrier status, age and their interaction are shown. Linear regression lines with 95% confidence intervals for carriers versus noncarriers are shown. c, Association between mean EAO and slope of YWHAG.1:NPTX2 change with age. Spearman correlation and P value are shown. Data from noncarriers are shown for comparison. The linear regression line with the 95% confidence intervals is shown. d, Changes with age of YWHAG.1:NPTX2 in cognitively normal non-ADAD mutation carriers stratified according to APOE genotype. P values from a linear model regressing YWHAG.1:NPTX2 against APOE4 dose, age and their interaction are shown. Linear regression lines with 95% confidence intervals for specified APOE genotypes are shown. e, Box plot showing changes in YWHAG.1:NPTX2 across different age groups and CI stages (n = 1,846). The box bounds show the Q1, median and Q3; the whiskers show Q1 − 1.5× the IQR and Q3 + 1.5× the IQR; s.d. changes in YWHAG.1:NPTX2 with cognitively normal aging and cognitive decline are shown. f, Changes with estimated years to symptom onset (EYO) of YWHAG.1:NPTX2 stratified according to ADAD carrier status. ADAD carrier points are color-coded according to CI stage as in Fig. 1e. Linear regression lines with 95% confidence intervals for carriers versus noncarriers before and after estimated symptom onset are shown. Slopes for carriers are shown. g, Changes with age and CI stage of YWHAG.1:NPTX2 for all individuals. Points are color-coded according to CI stage as in Fig. 1e and sized according to Aβ positivity. h, Schematic of proposed model showing that changes in YWHAG.1:NPTX2 with cognitively normal aging underlie age at AD onset.
Fig. 4
Fig. 4. CSF YWHAG:NPTX2 ratio predicts future tau accumulation and cognitive decline beyond Aβ, tau, NfL, GAP-43 and Ng.
a, ADNI cohort analyses for bd, correlating baseline CSF YWHAG.1:NPTX2 and pTau181:Aβ42 with future amyloid and tau PET imaging and cognitive scoring data. b, Future tau PET (global standardized uptake value ratio (SUVR)) versus future amyloid PET (global centiloid), color-coded according to the percentiles of YWHAG.1:NPTX2. Linear regression lines with 95% confidence intervals for specified YWHAG.1:NPTX2 percentiles are shown. c, Future ADAS13 cognitive score versus future tau PET (global SUVR) color-coded according to the percentiles of YWHAG.1:NPTX2 in Aβ+ individuals. d, r2 results from linear models regressing CI against covariates displayed on the x axis (n = 70). The bars and error bars represent bootstrapped (n = 1,000) means and 95% confidence intervals. Two-sided P values were calculated via the empirical distribution of the bootstrapped test statistic. The difference between r2 values between the two models is shown. ***P < 0.001. e, ADNI, Knight-ADRC and Stanford analyses for fk, associating baseline CSF YWHAG.1:NPTX2 with future cognitive decline. f, Cox proportional hazards regression was used to associate YWHAG.1:NPTX2 with future cognitive decline in A+T1+ individuals with MCI to mild dementia, while adjusting for pTau181:Aβ42, CSF NfL, CSF Ng, APOE4, age, sex and CI stage. Results from a cross-cohort, fixed effects meta-analysis is shown (total n = 520). The points and error bars represent HRs and 95% confidence intervals. g, As in f but for predicting dementia onset in A+T1+ cognitively normal individuals (total n = 171). CI stage was not included as a covariate because all individuals were cognitively normal. h, Cox proportional hazards regression was used to associate YWHAG.1:NPTX2 with future cognitive decline in A+T1+ individuals, while adjusting for pTau181:Aβ42, CSF NfL, CSF Ng, APOE4, age, sex and CI stage in the combined sample (n = 697). The points and error bars represent the HRs and 95% confidence intervals for each covariate. i, Kaplan–Meier curves with 95% confidence intervals showing the rates of future cognitive decline in A+T1+ versus A–T1− individuals. The HR and 95% confidence intervals is shown. j, As in i but for YWHAG.1:NPTX2high (top 25th percentile) versus YWHAG.1:NPTX2low (bottom 25th percentile) individuals. k, As in i but for A+T1+ YWHAG.1:NPTX2high versus A–T1− YWHAG.1:NPTX2low individuals. Graphics in a and e created with BioRender.com.
Fig. 5
Fig. 5. Defined YWHAG:NPTX2 groups predict future cognitive resilience versus decline.
a, YWHAG.1:NPTX2 subgroups were defined using logistic regression to predict CI stage in individuals in adjacent CI stages. The Youden index was used to define cutoffs. Moderate and severe dementia were combined because of the limited sample size. An additional −1 group was defined based on 95% sensitivity in the model classifying MCI versus cognitively normal. The colors of the distributions indicate the CI stage as shown in Fig. 1e. b, Kaplan–Meier curves with 95% confidence intervals showing the probabilities of cognitive maintenance (no change in CI stage) among MCI A+T1+ individuals (Knight-ADRC and ADNI cohorts) stratified according to the YWHAG.1:NPTX2 groups. HRs and 95% confidence intervals from a cross-cohort, fixed effects meta-analysis comparing groups to the ‘correctly’ classified group, adjusted for pTau181:Aβ42, CSF NfL, CSF Ng, age, APOE4 and sex are shown (total n = 397). c, As in b but in cognitively normal A+T1+ individuals (total n = 168). CI stage was not included as a covariate because all individuals were cognitively normal.
Fig. 6
Fig. 6. The plasma proteomic signature of CI partly recapitulates the CSF YWHAG:NPTX2 ratio, predicting AD onset and progression.
a, Box plot showing plasma signature versus CI severity across cohorts (total n = 6,301). The box represent the Q1, median and Q3; the whiskers show Q1 − 1.5× the IQR and Q3 + 1.5× the IQR. Pearson correlations are shown. b, Protein coefficients for the plasma signature. c, Correlations between the plasma signature and CSF YWHAG.1:NPTX2 in the Knight-ADRC and Stanford cohorts (n = 518). The colors indicate the CI stage as shown in a. Linear regression lines with 95% confidence intervals for cognitively normal versus cognitively impaired individuals are shown. d, Plasma signature versus neurofibrillary tau tangle load in the ROSMAP cohort, color-coded according to CI as in a. e, r2 values from linear models regressing CI against covariates displayed on the x axis in the ROSMAP cohort (n = 110). The bars and error bars represent bootstrapped (n = 1,000) means and 95% confidence intervals. Two-sided P values were calculated via the empirical distribution of the bootstrapped test statistic. The difference in r values between the two models is shown. ***P < 0.001. f, Results from a multivariate linear model regressing CI against the displayed covariates in the ROSMAP cohort (n = 110). The points and error bars represent the standardized effect size and 95% confidence interval. g, Cox proportional hazards regression was used to associate the plasma signature with future cognitive decline in individuals with MCI to mild dementia, while adjusting for APOE4, age, sex and CI stage. The results from a cross-cohort, fixed effects meta-analysis are shown (total n = 1,877). The points and error bars represent the HRs and 95% confidence intervals. h, As in g but for predicting dementia onset in cognitively normal individuals (total n = 4,753). CI stage was not included as a covariate because all individuals were cognitively normal. i, Cox proportional hazards regression was used to associate the plasma signature with future cognitive decline in all individuals across the Knight-ADRC, ROSMAP and Stanford cohorts, while adjusting for APOE4, age, sex and CI stage (n = 2,292). The points and error bars represent the HRs and 95% confidence intervals for each covariate. j, Kaplan–Meier curves with 95% confidence intervals showing the rates of future cognitive decline in plasma signaturehigh (top 25th percentile) versus plasma signaturelow (bottom 25th percentile) individuals. HR and 95% confidence interval are shown.
Extended Data Fig. 1
Extended Data Fig. 1. CSF YWHAG:NPTX2 ratio versus PTau181:Aβ42 and cognitive impairment.
a, Global cognition score versus tau tangle load in Aβ + individuals in the ROSMAP cohort. Aβ and tau do not sufficiently explain cognitive impairment. b, Scatterplot showing both change with cognitive impairment independent of PTau181:Aβ42 (y-axis) and association with PTau181:Aβ42 (x-axis). Axes show signed –log10 q-values (Benjamini-Hochberg adjusted p-value) from linear regression models. Bold indicates synapse proteins based on SynGO database. c, Scatterplot showing PC1-adjusted YWHAG.1 (left) and NPTX2 (right) versus PTau181:Aβ42, colored by cognitive impairment. Correlation and p-value are shown. d, Boxplot showing YWHAG.1:NPTX2 versus cognitive impairment severity across cohorts with SomaScan data per biological sex (male n = 1,024, female n = 1043). Box bounds are Q1, median, and Q3, and whiskers show Q1 − 1.5×IQR and Q3 + 1.5×IQR. Pearson correlations per cohort are shown. e, As in d, but for PTau181:Aβ42 (male n = 1,024, female n = 1043). f, Results from binary logistic regression models classifying CI stage based on YWHAG.1:NPTX2 or PTau181:AB42. AUC, accuracy, sensitivity, and specificity are shown (total n = 2,067). Bars and error bars represent bootstrapped (n = 1,000) means and 95% confidence intervals. Two-sided p-values were calculated via the empirical distribution of the bootstrapped test statistic. *p < 0.05, **p < 0.01, ***p < 0.001. g, Receiver operating curve (ROC) for classification of mild/moderate/severe dementia versus cognitively normal is shown.
Extended Data Fig. 2
Extended Data Fig. 2. CSF YWHAG:NPTX2 ratio explains a substantial proportion of variance in cognitive impairment beyond amyloid and tau in AD.
a, Stacked bar plot showing proportions of different cognitive impairment stages among different YWHAG.1:NPTX2 percentile groups, in all and each cohort. b, Results from linear models regressing cognitive impairment against the displayed covariates, per cohort (total n = 2,150). Points and error bars represent effect sizes and 95% confidence intervals. c, Scatterplot showing YWHAZ versus YWHAG.1, colored by cognitive impairment (top). Scatterplot showing YWHAZ:NPTX2 versus YWHAG.1:NPTX2, colored by cognitive impairment (bottom). d, R-squared values from linear models regressing cognitive impairment against covariates displayed on x-axis (n = 2,067). The difference between r-squared values between two models is shown. ***p < 0.001. e, Boxplot showing YWHAZ:NPTX2 versus cognitive impairment severity based on mass-spectrometry data in BioFINDER2 (n = 829). Box bounds are Q1, median, and Q3, and whiskers show Q1 − 1.5×IQR and Q3 + 1.5×IQR. f, Results from a multivariate linear model regressing cognitive impairment against the displayed covariates in BioFINDER2 (n = 512). Points and error bars represent standardized effect sizes and 95% confidence intervals. g, R-squared values from linear models regressing cognitive impairment against covariates displayed on x-axis in BioFINDER2 (n = 512). The difference between r-squared values between different models are shown. ***p < 0.001. Colors in a,c,e indicate cognitive impairment stage as shown in Fig. 1e. Bars and error bars in d and g represent bootstrapped (n = 1,000) means and 95% confidence intervals. Two-sided p-values were calculated via the empirical distribution of the bootstrapped test statistic.
Extended Data Fig. 3
Extended Data Fig. 3. Changes in CSF YWHAG:NPTX2 with normal aging and ADAD.
a, Changes in CSF Aβ42:Aβ40, PTau181:Aβ42, and YWHAG.1:NPTX2 with cognitively normal aging in the BioFINDER2 cohort. Lowess regression lines with 95% confidence intervals are shown. b, Changes in CSF PTau181:Aβ42, and YWHAG.1:NPTX2 with age in ADAD mutation carriers, binned by estimated age of onset, in the DIAN cohort. Lowess regression (left) and linear regression (right) lines are shown.
Extended Data Fig. 4
Extended Data Fig. 4. CSF YWHAG:NPTX2 association with future cognitive impairment independent of tau PET.
a, Results from a multivariate linear model regressing future ADAS13 cognitive score against the displayed covariates in BioFINDER2 (n = 70). PET data are from same time point as the cognitive score. YWHAG.1:NPTX2 and PTau181:Aβ42 was measured 4-15 years before PET. Points and error bars represent standardized effect sizes and 95% confidence intervals.
Extended Data Fig. 5
Extended Data Fig. 5. Defined YWHAG:NPTX2 groups for prediction of future cognitive decline, meta-analysis.
a, Cox proportional hazard regression was used to associate YWHAG.1:NPTX2 groups with future cognitive decline in A + T1 + MCI individuals, while adjusting for PTau181:Aβ42, CSF NfL, CSF Ng, APOE4, age, and sex. Group 1 was the reference group. Results from a cross-cohort fixed-effect meta-analysis are shown (total n = 397). Points and error bars represent hazard ratios and 95% confidence intervals. b, As in a, but for A + T1+ cognitively normal individuals (total n = 168). Group 0 was the reference group.

References

    1. Knopman, D. S. et al. Alzheimer disease. Nat. Rev. Dis. Primers7, 33 (2021). - PMC - PubMed
    1. Dujardin, S. et al. Tau molecular diversity contributes to clinical heterogeneity in Alzheimer’s disease. Nat. Med.26, 1256–1263 (2020). - PMC - PubMed
    1. Ossenkoppele, R. et al. Amyloid and tau PET-positive cognitively unimpaired individuals are at high risk for future cognitive decline. Nat. Med.28, 2381–2387 (2022). - PMC - PubMed
    1. Strikwerda-Brown, C. et al. Association of elevated amyloid and tau positron emission tomography signal with near-term development of Alzheimer disease symptoms in older adults without cognitive impairment. JAMA Neurol.79, 975–985 (2022). - PMC - PubMed
    1. Zetterberg, H. & Bendlin, B. B. Biomarkers for Alzheimer’s disease—preparing for a new era of disease-modifying therapies. Mol. Psychiatry.26, 296–308 (2021). - PMC - PubMed

Grants and funding