. 2025 Jun;31(6):2044-2053.
doi: 10.1038/s41591-025-03617-7. Epub 2025 Mar 31.

Plasma MTBR-tau243 biomarker identifies tau tangle pathology in Alzheimer's disease

Affiliations

Plasma MTBR-tau243 biomarker identifies tau tangle pathology in Alzheimer's disease

Kanta Horie et al. Nat Med. 2025 Jun.

Abstract

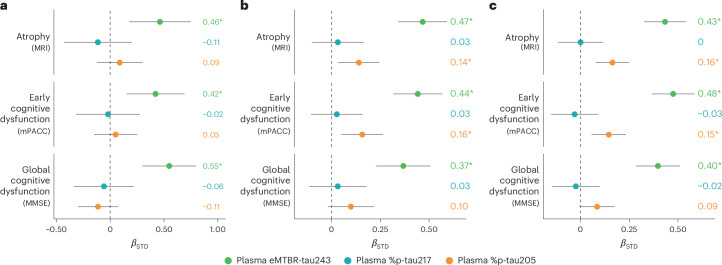
Insoluble tau aggregates within neurofibrillary tangles are a defining neuropathological feature of Alzheimer's disease (AD) and closely correlate with clinical symptoms. Although tau pathology can be assessed using tau positron emission tomography, a more accessible biomarker is needed for diagnosis, prognosis and tracking treatment effects. Here we present a new plasma tau species, the endogenously cleaved, microtubule-binding region containing residue 243 (eMTBR-tau243), which specifically reflects tau tangle pathology. Across the AD spectrum in three different cohorts (n = 108, 55 and 739), plasma eMTBR-tau243 levels were significantly elevated at the mild cognitive impairment stage and increased further in dementia. Plasma eMTBR-tau243 showed strong associations with tau positron emission tomography binding (β = 0.72, R2 = 0.56) and cognitive performance (β = 0.60, R2 = 0.40), outperforming other plasma tau (%p-tau217 and %p-tau205) biomarkers. These results suggest that plasma eMTBR-tau243 may be useful for estimating the tauopathy load in AD, thereby improving the diagnostic evaluation of AD in clinical practice and monitoring the efficacy of tau-targeted therapies in clinical trials.


Conflict of interest statement

Competing interests: K.H. is an Eisai-sponsored voluntary research associate professor at Washington University and has received a salary from Eisai. Washington University, R.J.B. and D.M.H. have equity ownership interest in C2N Diagnostics. R.J.B. and D.M.H. receive income from C2N Diagnostics for serving on the scientific advisory board. K.H., N.R.B., C.S. and R.J.B. may receive income based on technology (Methods to detect MTBR tau isoforms and use thereof; PCT/US2020/046224) licensed by Washington University to C2N Diagnostics. K.H., H.J., D.M.H. and R.J.B. may receive income based on technology (Anti-tau MTBR antibodies and methods to detect endogenously cleaved fragments of tau and uses thereof; PCT/US2023/072738) licensed by Washington University to C2N Diagnostics. R.J.B. is an unpaid scientific advisory board member of Roche and Biogen, and receives research funding from Avid Radiopharmaceuticals, Janssen, Roche or Genentech, Eli Lilly, Eisai, Biogen, AbbVie, Bristol Myers Squibb and Novartis. O.H. is an employee of Eli Lilly and Lund University and has previously acquired research support (for Lund University) from AVID Radiopharmaceuticals, Biogen, C2N Diagnostics, Eli Lilly, Eisai, Fujirebio, GE Healthcare and Roche. In the past 2 years, he has received consultancy or speaker fees from ALZpath, BioArctic, Biogen, Bristol Meyer Squibb, Eisai, Eli Lilly, Fujirebio, Merck, Novartis, Novo Nordisk, Roche, Sanofi and Siemens. S.E.S. has served on scientific advisory boards or given lectures for Eisai, Eli Lilly and Novo Nordisk. D.M.H. is on the scientific advisory board of Genentech, Denali and Cajal Neurosciences and Switch, and consults for Asteroid and Roche. S.P. has acquired research support (for the institution) from ki elements or ADDF and Avid. In the past 2 years, he has received consultancy or speaker fees from BioArctic, Biogen, Eisai, Lilly, Novo Nordisk and Roche. The other authors declare no competing interests.

Figures

Fig. 1
Fig. 1. Plasma biomarker levels by diagnostic group in the validation cohort demonstrate that plasma eMTBR-tau243 is highly specific for AD compared with other neurodegenerative diseases.
ac, Plasma levels of eMTBR-tau243 (a), %p-tau217 (b) and %p-tau205 (c) by clinical diagnosis and Aβ status in the main BioFINDER-2 cohort (n = 739). Statistical differences were assessed using ANCOVA adjusted for age and sex followed by Tukey’s corrected, post hoc pairwise comparisons (two-sided analysis). Dots are gray color coded to indicate tau-PET negativity in the global (Braak I–VI) ROIs whereas white color-coded dots indicate tau-PET data that are not available and other color-coded dots indicate tau-PET positivity. MAPT R406W mutation carriers are shown in pink (one FTD who is tau-PET positive and one MCI who is tau-PET negative). Plasma thresholds were derived using Gaussian mixture modeling. Percentage of Aβ- and tau-positive individuals are included in each group. Aβ status was assessed using CSF Aβ42/40 or Aβ-PET and tau status with a global tau-PET (SUVR > 1.22). Boxplots summarize data distribution, showing the median (central line), interquartile range (IQR; box) and whiskers extending to 1.5 × the IQR. Boxplots are displayed only for diagnostic groups with ten or more participants. Specific P values can be found in Supplementary Table 3. *P < 0.05, **P < 0.01, ***P < 0.001.
Fig. 2
Fig. 2. Association of plasma tau biomarkers with tau-PET in the validation cohort.
ac, Plots including only tau-PET-positive individuals (a, n = 172), Aβ-positive individuals (b, n = 436) and all participants (c, n = 649). Plasma thresholds were derived using Gaussian mixture modeling. We used previously validated cutoffs for global tau-PET (SUVR > 1.22). Dots are gray color coded to indicate the global tau-PET negativity whereas other color-coded dots indicate tau-PET positivity. MAPT R406W mutation carriers are shown in pink outline. The percentage of individuals in each of the four quadrants is displayed. Standardized β values from linear regression analyses, adjusted for age and sex, are also shown. Locally estimated scatterplot smoothing trend lines (solid black) with 95% CIs (shaded area) illustrate data tendencies. All tests were two sided. All P values were <0.001. ***P < 0.001.
Fig. 3
Fig. 3. Relative associations of plasma biomarkers with continuous tau-PET measures in the validation cohort demonstrate most of the differences in tau-PET that are attributed to plasma eMTBR-tau243.
Forest plots display standardized β (colored dots) (βSTD), representing effect size to compare the relative importance of each biomarker, along with 95% CIs (black lines) from a multivariate model including all three plasma biomarkers as predictors. ac, Analyses shown for tau-PET-positive individuals (a, n = 172), Aβ-positive individuals (b, n = 436) and all participants (c, n = 649). Outcomes are listed on the left. Models also included age and sex as covariates. Vertical dashed lines show 0. Asterisks represent significant effect (P < 0.05) for each biomarker and model. Aβ status was assessed using CSF Aβ42/40 or Aβ-PET and tau status using global tau-PET (SUVR > 1.22). All tests were two sided. Specific P values can be found in Supplementary Table 5. interm., intermediate.
Fig. 4
Fig. 4. Accuracy of assessing Aβ and tau-PET status by region in the validation cohort demonstrates superior performance of plasma eMTBR-tau243 over %p-tau217 and %p-tau205.
a, ROC curves for the three plasma biomarkers to assess tau-PET status in Aβ-positive individuals (n = 436). AUCs are included in the figure and asterisks represent significantly different AUCs from that of plasma eMTBR-tau243. b, AUCs (dots) and 95% CIs (black lines) for all PET status outcomes (listed on the left) shown for each plasma biomarker (color coded) in Aβ-positive individuals (n = 436). c, The same analysis presented for all participants (n = 649 for tau-PET and n = 483 for Aβ-PET). Asterisks represent significantly different (P < 0.05) AUCs from that of plasma eMTBR-tau243, assessed using the DeLong test. All tests were two sided. Specific P values can be found in Supplementary Table 6.
Fig. 5
Fig. 5. Relative associations of plasma biomarkers and brain atrophy and cognition in the validation cohort.
Forest plots represent standardized β (colored dots) (βSTD) and 95% CI (black lines) from a multivariate model including all three plasma biomarkers as predictors. ac, Analysis shown for tau-PET-positive individuals (a, cortical thickness: n = 159; early cognitive dysfunction: n = 143; global cognitive dysfunction: n = 160), Aβ-positive individuals (b, cortical thickness: n = 413; early cognitive dysfunction: n = 445; global cognitive dysfunction: n = 481) and all participants (c, cortical thickness: n = 522; early cognitive dysfunction: n = 556; global cognitive dysfunction: n = 593). Outcomes are listed on the left. Models were adjusted for age and sex (and education for cognitive outcomes). Vertical dashed lines indicate 0. Asterisks represent significant effect (P < 0.05) for each biomarker and model. Aβ status was assessed using CSF Aβ42/40 or Aβ-PET and tau status using global tau-PET (SUVR > 1.22). All tests were two sided.
Extended Data Fig. 1
Extended Data Fig. 1. Plasma eMTBR-tau243 changes by diagnosis and correlations with CSF MTBR-tau243 in the two pilot cohorts.
a,c, Levels of plasma eMTBR-tau243 by clinical diagnosis and Aβ status in the pilot BioFINDER-2 cohort (n = 108) (a) and the pilot Knight ADRC cohort (n = 55) (c). Differences in plasma eMTBR-tau243 levels by diagnostic groups were tested using ANOVA and the post hoc analyses were performed two-sided using. Boxplots summarize data distribution, showing the median (central line), interquartile range (box), and whiskers extending to 1.5 times the interquartile range. *, p < 0.05; **, p < 0.01; ***, p < 0.001. b,d, Associations between CSF MTBR-tau243 and plasma eMTBR-tau243 in BioFINDER-2 cohort (n = 108) (b) and the Knight ADRC cohort (n = 55) (d). CSF MTBR-tau243 in BioFINDER-2 and the Knight ADRC cohorts were analyzed by the previously reported immunoprecipitation method and the chemical extraction method, respectively. In the pilot BioFINDER-2 cohort, green dots color indicates global tau-PET positivity. In the pilot Knight-ADRC cohort, green dots color indicates Aβ-status positivity. For the scatter plots, linear regression lines (solid black) with 95% confidence intervals (shaded area) are also shown. All tests were two-sided. BioFINDER-2 pilot: AD+ vs. CU-: p < 0.001; AD+ vs. MCI + : p = 0.014; Knight-ADRC: AD+ vs CU-: p < 0.001; AD+ vs. CU + : p = 0.001; AD+ vs. very mild AD + : p = 0.005. Abbreviations: Aβ, amyloid β; AD + , Alzheimer’s disease dementia Aβ-positive; CU-, cognitively unimpaired Aβ-negative; CU + , cognitively unimpaired Aβ-positive; MCI + , mild cognitive impairment Aβ-positive; MTBR, microtubule-binding region.
Extended Data Fig. 2
Extended Data Fig. 2. Cross-correlation among plasma biomarkers in the validation cohort.
All individuals with available data are included in these plots. (a) Plasma %p-tau217 vs. eMTBR-tau243, (b) plasma %p-tau205 vs. eMTBR-tau243, and (c) plasma %p-tau217 vs. %p-tau205 are shown. Dots are gray-color-coded to indicate tau-PET negativity in the Global (Braak I-VI) regions of interests (ROI) while white-color-coded dots indicate tau-PET data are not available and other color-coded dots indicate tau-PET positivity. MAPT R406W mutation carriers are shown in pink (one FTD case and one MCI-). Plasma thresholds were derived using Gaussian mixture modelling. Percentage of individuals in each of the four quadrants are shown. Strength of correlation is shown using Spearman’s ρ. All tests were two-sided and all p-values < 0.001. ***p:<0.001. Abbreviations: FTD, frontotemporal dementia; MCI-, mild cognitive impairment without Aβ pathology.
Extended Data Fig. 3
Extended Data Fig. 3. Relationships between plasma and PET status.
Barplots represent the percentage of individuals that were classified in each of the four possible status using plasma and PET dichotomized values. (a) Global tau-PET in Aβ-positive participants and (b) Aβ-PET in all participants. Plasma thresholds were derived using Gaussian mixture modelling. We used previously validated cutoffs for PET (Aβ: >1.03 SUVR; tau: 1.22 SUVR). For eMTBR-tau243 in Aβ-positive participants, most individuals were negative both on tau-PET and eMTBR-tau243 (59.2%), followed by those positive for both (29.8%), with minimal discordance (tau-PET-positive/eMTBR-tau243-negative: 4.1%; tau-PET-negative/eMTBR-tau243-positive: 6.9%). In contrast, plasma %p-tau217 showed a higher proportion of individuals who were plasma-positive but tau-PET-negative (40.6%), indicating the order to see the abnormality of each tau measures. Abbreviation: SUVR, standardized uptake value ratio.
Extended Data Fig. 4
Extended Data Fig. 4. Association of plasma biomarkers and tau-PET in different regions in Aβ-positive individuals of the validation cohort.
Association of plasma biomarkers and tau-PET in early region (Braak I-II) (a, n = 436), intermediate region (Braak III-IV) (b, n = 436), and late region (Braak V-VI) (c, n = 436). Only Aβ-positive individuals are included in these plots. Dots are gray-color-coded to indicate tau-PET negativity in the Global (Braak I-VI) regions of interests (ROI) while other color-coded dots indicate tau-PET positivity. MAPT R406W mutation carriers are shown in pink. Plasma thresholds were derived using Gaussian mixture modelling. Tau-status was assessed using global tau-PET with a previously validated cutoff (SUVR > 1.22). The percentage of individuals in each of the four quadrants is displayed. Standardized β values from linear regression analyses, adjusted for age and sex, are also shown. LOESS trend lines (solid black) with 95% confidence intervals (shaded area) illustrate data tendencies. All tests were two-sided and all p-values < 0.001. ***p:<0.001. Abbreviations: LOESS, locally estimated scatterplot smoothing; SUVR, standardized uptake value ratio.
Extended Data Fig. 5
Extended Data Fig. 5. Association of plasma biomarkers and tau-PET in different regions in tau-PET-positive individuals of the validation cohort.
Association of plasma biomarkers and tau-PET in early region (Braak I-II) (a), intermediate region (Braak III-IV) (b), and late region (Braak V-VI) (c). Only Tau-PET-positive (in each respective region) individuals are included in these plots. Dots are gray-color-coded to indicate tau-PET negativity in the Global (Braak I-VI) regions of interests (ROI) while other color-coded dots indicate tau-PET positivity. MAPT R406W mutation carriers are shown in pink. Plasma thresholds were derived using Gaussian mixture modelling. Global tau-PET status was assessed using global tau-PET with a previously validated cutoff (SUVR > 1.22). The percentage of individuals in each of the four quadrants is displayed. Standardized β values from linear regression analyses, adjusted for age and sex, are also shown. LOESS trend lines (solid black) with 95% confidence intervals (shaded area) illustrate data tendencies. All tests were two-sided. All p-values were <0.001. ***p:<0.001. Abbreviations: LOESS, locally estimated scatterplot smoothing; SUVR, standardized uptake value ratio.
Extended Data Fig. 6
Extended Data Fig. 6. Association of plasma biomarkers and Aβ-PET in the validation cohort.
Only Aβ-positive individuals (a) and all individuals (b) with available data are included in the scatter plots. Dots are gray-color-coded to indicate tau-PET negativity in the Global (Braak I-VI) regions of interests (ROI) while other color-coded dots indicate tau-PET positivity. MAPT R406W mutation carriers are shown in pink. Plasma thresholds were derived using Gaussian mixture modelling. We used previously validated cutoffs for Aβ-PET (SUVR > 1.03). Tau-status was assessed using global tau-PET (SUVR > 1.22). The percentage of individuals in each of the four quadrants is displayed. Standardized β values from linear regression analyses, adjusted for age and sex, are also shown. LOESS trend lines (solid black) with 95% confidence intervals (shaded area) illustrate data tendencies. All tests were two-sided and all p-values < 0.001. ***p:<0.001. Abbreviations: LOESS, locally estimated scatterplot smoothing; SUVR, standardized uptake value ratio.
Extended Data Fig. 7
Extended Data Fig. 7. Multivariate analysis of association between plasma biomarkers and Aβ-PET in the validation cohort.
Forest plots represent standardized β (dot) and 95%CI (black lines) from a multivariate model including all three plasma biomarkers as predictors and continuous Aβ-PET as the outcome. The analyzed groups are listed on the left (Aβ-positive: n = 328; all: n = 483). Models were adjusted for age and sex. Vertical dotted lines indicate zero. Asterisks represent significant effect (p < 0.05) for each biomarker and model. Aβ-status was assessed using CSF Aβ42/40 or Aβ-PET. All tests were two-sided. Specific p-values can be found in Supplementary Table 5.
Extended Data Fig. 8
Extended Data Fig. 8. Association of plasma biomarkers with brain atrophy and cognition in Aβ-positive individuals of the validation cohort.
We show associations between each plasma biomarker and brain atrophy, as measured as cortical thickness (a), and early (b) and global (c) cognitive dysfunction, measured by mPACC and MMSE, respectively. Only Aβ-positive individuals are included in these plots. Dots are gray-color-coded to indicate tau-PET negativity in the Global (Braak I-VI) regions of interests (ROI) while other color-coded dots indicate tau-PET positivity. Tau-status was assessed using global tau-PET with a previously validated cutoff (SUVR > 1.22). Plasma thresholds were derived using Gaussian mixture modelling. Standardized β from linear regression analyses are also shown, adjusting for age and sex (and education for cognitive outcomes). Trend lines (solid black) with 95% confidence intervals (shaded area) from linear regression models illustrate data tendencies. All tests were two-sided and all p-values < 0.001. ***p:<0.001. Abbreviations: mPACC, modified preclinical Alzheimer’s cognitive composite; MMSE, Mini-Mental State Examination; SUVR, standardized uptake value ratio.
Extended Data Fig. 9
Extended Data Fig. 9. Association of plasma biomarkers with brain atrophy and cognition in tau-PET-positive individuals of the validation cohort.
We show associations between each plasma biomarker and atrophy (a), as measured as cortical thickness, and early (b) and global (c) cognitive dysfunction, measured by mPACC and MMSE, respectively. Only global tau-PET-positive individuals are shown here. Tau-status was assessed using global tau-PET with a previously validated cutoff (SUVR > 1.22). Plasma thresholds were derived using Gaussian mixture modelling. Standardized β from linear regression analyses are also shown, adjusting for age and sex (and education for cognitive outcomes). Linear regression lines (solid black) with 95% confidence intervals (shaded area) are also shown. All tests were two-sided. All p-values were <0.001. ***p:<0.001. Abbreviations: mPACC, modified preclinical Alzheimer’s cognitive composite; MMSE, Mini-Mental State Examination; SUVR, standardized uptake value ratio.

References

    1. van Dyck, C. H. et al. Lecanemab in early Alzheimer’s disease. N. Engl. J. Med.10.1056/NEJMoa2212948 (2022). - PubMed
    1. Sims, J. R. et al. Donanemab in early symptomatic Alzheimer disease: the TRAILBLAZER-ALZ 2 randomized clinical trial. JAMA330, 512–527 (2023). - PMC - PubMed
    1. Price, J. L. & Morris, J. C. Tangles and plaques in nondemented aging and ‘preclinical’ Alzheimer’s disease. Ann. Neurol.45, 358–368 (1999). - PubMed
    1. Ossenkoppele, R., van der Kant, R. & Hansson, O. Tau biomarkers in Alzheimer’s disease: towards implementation in clinical practice and trials. Lancet Neurol.21, 726–734 (2022). - PubMed
    1. Ossenkoppele, R. et al. Amyloid and tau PET-positive cognitively unimpaired individuals are at high risk for future cognitive decline. Nat. Med.28, 2381–2387 (2022). - PMC - PubMed

LinkOut - more resources