. 2025 Apr;57(4):884-896.
doi: 10.1038/s41588-025-02134-0. Epub 2025 Mar 31.

The complexity of tobacco smoke-induced mutagenesis in head and neck cancer

Affiliations

The complexity of tobacco smoke-induced mutagenesis in head and neck cancer

Laura Torrens et al. Nat Genet. 2025 Apr.

Abstract

Tobacco smoke, alone or combined with alcohol, is the predominant cause of head and neck cancer (HNC). We explore how tobacco exposure contributes to cancer development by mutational signature analysis of 265 whole-genome sequenced HNC samples from eight countries. Six tobacco-associated mutational signatures were detected, including some not previously reported. Differences in HNC incidence between countries corresponded with differences in mutation burdens of tobacco-associated signatures, consistent with the dominant role of tobacco in HNC causation. Differences were found in the burden of tobacco-associated signatures between anatomical subsites, suggesting that tissue-specific factors modulate mutagenesis. We identified an association between tobacco smoking and alcohol-related signatures, indicating a combined effect of these exposures. Tobacco smoking was associated with differences in the mutational spectra, repertoire of driver mutations in cancer genes and patterns of copy number change. Our results demonstrate the multiple pathways by which tobacco smoke can influence the evolution of cancer cell clones.


Conflict of interest statement

Competing interests: L.B.A. is a cofounder, chief scientific officer, scientific advisory member and consultant for io9, has equity and receives income. The terms of this arrangement have been reviewed and approved by the University of California, San Diego, in accordance with its conflict of interest policies. L.B.A. is also a compensated member of the scientific advisory board of Inocras. L.B.A.’s spouse is an employee of Biotheranostics. E.N.B. and L.B.A. declare a US provisional patent application filed with UCSD with serial numbers 63/289,601, 63/269,033 and 63/483,237. A.A. and L.B.A. declare a US provisional patent application filed with UCSD with serial number 63/366,392. L.B.A. also declares US provisional application 63/412,835 and international application PCT/US2023/010679 filed with UCSD and is also an inventor of a US Patent 10,776,718 for source identification by non-negative matrix factorization. All other authors declare no competing interests.

Figures
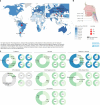
Fig. 1
Fig. 1. HNC incidence and epidemiological characteristics.
a, Incidence of HNC, sex-combined, ASRs per 100,000, data from GLOBOCAN 2022. Dots indicate countries included in this study and number of participating patients. Panel a adapted from ref. , © International Agency for Research on Cancer. Data version: GLOBOCAN 2022-08.02.2024. b, Anatomical subsites of HNC, with number of tumor samples indicated in brackets. Panel b created using BioRender.com. c, Known and suspected risk factors included in the study, based on epidemiological questionnaire data and HPV detection. Frequencies of risk factors in the complete dataset (left) and by anatomical subsite (right) are indicated. OC, oral cavity; OPC, oropharynx; HPX, hypopharynx; LYX, larynx.
Fig. 2
Fig. 2. Mutational signature landscape of HNC.
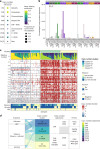
a, SBS, DBS and indel signatures extracted in 265 HNC tumors. The size of each dot represents the proportion of samples presenting each mutational signature in the whole HNC dataset and across anatomical subsites. The color represents the mean relative attribution of each signature. Dots filled in white indicate signatures without significantly different relative burdens across subsites. Significance was assessed using a two-sided Kruskal–Wallis test and Bonferroni correction. Top, the mutations per megabase attributed to each signature in samples with counts higher than zero. b, Mutational spectrum of undecomposed signatures extracted from HNC. c, Known SBS signatures of tobacco exposure identified in the HNC dataset. ROS, reactive oxygen species; HR, homologous recombination; DSB, double-strand break.
Fig. 3
Fig. 3. Tobacco-related signatures.
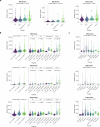
a, Mutational burdens of tobacco-related signatures in HNC cases sorted by subsite and tobacco status. The tumor mutational burden (TMB) per sample is also displayed. b, Mutational burdens for SBS, DBS and indel signatures showing significant positive associations with tobacco consumption (n = 265 biologically independent samples). The Kruskal–Wallis test (two-sided) was used to test for global differences. Box-and-whisker plots are in the style of Tukey. The line within the box is plotted at the median, while the upper and lower ends indicate the 25th and 75th percentiles. Whiskers show 1.5× the interquartile range (IQR). The y axes were cut at 1.25× upper whisker for clarity. Bar plots indicate the frequencies of dichotomized signatures. c, Percentage of driver mutations occurring in C>A contexts in LYX and OC HNC from smokers. d, SBS96-mutation spectrum of driver mutations in LYX and OC HNC from smokers, showing enrichment in the frequency of C>A driver mutations in LYX cases.
Fig. 4
Fig. 4. Association of tobacco use with incidence of HNC.
a, Association between ASR of HNC incidence and tobacco smoking per country and sex (n = 16) measured by linear regression analysis. Estimate of ASR of tobacco smoking prevalence was obtained from the WHO Global Health Observatory data repository (2019). b, Association between cigarette quantity smoked per day in the HNC dataset and ASR incidence per country, sex and subsite, adjusted for age (n = 265). c, Association of tobacco-related signatures with ASR incidence per country, sex and subsite, adjusted for age. Data are represented as average mutations attributed to tobacco-related SBS (SBS4, SBS92 and SBS_I), DBS (DBS2 and DBS6) and indel (ID3) mutational signatures per group. The number of cases per group and frequency of positive cases are indicated by size and color, respectively. For ac, 95% confidence interval is shown in clear blue. The P values shown correspond to ASR incidence in regressions across all data points with ASR of tobacco smoking (a), cigarette quantity (b) or mutation attributions (c) as explanatory variables.
Fig. 5
Fig. 5. Alcohol-related signatures.
a, Mutational burdens of tobacco-related signatures in HNC cases sorted by subsite, alcohol and tobacco status. TMB per sample is also displayed. b, Mutational burdens for SBS, DBS and indel signatures showing positive associations with the tobacco plus alcohol status (n = 265 biologically independent samples). The Kruskal–Wallis test (two-sided) was used to test for global differences. Pairwise comparisons with the tobacco plus alcohol group were assessed with Dunn’s test (P values are shown in gray). Box-and-whisker plots are in the style of Tukey. The line within the box is plotted at the median, while the upper and lower ends indicate the 25th and 75th percentiles. Whiskers show 1.5× IQR. The y axes were cut at 1.25× upper whisker for clarity. Bar plots indicate the frequencies of dichotomized signatures. c, Associations between alcohol-related mutational signatures and the combined tobacco and alcohol exposures measured by logistic regression analysis. Regressions were corrected for sex, age of diagnosis, anatomical subsite and region. The Bonferroni method was used to adjust P values for multiple hypothesis testing. Effect size (log2(OR), color) and significance level (−log10(adjusted P), size). Dots filled in white indicate nonsignificant associations (Bonferroni-adjusted P < 0.05). OR, odds ratio.
Fig. 6
Fig. 6. UV-related signatures in HNC.
a, Mutational burdens for mutational signatures related to UV light exposure showing positive associations with the HNC anatomical subsite (n = 265 biologically independent samples). The Kruskal–Wallis test (two-sided) was used to test for global differences. Box-and-whisker plots are in the style of Tukey. The line within the box is plotted at the median, while the upper and lower ends indicate the 25th and 75th percentiles. Whiskers show 1.5× IQR. Frequencies of positive samples in each category are indicated in bar plots. b, SBS, DBS and indel signature burdens in samples positive for UV exposure based on relative SBS7a–c contributions above 10% of relative mutational burdens. Samples are sorted by lip (inner, n = 3 or unspecified, n = 1), tongue and floor of the mouth location within the OC. Positive tobacco and alcohol status are indicated in black.
Fig. 7
Fig. 7. Copy number profile and copy number signature analysis in HNC.
a, Copy number signatures extracted in 242 HNC tumors. The size of each dot represents the proportion of samples presenting the signature, and the color represents the mean relative attribution of each signature. b, Copy number spectrum of the newly identified signature CN_G, defined by a 48 context copy number classification incorporating loss-of-heterozygosity status, total copy number state and segment length to categorize segments from allele-specific copy number profiles. c, Copy number profiles of HNC cases classified by copy number cluster. Relative signature burdens, copy number burden and associated epidemiological characteristics are indicated. The displayed epidemiological variables show significant differences by copy number cluster as per Fisher’s exact test and Benjamini–Hochberg procedure. d, Summary of exposures, driver alterations and copy number signatures associated with each cluster. Alluvial diagram depicts the frequency of each etiology in the copy number clusters. WGD, whole-genome duplication; CIN, chromosomal instability; LOH, loss of heterozygosity.
Extended Data Fig. 1
Extended Data Fig. 1. Mutational burdens in HNC.
ac, Mutational burdens for SBSs, DBSs and small InDels burdens by anatomical subsite (a), smoking status (b) and country (c). Moreover, b depicts the mutation burdens by smoking status in the whole HNC dataset (left) and across anatomical subsites (right). Kruskal–Wallis test (two-sided) was used to test for global differences. Box-and-whisker plots are in the style of Tukey. The line within the box is plotted at the median, while upper and lower ends indicate 25th and 75th percentiles. Whiskers show 1.5× interquartile range (IQR). Hypermutators defined as samples with mutation burdens above 100,000 for SBS (n = 4), 6,000 for DBS (n = 1) and 5,000 for InDels (n = 1) were removed from the analysis. OC, oral cavity; OPC, oropharynx; HPX, hypopharynx.
Extended Data Fig. 2
Extended Data Fig. 2. SBS signature decomposition.
Decomposed SBS signatures, including reference COSMIC signatures and signatures not decomposed into COSMIC reference signatures.
Extended Data Fig. 3
Extended Data Fig. 3. DBS and InDel signature decomposition.
Decomposed DBS (a) and InDel (b) signatures, including reference COSMIC signatures and signatures not decomposed into COSMIC reference signatures.
Extended Data Fig. 4
Extended Data Fig. 4. Evolutionary analysis of mutational signatures in HNC.
ac, Comparison of mutational signatures between early and late clonal mutations in HNC (n = 173), including tobacco and alcohol-related signatures enriched in early relative activities (a), signatures enriched in late relative activities (b) and undecomposed signatures (c). d,e, Relative activities of SBS_I in early and late clonal mutations across tobacco exposures (d) and anatomical subsites (e). In ae, lines show the change in relative activity between the early and late clonal mutations within a positive sample. Colored lines represent an activity change of more than 6% (blue indicates higher in the clonal early mutations; orange indicates higher in the clonal late mutations). The number of positive samples is represented in the title of each plot. Box-and-whisker plots are in the style of Tukey, and show the distribution of activities in samples where the signature was present in the early and/or late clonal mutations. The line within the box is plotted at the median, while upper and lower ends indicate 25th and 75th percentiles. Whiskers show 1.5× IQR. Significance was assessed using a two-sided Wilcoxon signed-rank test, and p values were corrected using the Benjamini–Hochberg procedure (q value). f, Associations between mutational signatures present in early and late mutations and tobacco smoking measured by logistic regression. The Bonferroni method was used to adjust P values for multiple hypothesis testing. Signatures with significant associations (adjusted p-value < 0.05) and odds ratio (OR) > 2 are colored. Regressions were corrected for sex, age of diagnosis, anatomical subsite, region and alcohol consumption. g, Associations between tobacco-related mutational signatures present in early and late mutations and anatomical site, measured by logistic regression. The Bonferroni method was used to adjust P values for multiple hypothesis testing. Effect size (log2(OR), color) and significance level (−log10(adjusted p-value), size). Dots filled in white indicate non-significant associations (adjusted p-value < 0.05). Regressions were corrected for sex, age of diagnosis, region, tobacco and alcohol consumption. LYX, larynx.
Extended Data Fig. 5
Extended Data Fig. 5. Association of mutational signatures with exposures and anatomical subsites.
a,b, Associations between mutational signatures and tobacco smoking (a) or alcohol consumption (b) measured by logistic regression. The Bonferroni method was used to adjust P values for multiple hypothesis testing. SBS, DBS and InDel signatures with significant associations (adjusted p-value < 0.05) and odds ratio (OR) > 2 are colored. Regressions were corrected for sex, age of diagnosis, anatomical subsite, region and alcohol or tobacco consumption. c, Associations between tobacco-related mutational signatures and anatomical subsites measured by logistic regression. Regressions were corrected for sex, age of diagnosis, region, tobacco and alcohol exposure. The Bonferroni method was used to adjust p values for multiple hypothesis testing. Effect size (log2(OR), color) and significance level (−log10(adjusted p-value), size). Dots filled in white indicate non-significant associations (adjusted p-value < 0.05). d, Mutational burdens for tobacco-related mutational signatures by anatomical subsite (n = 265 biologically independent samples). e, Mutational burdens for mutational signatures showing significant negative associations with tobacco consumption. The Kruskal–Wallis test (two-sided) was used to test for global differences. Box-and-whisker plots are in the style of Tukey. The line within the box is plotted at the median, while upper and lower ends indicate 25th and 75th percentiles. Whiskers show 1.5× IQR. Y axes were cut at 1.25× upper whisker for clarity. Bar plots indicate the frequencies of dichotomized signatures.
Extended Data Fig. 6
Extended Data Fig. 6. Driver alterations and driver mutation spectra in HNC.
a, Driver mutations in HNC samples (n = 265) sorted by tobacco and alcohol status. Genes mutated in more than 2% of the cases are shown. b, Driver mutations and copy number events in HNC samples with available copy number data (n = 242). Only driver genes with both copy number gains and losses are included. Top, tumor mutational burden (TMB) per sample. Middle, presence of mutations per sample. Bottom, epidemiological characteristics. Frequency of mutations in the HNC dataset and q values from two-sided Fisher’s exact text are displayed. c, SBS96-mutation spectrum of driver mutations in smokers and non-smoker HNC cases and percentage of driver mutations occurring in C>A contexts.
Extended Data Fig. 7
Extended Data Fig. 7. Mutational signature and driver spectra of oropharynx HNC cases by HPV status.
a,b, Relative mutational burdens for APOBEC-related signatures (SBS2 and SBS13) in oropharyngeal HNC cases sorted by human papillomavirus (HPV) and tobacco status (n = 46 biologically independent samples). The Kruskal–Wallis test (two-sided) was used to test for global differences. Box-and-whisker plots are in the style of Tukey. The line within the box is plotted at the median, while upper and lower ends indicate 25th and 75th percentiles. Whiskers show 1.5× IQR. c, Average relative attributions of SBS signatures by HPV positivity and tobacco status in OPC cancers. d, Driver mutations in OPC HNC samples (n = 46) sorted by HPV and tobacco status. Genes mutated in more than 2% of the samples are shown. e, Driver mutations and copy number events in OPC HNC samples with available copy number data (n = 44). Only driver genes with copy number gains and losses are included. Top, TMB per sample. Middle, presence of mutations per sample. Bottom, HPV status and tobacco smoking. Frequency of mutations in the HNC dataset and q values from two-sided Fisher’s exact text are displayed.
Extended Data Fig. 8
Extended Data Fig. 8. Copy number profile of head and neck cancer clusters.
a, Genome-wide segments showing major and minor allele counts in 10 randomly picked samples per copy number cluster. b, Ploidy, copy number burden and burden of gains, losses and copy-neutral LOH (NLOH) across clusters (n = 242 biologically independent samples). The Kruskal–Wallis test (two-sided) was used to test for global differences. Box-and-whisker plots are in the style of Tukey. The line within the box is plotted at the median, while upper and lower ends indicate 25th and 75th percentiles. Whiskers show 1.5 × IQR.
Extended Data Fig. 9
Extended Data Fig. 9. Copy number signature decomposition.
Decomposed copy number signatures including reference COSMIC signatures and signatures not decomposed into COSMIC reference signatures.
Extended Data Fig. 10
Extended Data Fig. 10. Copy number signature enrichment by HNC clusters and driver profile.
a,b, Signature burdens for copy number signatures by copy number cluster showing associations with clusters D and P. c, Signature burdens for CN5 and CN_G signatures in copy number clusters D and P. The Kruskal–Wallis test (two two-sided) was used to test for global differences. Box-and-whisker plots are in the style of Tukey. The line within the box is plotted at the median, while upper and lower ends indicate 25th and 75th percentiles. Whiskers show 1.5× IQR. Y axis was cut at 1.25× upper whisker for clarity. Bar plots indicate the frequencies of dichotomized signatures. d, Associations between copy number clusters or signatures and driver alterations. Effect size (log2(OR), color) and significance level (−log2(q), size) from two-sided Fisher’s exact tests, corrected using the Benjamini–Hochberg procedure, are displayed. Only significant associations are shown (q < 0.05).

Update of

  • The Complexity of Tobacco Smoke-Induced Mutagenesis in Head and Neck Cancer.
    Torrens L, Moody S, de Carvalho AC, Kazachkova M, Abedi-Ardekani B, Cheema S, Senkin S, Cattiaux T, Cortez Cardoso Penha R, Atkins JR, Gaborieau V, Chopard P, Carreira C, Abbasi A, Bergstrom EN, Vangara R, Wang J, Fitzgerald S, Latimer C, Diaz-Gay M, Jones D, Teague J, Ribeiro Pinto F, Kowalski LP, Polesel J, Giudici F, de Oliveira JC, Lagiou P, Lagiou A, Vilensky M, Mates D, Mates IN, Arantes LM, Reis R, Podesta JRV, von Zeidler SV, Holcatova I, Curado MP, Canova C, Fabianova E, Rodríguez-Urrego PA, Humphreys L, Alexandrov LB, Brennan P, Stratton MR, Perdomo S. Torrens L, et al. medRxiv [Preprint]. 2024 Apr 17:2024.04.15.24305006. doi: 10.1101/2024.04.15.24305006. medRxiv. 2024. Update in: Nat Genet. 2025 Apr;57(4):884-896. doi: 10.1038/s41588-025-02134-0. PMID: 38699364 Free PMC article. Updated. Preprint.

References

    1. Sung, H. et al. Global cancer statistics 2020: GLOBOCAN estimates of incidence and mortality worldwide for 36 cancers in 185 countries. CA Cancer J. Clin.71, 209–249 (2021). - PubMed
    1. Simard, E. P., Torre, L. A. & Jemal, A. International trends in head and neck cancer incidence rates: differences by country, sex and anatomic site. Oral Oncol.50, 387–403 (2014). - PubMed
    1. IARC. Alcohol Consumption and Ethyl Carbamate. IARC Monographs on the Evaluation of Carcinogenic Risks to Humans (IARC Publications, 2010). - PMC - PubMed
    1. IARC. Tobacco Smoke and Involuntary Smoking.IARC Monographs on the Evaluation of Carcinogenic Risks to Humans (IARC Publications, 2004). - PMC - PubMed
    1. IARC. Human Papillomaviruses. IARC Monographs on the Evaluation of Carcinogenic Risks to Humans Vol. 90 (IARC Publications, 2007). - PMC - PubMed