. 2025 Apr;10(4):882-896.
doi: 10.1038/s41564-025-01949-1. Epub 2025 Mar 31.

Parasite and vector circadian clocks mediate efficient malaria transmission

Affiliations

Parasite and vector circadian clocks mediate efficient malaria transmission

Inês Bento et al. Nat Microbiol. 2025 Apr.

Abstract

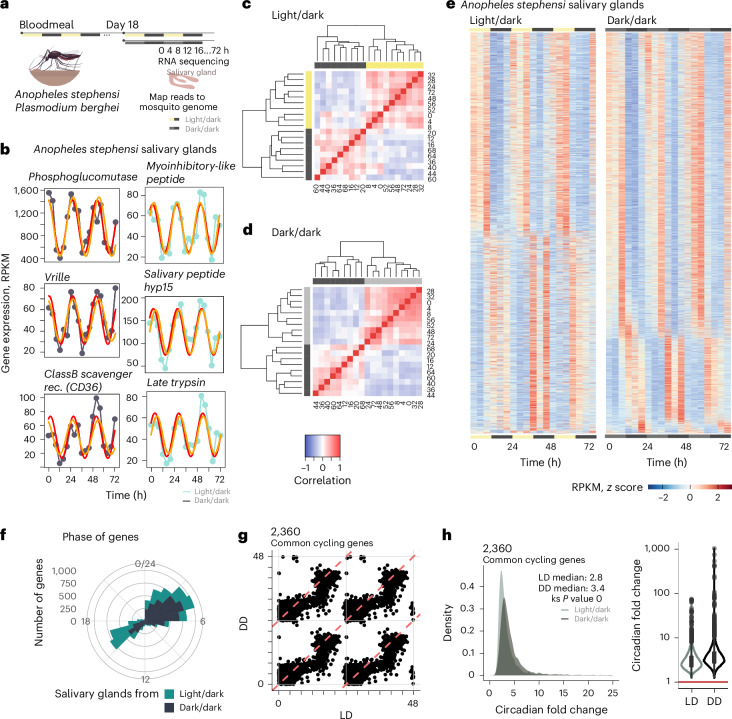
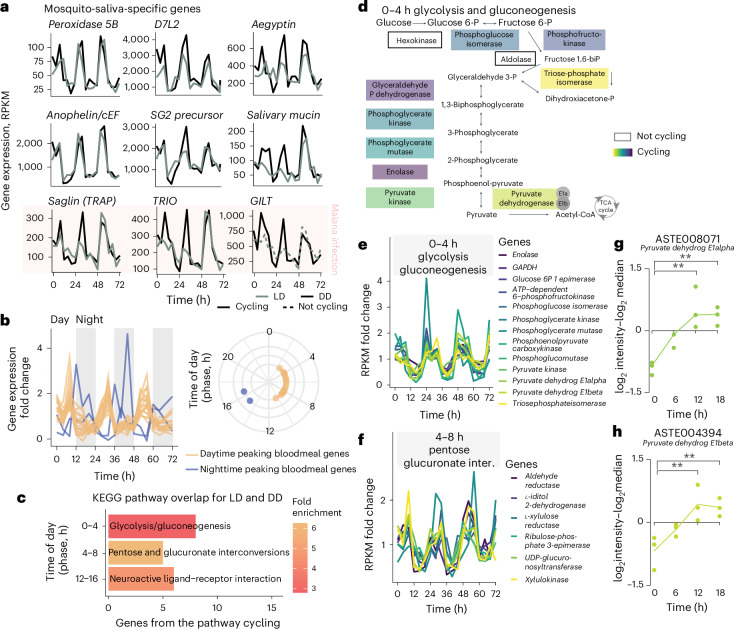
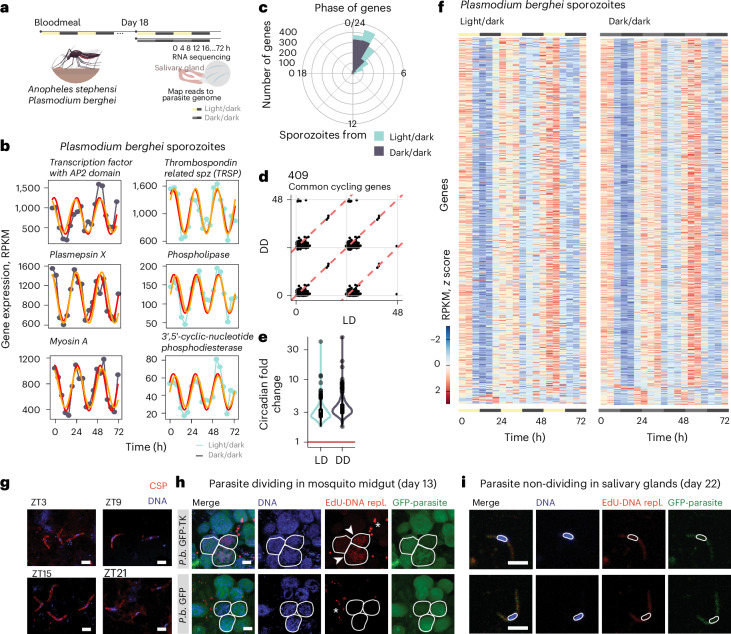
Malaria transmission begins when Anopheles mosquitos deposit saliva and Plasmodium parasites during a bloodmeal. As Anopheles mosquitos are nocturnal, we investigated whether their salivary glands are under circadian control, anticipating bloodmeals and modulating parasite biology for host encounters. Here we show that approximately half of the mosquito salivary gland transcriptome, particularly genes essential for efficient bloodmeals such as anti-blood clotting factors, exhibits circadian expression. Furthermore, measuring haemoglobin levels, we demonstrate that mosquitos prefer to feed and ingest more blood at nighttime. Notably, we show a substantial subset of the salivary-gland-resident parasite transcriptome cycling throughout the day, indicating that this stage is not transcriptionally quiescent. Among the sporozoite genes undergoing rhythmic expression are those involved in parasite motility, potentially modulating the ability to initiate infection at different times of day. Our findings suggest a circadian tripartite relationship between the vector, parasite and mammalian host that together modulates malaria transmission.


Conflict of interest statement

Competing interests: The authors declare no competing interests.

Figures

Fig. 1
Fig. 1. Half of the salivary gland transcriptome is rhythmic.
a, The experimental design from two independent experiments for the sequencing of salivary glands transcripts from A. stephensi mosquitos infected with P. berghei. Infected mosquitos were maintained in cyclic conditions (12 h light/12 h dark). Eighteen days after mosquito infection, mosquitos were segregated into light/dark (LD) and constant dark (DD) conditions. Twenty-four hours later, mosquitos were dissected every 4 h over 3 days (72 h) (n = 32 samples for each light/dark (LD) and dark/dark (DD) condition). b, Representation of three genes from the top 20 cycling genes (based on significance) from each condition and the circadian-algorithm-fitted lines. c,d Hierarchical clustering and heat maps for light/dark (c) and dark/dark (d) dataset by reordering of the timepoints according to similarity in gene expression. e, Heat map of cycling genes from salivary glands from mosquitos in light/dark and dark/dark. Each row represents a gene. Gene expression is z-scored. f, The distribution of the peak of expression for all cycling genes in LD and DD conditions. This shows two main times of day where most of the cyclic transcription occurs. Most gene expression peaks at 4 h after lights turn on, or the beginning of daytime; and 4 h after lights off, meaning 16 h after the beginning of daytime. g, The phase (time of peak of expression) for each of the 2,360 common genes is largely maintained across conditions (LD and DD). The plot represents a double plot of the phase of each cycling gene in each condition. Red dashed lines denote linear correlation between the phases of 2,360 common cycling genes in each condition. Solid grey lines denote 0, 24 or 48 h timepoints on each axis. h, The circadian fold change in expression of the common cycling genes across conditions. The violin plot width depicts distributions of fold-change values. ks, Kolmogorov–Smirnov statistical test. Mosquito icon in panel a designed by Freepik. Source data
Fig. 2
Fig. 2. Salivary-gland-specific transcripts cycle throughout the day.
a, The rhythmic expression profile of nine well-characterized salivary gland proteins known to have a role in bloodmeal efficiency and/or malaria transmission (Saglin, TRIO and GILT). b, The expression profile of 21 transcripts encoding for proteins associated with blood feeding, identified by being differentially expressed between female and male salivary glands. Nineteen of these genes show a similar phase and profile of gene expression. Refer to Extended Data Fig. 8. Grey bars in the left plot represent nighttime or 12 h of lights off. c, The top significant biological functions cycling under both LD and DD conditions at specific times of day. Representative cycling genes from the pathway are from the DD condition. d, Representation of the glycolysis and gluconeogenesis pathway with the genes that code for the enzymes inside rectangular boxes. Only 2 out of the 11 represented genes of the glycolysis pathway do not cycle in the mosquito salivary glands throughout the day (unfilled boxes), whereas the other 9 cycle (coloured boxes). e,f, Normalized expression profile (fold-change to mean RPKM expression values across timepoints) for each gene from the DD condition belonging to the glycolysis and gluconeogenesis pathway that cycle with a maximum expression between 0 h and 4 h (e), and from pentose and glucuronate interconversions (inter.) between 4 h and 8 h (f). g,h, Normalized protein expression levels (log2 intensities − log2 median) from two salivary gland proteins across four timepoints. Normalized protein expression levels (log2 intensities − log2 median) were computed by subtracting the log2 median intensity value of that protein from each of its log2 intensity values from each replicate in each timepoint. Each point represents the normalized intensity of that protein from each replicate—a pool of five salivary glands, with three replicates per timepoint. Differential expression analysis in Extended Data Figs. 3 and 4 and Supplementary Table 1f with significance testing and fold-change calculation using MSstats. One-way analysis of variance (ANOVA), one-sided, **P = 0.0016 for ASTE008071 (g) and **P = 0.0096 for ASTE004394 (h). Source data
Fig. 3
Fig. 3. Transmission-associated genes from quiescent sporozoites have daily rhythms.
a, The experimental design from two independent experiments for the sequencing of P. berghei (P.b.) sporozoites transcripts from A. stephensi mosquito salivary glands. Salivary glands were collected every 4 h over 3 days for light/dark (LD) and dark/dark (DD) conditions. b, Representation of six cycling genes selected from the top 20 cycling genes (based on significance) for each condition (LD and DD) and the circadian-algorithm-fitted lines. c, The daytime distribution of the peak expression of cycling genes showing that cycling transcription peaks between 0 h and 4 h after lights on (beginning of daytime, light phase). d, The phase (time of peak of expression) of the 409 common genes (that cycle in LD and DD) is maintained in both conditions. Red dashed lines denote linear correlation between the phases of 409 common genes in each condition. Solid grey lines denote 0, 24 or 48 h timepoints on each axis. e, Circadian fold change of the common cycling genes in both conditions. The violin plot width depicts distributions of fold-change values. f, Heat map of sporozoite cycling genes from mosquitos in LD and DD conditions. Each row represents a gene. The gene expression is z-scored. g, Representative immunofluorescence micrographs from purified salivary-gland sporozoites at days 22–24 after mosquito’s bloodmeal at different timepoints ZT3 (zeitgeber time, 3 h after lights on), ZT9, ZT15 and ZT21. DNA in blue and CSP in red. Scale bar, 5 µm. n = 20 dissected mosquitos per timepoint; two independent experiments. h, Representative immunofluorescence micrographs of Anopheles mosquito midguts with oocysts from P. berghei-TK-GFP and GFP (parental) line after EdU incorporation. The white circles delineate three oocysts. The arrowheads show oocysts that in the 48 h before fixation, replicated their DNA as demonstrated by the incorporation of EdU. The asterisk shows replicating mosquito midgut cells. Scale bar, 10 µm. n = 20 dissected mosquitos per genotype; two independent experiments. i, Representative immunofluorescence micrographs of salivary-gland sporozoites from P. berghei-TK-GFP and GFP (parental) parasite line upon feeding of mosquitos with EdU. The white line delineates a nucleus of a sporozoite. Sporozoites show no DNA replication as observed by the absence of EdU (red) at DNA (blue). Scale bar, 5 µm. n = 20 dissected mosquitos per genotype (repl.); two independent experiments. Mosquito icon in panel a designed by Freepik. Source data
Fig. 4
Fig. 4. Daily rhythms in motility-associated genes and infection efficiency.
a, The most significant biological functions with a cycling expression profile in DD and LD. Sporozoite schematics. ER, endoplasmic reticulum. b, Rhythmic expression profile of transcripts. c, The percentage of mosquitos that ingested blood within cups at ZT4 (daytime) and ZT16 (nighttime) (n = 9/10 cups per timepoint, n = 6–16 mosquitos per cup, Mann–Whitney test, **P < 0.005, two-tailed). Data are presented as mean ± s.e.m. d, Quantification of haemoglobin in mosquito midguts, as a proxy of blood ingested after mosquito access to a bloodmeal for 30 min (n = 67–68 midguts per group; four independent experiments with two replicates per timepoint; Mann–Whitney test, ***P = 0.0081, two-tailed). Data are presented as mean ± s.e.m. e, Quantification of haemoglobin (normalized to daytime median) in each engorged mosquito midgut, as a proxy of blood ingested, after a 30-min bloodmeal (n = 33–50 engorged midguts per group; four independent experiments; Mann–Whitney test, **P = 0.0082, two-tailed). For both d and e, each data point represents quantified haemoglobin from one mosquito midgut. Data are presented as median, and error bars represent 95% confidence intervals. f, Quantification by qPCR of parasite liver load in infected mice upon intradermal injection of sporozoites at ZT4 (daytime) and ZT16 (nighttime) in matched or mismatched schedules. The 18S expression was normalized against Hprt (n = 10–23 mice per group, three independent experiments, error bars represent ±s.e.m., two-tailed t-test, **P = 0.0024, two-way ANOVA shows significance for host timing, ***P = 0.003, Benjamini–Hochberg (FDR) method to correct for multiple comparisons). g, Parasite load in non-synchronized Hepa 1-6 cells upon infection with sporozoites at daytime or nighttime, assessed by qPCR normalized against Gapdh (n = 9 wells, error bars represent ±s.e.m. from four independent experiments; n.s., non-significant, Mann–Whitney test, two-tailed). h, Hepa 1-6 cells expressing luciferase under Bmal1 promoter were cultured and entrained with temperature (n = 12 wells, error bars represent ±s.e.m. from one representative experiment). RLU, relative light units. i, Hepa 1-6 wild-type cells were entrained with temperature and infected with matching day versus night sporozoites. Parasite load was assessed by qPCR normalized against Gapdh (n = 9 wells, error bars represent ±s.e.m., two independent experiments, **P = 0.0056, Mann–Whitney test, two-tailed). Source data
Extended Data Fig. 1
Extended Data Fig. 1. Anopheles stephensi salivary glands show transcriptional rhythms.
A. Hierarchical clustering of mosquitos salivary gland genes in LD and DD conditions. B. Quality control of RPKM and total number of uniquely mapped reads. C. Salivary gland-specific proteins expression profile across the two experiments. Source data
Extended Data Fig. 2
Extended Data Fig. 2. Cycling genes in mosquitos.
A. Histograms showing that across 1,000 permutations of Anopheles stephensi genes in both light/darkness and complete darkness over 72 h, no permutation had more cycling genes than the observed sample, as determined by a combination of cycle detection algorithms. This analysis shows that an average of 70-120 genes would be defined as cycling by chance, whereas the correct time point order identified between 3000 to 5000 genes. B. Confirmation of salivary gland transcriptome. Normalized expression of 443 fat-body-specific genes were obtained from VectorBase (Sreenivasamurthy, Madugundu et al. 2017), where the top 100 expressed genes were plotted (pink violin plot) and compared their expression levels to our top 100 expressed fat-body-specific genes in our salivary gland transcriptome dataset in complete darkness (black horizontal line). Unpaired Welch’s t test, two-sided, ****p-value < 0.0001. C. Phase of known clock genes of insects. D. Expression profile of known clock genes of mosquitos insects. E. Top enriched cycling genes shared INTERPRO domains across conditions. F. Top enriched cycling genes shared KEGG pathways across conditions. For E/F: one-sided; used Benjamini-Hochberg (FDR) method to correct for multiple comparisons. Source data
Extended Data Fig. 3
Extended Data Fig. 3. Proteomics of infected salivary glands across four times of the day.
A. Number of proteins detected in infected A. stephensi salivary gland samples, across 3 replicates at ZT0 (Zeitgeber 0), ZT6, ZT12, and ZT18. 1,480 proteins were found to be common across all timepoints and replicates (left-most bar). Remaining bars on the plot represent the groups of proteins shared across a portion of samples but not detected across all time points and replicates. B. Boxplot of log2 protein intensities (protein expression) for all proteins across each of the four timepoints and its three replicates, colored by timepoint. Each replicate (each box plot of the same color) for each timepoint shows log2 intensities from all identified proteins from lysate of 5 infected salivary glands. Middle line on the boxplot indicates mean log2 intensity for all proteins detected within that replicate. For boxplot features, please refer to source data provided. C. Volcano plots of proteins identified from infected salivary glands (gray points) and whether they were differentially expressed (red points). Top-left panel: Proteins found to be differentially expressed (DE) at ZT12 vs ZT18. Top-middle panel: Proteins found to be DE at ZT12 vs ZT6. Top-right panel: Proteins found to be DE at ZT18 vs ZT6. Bottom-left panel: Proteins found to be DE at ZT0 vs ZT12. Bottom-middle panel: Proteins found to be DE at ZT0 vs ZT18. Bottom-right panel: Proteins found to be DE at ZT0 vs ZT6. Table S6 contains significance testing and fold-change calculation using MSstats. Red dotted line indicates cutoffs for determining DE using p-values and log2 intensities of fold change (thresholds of p-value <= 0.05, FC > = 2). Statistical analyses were performed using unpaired t-test, two-sided. Red points show DE proteins between two designated timepoints for each plot. Source data
Extended Data Fig. 4
Extended Data Fig. 4. Cycling genes and proteins in mosquito salivary glands and Plasmodium sporozoites.
A. Salivary gland protein expression and transcript expression profiles across time for some DE proteins. Left plots: Mean log2 Intensities (red line) of proteins DE across time. Each blue point represents log2 intensity value for one of three replicates. Right plots: For all proteins plotted, their transcripts cycle throughout the day. Bottom-most protein and transcript is a blood-meal related gene. B. Histograms showing that across 1,000 permutations of Plasmodium genes in both light/darkness and complete darkness over 72 h, no permutations had more cycling genes than the observed sample (green dot), as determined by a combination of cycle detection algorithms. This analysis showed that on average, only 22 genes would be recognized as cycling by chance, whereas the real time point order identified between 500 to 950 cycling genes. Source data
Extended Data Fig. 5
Extended Data Fig. 5. Quality analysis of unique mapped genes.
A. Quality control of reads per kilobase per million (RPKM) versus number of uniquely mapped reads obtained across time points. B-C. Downsampling of uniquely mapped reads to normalize for potential fluctuation in parasite numbers across time points, show similar findings. Represented results are from two independent experiments (left: experiment 1; right: experiment 2). Source data
Extended Data Fig. 6
Extended Data Fig. 6. Plasmodium berghei sporozoite stage shows transcriptional rhythms.
A. Re-analysis of both circadian cycling genes and GO-term enrichment using the downsampled datasets brings the reads of each time point to the same number, removing the potential confounder of variable number of parasites in the salivary glands, and shows the same results as the actual sequenced reads. B. Venn diagram representing the common cycling mRNAs in LD or DD identified from our dataset that were also shown to be previously identified sporozoite proteins from Plasmodium falciparum in Linder et al., 2013. C. Hierarchical clustering of samples in LD and DD. Source data
Extended Data Fig. 7
Extended Data Fig. 7. The most significant biological functions of cycling sporozoite genes in DD and LD.
A. Cycling genes’ top 10 enriched GO terms in LD and DD conditions. B. Cycling genes’ top 10 enriched KEGG pathways sorted by fold enrichment in LD and DD conditions. Source data
Extended Data Fig. 8
Extended Data Fig. 8. Profile of expression of genes within the enriched GO term.
A. Representation of microneme associated genes. B. Representation of plasma membrane associated genes. Source data
Extended Data Fig. 9
Extended Data Fig. 9. Night period dictates mosquitos efficient feeding behaviour and sporozoite increased motility.
A. Percent of mosquito biting across two times of the day (ZT4 and ZT16) on anesthetized mice or warm human blood was significantly higher at night (ZT16) compared to daytime (ZT4). Each point represents one replicate from 8 independent experiments, where 5-20 co-housed mosquitoes had access to a bloodmeal from one of two sources mentioned above. Percent values were derived from dividing the total number of fed mosquitoes that were co-housed by the total number of mosquitoes that were co-housed. Two-way ANOVA, adjusted for multiple comparisons ** p = 0.00257. There was no difference in percent of mosquito biting on different blood sources during the same time of day (Two-way ANOVA, p = 0.4622). Bars represent mean and error bars represent +/- SEM. B. Four independent normalized hemoglobin standard curves plotted from corresponding linear regression equation calculated from the absorbance (562 nm) values of diluted hemoglobin standards from four independent runs of the hemoglobin colorimetric assay. Individual points represent mean log2 absorbance of two technical replicates per independent run. Data are presented as mean values +/- SD. C. Quantification of hemoglobin in each mosquito midgut, as a proxy of blood ingested, after mosquito access to a bloodmeal for 30 min (n = 67 mosquito midguts for daytime group and n = 68 mosquito midguts for nighttime group; 4 independent experiments with 2 replicates per timepoint of 5-20 mosquitoes feeding on blood source; Mann Whitney test, *** p = 0.001, two-tailed). Hemoglobin concentrations (mg/mL) of all mosquitos from glytube feeding experiments, regardless of blood-fed status. Hemoglobin levels were quantified from linear regression equation generated from hemoglobin standard curves. Data are presented as mean values with 95% confidence intervals. D. Quantification of hemoglobin in each engorged mosquito midgut, as a proxy of blood ingested, after mosquito access to a bloodmeal for 30 min (n = 33 engorged midguts for daytime group; n = 50 engorged midguts for nighttime group; 4 independent experiments). Hemoglobin concentrations (mg/mL) of only blood-fed mosquitos from glytube feeding experiments. Quantified from linear regression equation generated from hemoglobin standard curves. Data are presented as mean values +/- SEM. E. Parasite load in livers of mice after bite of infected mosquitos at ZT4 or ZT16. Quantification of parasite load by qPCR analysis of Plasmodium berghei 18S expression in the livers of mice at 46 h post infection by bite of infected mosquitos for 25 min (n = 24 mice from 4 independent experiments; t test, ** p = 0.007). F. The percentage of sporozoites moving were quantified at each time of the day (ZT4 and ZT16) by taking the sum of sporozoites that moved in 1-5 trails, 6-10 trails, or > 10 trails category and dividing it by the total number of sporozoites imaged for each timepoint in 3 replicates (total 3 replicates) per timepoint. For ZT4, n = 143 sporozoites across all replicates. For ZT16, n = 128 sporozoites across all replicates. An average of 40 sporozoites were imaged per replicate per time of day. Statistical analyses were performed in prism using the student’s t-test. Data are presented as mean values +/- SD. Source data

References

    1. World Malaria Report 2022 (WHO, 2022).
    1. Rund, S. S., O’Donnell, A. J., Gentile, J. E. & Reece, S. E. Daily rhythms in mosquitoes and their consequences for malaria transmission. Insects7, 14 (2016). - PMC - PubMed
    1. Jones, M. D., Ford, M. G. & Gillett, J. D. Light-on and light-off effects on the circadian flight activity in the mosquito Anopheles gambiae. Nature211, 871–872 (1966). - PubMed
    1. Sheppard, A. D. et al. Light manipulation of mosquito behaviour: acute and sustained photic suppression of biting activity in the Anopheles gambiae malaria mosquito. Parasit. Vectors10, 255 (2017). - PMC - PubMed
    1. Das, S. & Dimopoulos, G. Molecular analysis of photic inhibition of blood-feeding in Anopheles gambiae. BMC Physiol.8, 23 (2008). - PMC - PubMed