. 2025 May;10(5):1240-1257.
doi: 10.1038/s41564-025-01963-3. Epub 2025 Mar 31.

Gut metagenomes reveal interactions between dietary restriction, ageing and the microbiome in genetically diverse mice

Affiliations

Gut metagenomes reveal interactions between dietary restriction, ageing and the microbiome in genetically diverse mice

Lev Litichevskiy et al. Nat Microbiol. 2025 May.

Abstract

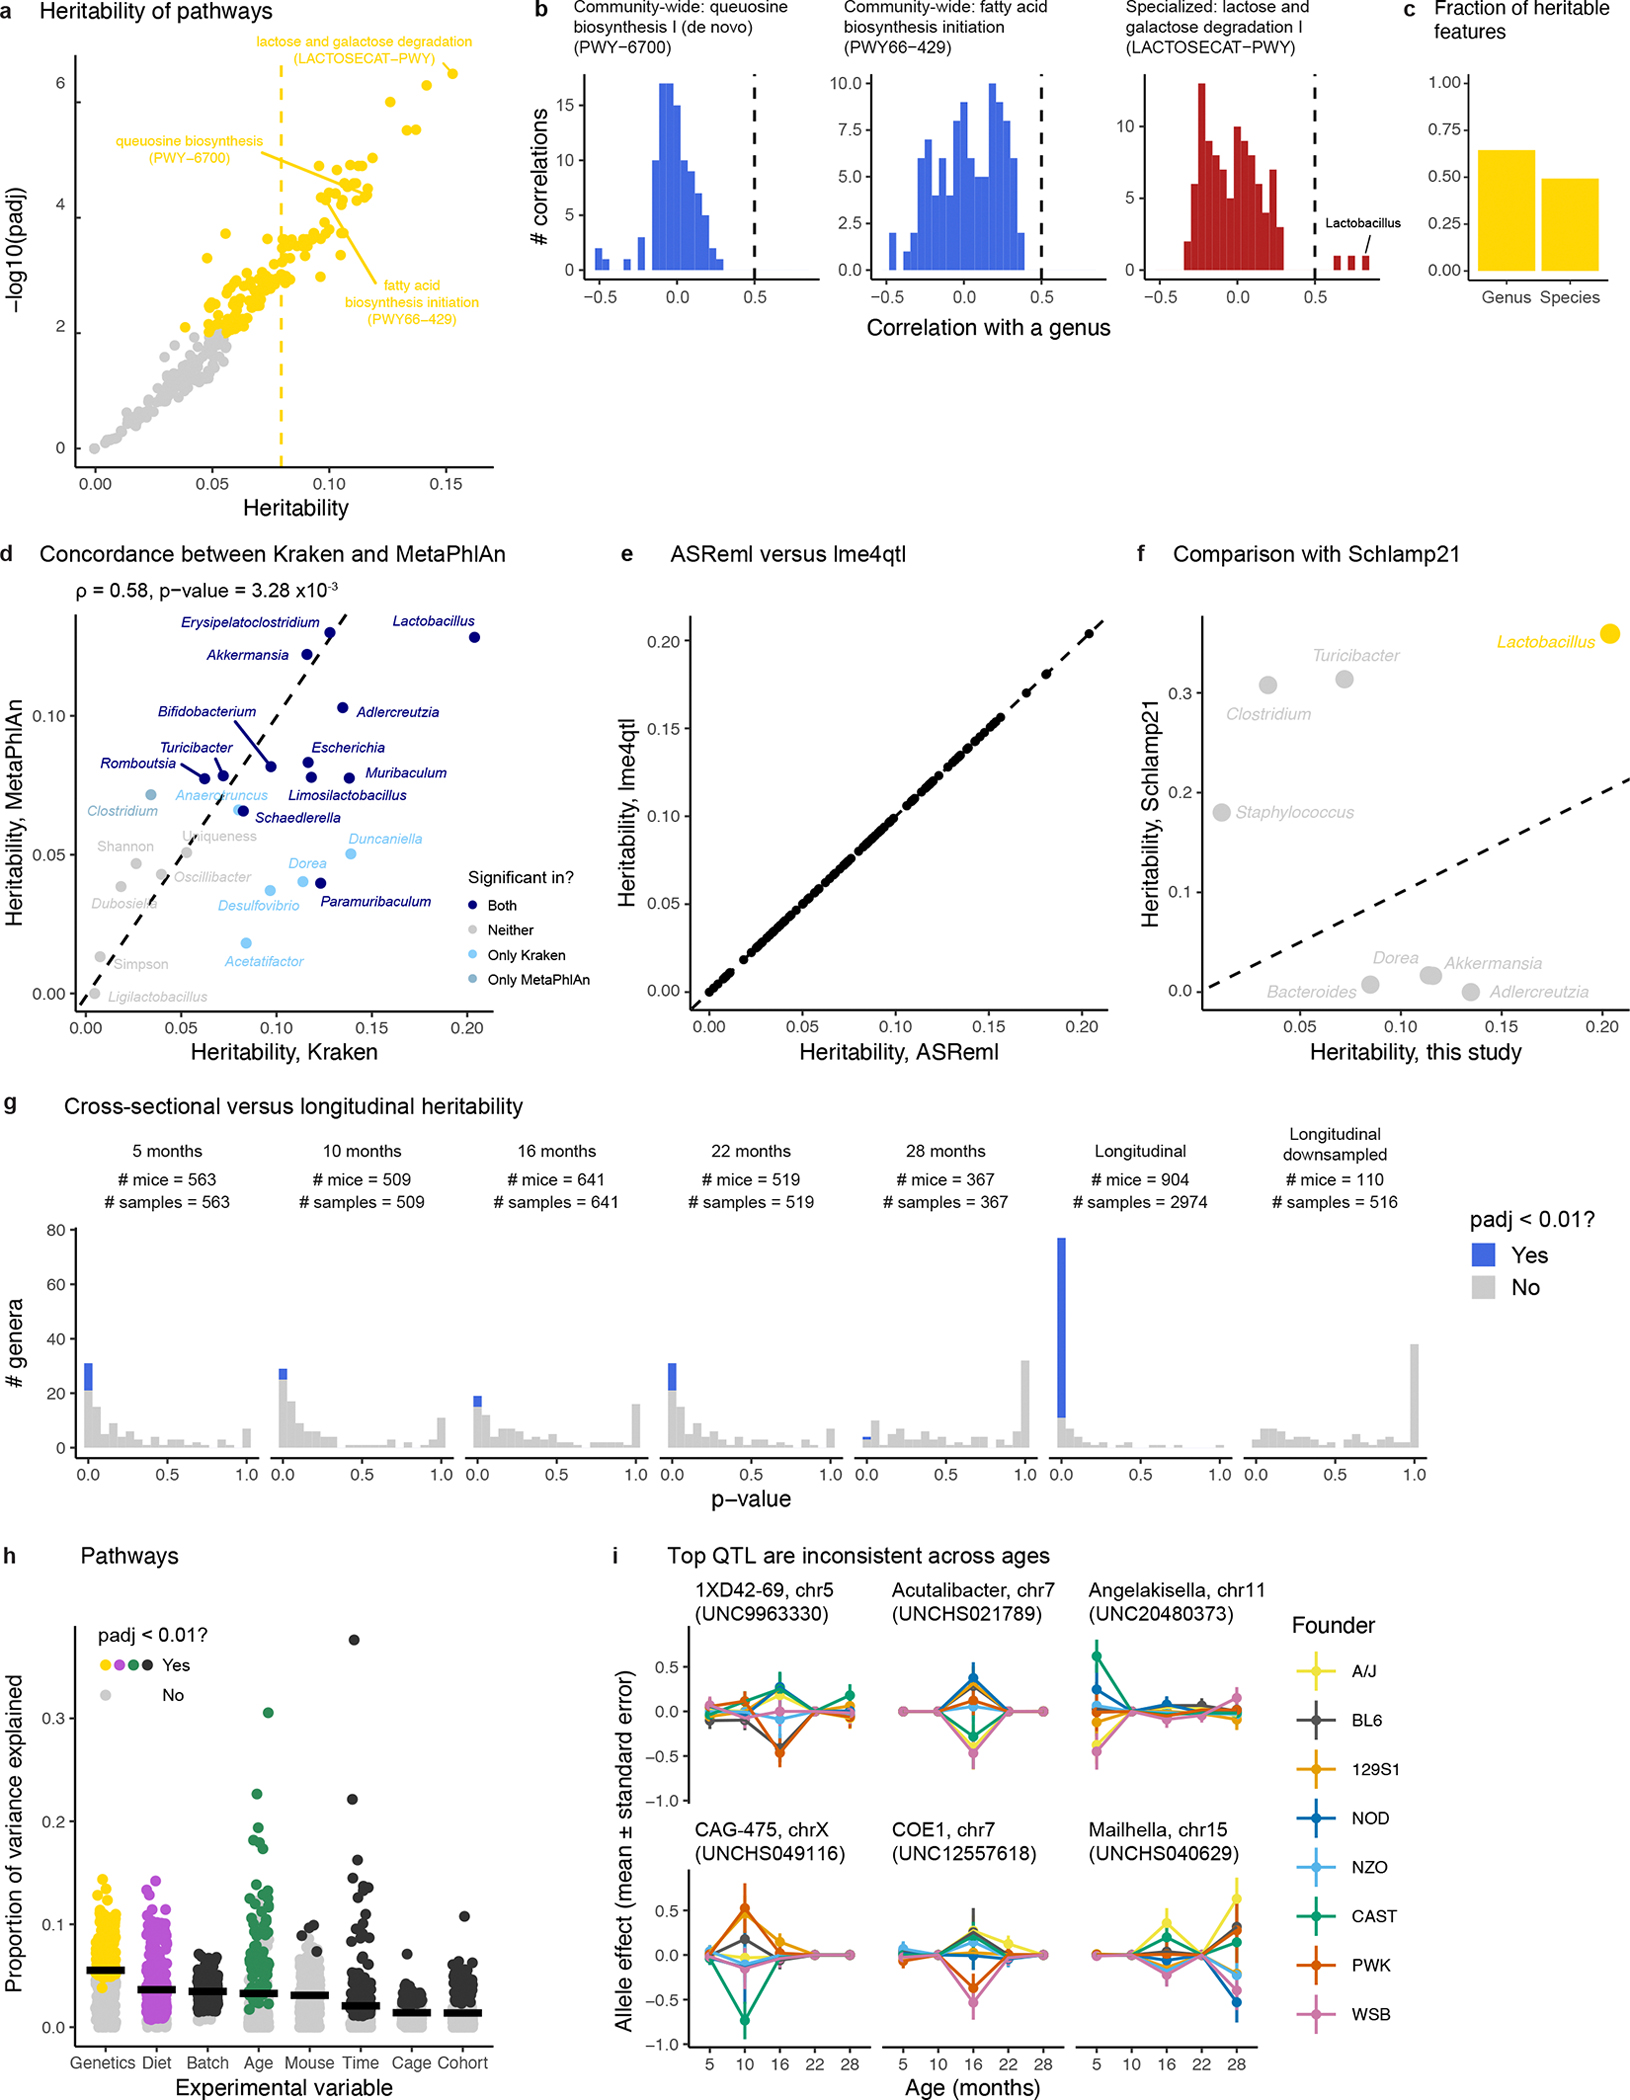
The gut microbiome changes with age and has been proposed to mediate the benefit of lifespan-extending interventions such as dietary restriction. However, the causes and consequences of microbiome ageing and the potential of such interventions remain unclear. Here we analysed 2,997 metagenomes collected longitudinally from 913 deeply phenotyped, genetically diverse mice to investigate interactions between the microbiome, ageing, dietary restriction (caloric restriction and fasting), host genetics and a range of health parameters. Among the numerous age-associated microbiome changes that we find in this cohort, increased microbiome uniqueness is the most consistent parameter across a second longitudinal mouse experiment that we performed on inbred mice and a compendium of 4,101 human metagenomes. Furthermore, cohousing experiments show that age-associated microbiome changes may be caused by an accumulation of stochastic environmental exposures (neutral theory) rather than by the influence of an ageing host (selection theory). Unexpectedly, the majority of taxonomic and functional microbiome features show small but significant heritability, and the amount of variation explained by host genetics is similar to ageing and dietary restriction. We also find that more intense dietary interventions lead to larger microbiome changes and that dietary restriction does not rejuvenate the microbiome. Lastly, we find that the microbiome is associated with multiple health parameters, including body composition, immune components and frailty, but not lifespan. Overall, this study sheds light on the factors influencing microbiome ageing and aspects of host physiology modulated by the microbiome.


Conflict of interest statement

Competing interests: K.M.W., A.R., F.H., Z.C., G.V.P., M.M., R.L.C., D.B., A.F. and A.D.F. are current or former employees of Calico Life Sciences LLC. The other authors declare no competing interests.

Figures

Extended Data Fig. 1 |
Extended Data Fig. 1 |. Positive and negative controls.
a, Number of read pairs per sample (prior to aggregation), grouped by sample type (n=3577 samples prior to aggregation by stool ID). Boxes extend from the 25th to 75th percentiles, whiskers extend to 1.5 times the interquartile range, and the center line is the median. b, PCoA of all samples prior to aggregation. Two positive controls (BZIZNTZA and JVOMNOOB, highlighted in red) clustered separately from the other positive controls. PCoA1 and PCoA2 explain 30% and 10% of overall variance, respectively. c, Species-level relative abundances (MetaPhlAn4) for positive controls. Two positive controls (BZIZNTZA and JVOMNOOB, highlighted in red) did not display the expected community composition. d, PCoA of non-control samples prior to aggregation. e, Same ordination as d, with lines connecting samples originating from the same DNA. f, Same ordination as d, with lines connecting samples in which a library was sequenced multiple times.
Extended Data Fig. 2 |
Extended Data Fig. 2 |. Identifying sample mix-ups.
a, Sample mix-ups were identified by comparing host reads from each microbiome sample against all host genotypes (we term this pipeline “mbmix”). For more details, see Supplementary Note 1. b, Example of concordance between a microbiome sample and the expected host genotype. The x-axis is each host genotype, the y-axis is the proportion of single nucleotide polymorphisms (SNPs) that were discordant between the microbiome sample and the host genome. c, Example of discordance. Microbiome sample DO_20_1188_021w was supposed to originate from mouse DO-20–1188, but it appears to have come from DO-2D-4188. d, Best proportion discordant SNPs versus proportion of discordant SNPs against the expected genotype. The fate of each sample is indicated by its color: kept (green), discarded (red), or renamed (blue). e, Plate view of mbmix categorization. Each sub-panel is a “final plate”, a 96-well plate of libraries prior to pooling. White regions either didn’t contain a sample, contained a sample that obtained no reads (e.g., left half of final plate 31), contained a sample whose mouse did not have a genotype, or contained a control sample. f, Proportion discordant SNPs for stool samples from mice DO-AL-0097 and DO-AL-0105. Samples from 44 weeks were concordant with the expected mouse genotype. All other samples from mouse DO-AL-0097 appeared to come from mouse DO-AL-0105, except DO_AL_0097_148w, which was inconclusive. The two other samples from mouse DO-AL-0105 appeared to come from DO-AL-0097. For discordant results, the mouse with the lowest proportion of discordant SNPs is colored red. g, Body weight for mice DO-AL-0097 and DO-AL-0105. The vertical dashed line at 56 weeks represents the likely time that these mice were swapped in their cages.
Extended Data Fig. 3 |
Extended Data Fig. 3 |. Quality-control and details related to taxonomic and functional classification.
a, Histogram of all pairwise sample distances (Bray-Curtis on relative abundances). Distances involving any of 13 outlier samples are shown in red. b, Percentage of reads that could be classified for non-control samples using either Kraken2+MGBC or MetaPhlAn4. Mean percent classified indicated in black text. c, Difference between Kraken2+MGBC and MetaPhlAn4 genus-level relative abundances for the 41 genera present in both taxonomic databases. Each horizontal line shows the mean ± standard deviation across all 2997 non-control samples. d, Examples of community-wide and specialized pathways. The largest correlations for the specialized pathway (PWY-8004) were with Lactobacillus and Limosilactobacillus. e, PCA plot based on microbial pathways (n=2997 metagenomes). PC1 and PC2 explain 21% and 8% of overall variance, respectively. For the boxplots, boxes extend from the 25th to 75th percentiles, whiskers extend to 1.5 times the interquartile range, and the center line is the median. For more details, see Fig. 1 legend.
Extended Data Fig. 4 |
Extended Data Fig. 4 |. Effect of sampling timepoint.
a, Timeline of stool collection. X-axis shows the day of stool collection, with the first day of the overall experiment as day 1. Y-axis indicates the age of a mouse when a stool sample was collected. The color of each circle corresponds to one of 12 DO breeding cohorts that were sequentially entered into the study. The size of each circle corresponds the number of samples collected for each cohort-age combination. Gray rectangles correspond to three cross-sectional data slices used in later analyses. b, Number of genera associated (conditional Wald test, Benjamini-Hochberg adjusted p-value < 0.01) with age using linear mixed models that included sampling timepoint as a fixed effect (Model 2), random effect (Model 1), or not at all (Model 3). c, Correlations between age coefficients calculated using cross-sectional (columns) and longitudinal (rows) models. Blue line represents the line of best fit and 95% confidence interval (linear regression). Spearman correlation (ρ) indicated above each scatterplot. Black dashed line at y=x represents perfect agreement between two models.
Extended Data Fig. 5 |
Extended Data Fig. 5 |. Additional details related to age-associated microbiome changes.
a, Uniqueness increases with age even when the number of mice per cage is kept fixed. For various n, cages with at least n mice at that age were considered. If the number of mice was greater than n, then n mice were randomly chosen. Uniqueness was then recomputed on this subset of samples. b, ɑ-diversity (as measured by Shannon and Simpson indexes) appears to increase with host age (n=2988 metagenomes with age ≤ 40 months), but this trend is not significant (Model 1, conditional Wald test, Benjamini-Hochberg adjusted p-value > 0.01). c, Fraction of features associated (Model 1, conditional Wald test, Benjamini-Hochberg adjusted p-value < 0.01) with age when using genus-level or species-level data. d, Uniqueness increases with age when using species-level relative abundances (n=2988 metagenomes). e, Comparison of age coefficients calculated using Kraken2 or MetaPhlAn taxonomic results. Diagonal dashed line at y=x represents perfect agreement. Spearman correlation (ρ) and p-value are indicated above the plot. f, Effect of age on microbial pathways. Age coefficients and standard errors were calculated with Model 1. p-values were calculated with a conditional Wald test and adjusted with the Benjamini-Hochberg procedure. g, Glycolysis IV (PWY–1042) decreases with age (n=2988 metagenomes). h, Correlations between PWY–1042 and all genera. PWY–1042 is a community-wide pathway because it has no correlations above 0.5. i, L-lysine biosynthesis II (DAPLYSINESYN-PWY) increases with age (n=2988 metagenomes). j, DAPLYSINESYN-PWY is a specialized pathway because it is highly correlated with Bifidobacterium. k, Functional uniqueness increases with age (n=2988 metagenomes). l-n, Age prediction based on 10-fold cross validation. Green line represents the line of best fit and 95% confidence intervals (linear regression). Black dashed line at y=x represents perfect accuracy. MAE = mean absolute error. l, Prediction considering all mice, rather than just AL mice. m, Prediction using species-level relative abundances in AL mice. n, Prediction using pathway log2(TPM) abundances in AL mice. o, Top 10 most important pathways for age prediction (just AL mice, n=573 metagenomes). Each dot is one of 10 cross-validation folds. X-axis shows the percent increase in mean squared error (MSE) when that particular pathway is excluded from a tree within the random forest regressor. In a, b, d, g, i, and k, data are presented as mean ± SEM.
Extended Data Fig. 6 |
Extended Data Fig. 6 |. Additional details related to universal age-associated microbiome changes.
a, Percentage of pathways associated with age (Models 5–7, Benjamini-Hochberg adjusted p-value < 0.1) within each dataset. b-d, Associations with age within human studies. Coefficients, standard errors, and p-values were calculated with Model 8, and p-values were adjusted with the Benjamini-Hochberg procedure. Adjusted p-values < 0.1 are shown in green. The number of individuals per study indicated in b is the same as in c and d. b, Uniqueness tends to increase with age in most human studies, including the largest (LifeLinesDeep_2016). c, Blautia appears to increase with age in some studies and decrease with age in others, and when regressing against age separately per study, no studies have an adjusted p-value < 0.1. d, ɑ-diversity versus age, separately per human study. p-values were adjusted separately per metric. e, Comparison of age-associated functional changes across datasets. Each pairwise comparison shows all features that passed prevalence filtration in both datasets. Line of best fit and 95% confidence interval shown in gray. Spearman correlation and corresponding p-value shown above each plot. Features associated with age and with the same sign in the pairwise comparison are shown in green. f, Flavin biosynthesis I (RIBOSYN2-PWY) decreases with age in all three datasets. Each panel includes the line of best fit and 95% confidence interval (linear regression). g, Histograms of pathway-genus correlations. For the specialized pathway (PWY-7234), the largest genus correlation is to Ligilactobacillus. h, Schematic of cohousing experiment in germ-free mice. Young germ-free mice (gray) received fecal microbiome transplants (FMTs) from young donors (Y FMT) or old donors (O FMT). Mice that received Y FMT are shown in blue, mice that received O FMT are shown in red. YGF = Y FMT recipients housed with other Y FMT recipients, OGF = O FMT recipients housed with other O FMT recipients, CYGF = Y FMT recipients cohoused with O FMT recipients, COGF = O FMT recipients cohoused with Y FMT recipients. i, PCoA (based on genus-level Bray-Curtis distances) of samples at baseline, after two weeks of cohousing, and after one month of cohousing. Ordination based on all samples shown in this plot. + denotes group centroid. In b, c, and d, data are presented as mean ± SEM.
Extended Data Fig. 7 |
Extended Data Fig. 7 |. Additional details related to microbiome heritability.
a, Heritability of pathways. Heritability was calculated with Model 1. p-values were calculated using a likelihood ratio test and adjusted with the Benjamini-Hochberg procedure. Yellow vertical dashed line shows mean heritability for heritable features. b, Histograms of pathway-genus correlations. For the specialized pathway (LACTOSECAT-PWY), the largest genus correlation is to Lactobacillus. c, Fraction of heritable (Model 1, likelihood ratio test, Benjamini-Hochberg adjusted p-value < 0.01) features when using genus-level or species-level data. d, Comparison of heritability calculated using Kraken2 or MetaPhlAn taxonomic results. Diagonal dashed line at y=x represents perfect agreement. Spearman correlation (ρ) and p-value are indicated above the plot. e, Heritability computed with lme4qtl or ASReml using the same model and data. f, Comparison of heritability estimates from a different DO mouse study (Schlamp et al. 2021). Plot shows the eight genera for which heritability was assessed in both datasets. Of these eight, the most heritable taxon in both studies was Lactobacillus (highlighted in yellow). g, Cross-sectional (Model 9) versus longitudinal (Model 1) versus downsampled longitudinal (Model 9, downsampled to 110 mice) heritability. Heritable genera (Benjamini-Hochberg adjusted p-value < 0.01) are shown in blue. The longitudinal results are the primary heritability results presented throughout the manuscript. h, Proportion of variance explained (PVE) by all experimental variables for n=273 pathways (Model 10, p-values calculated with likelihood ratio test, adjusted with Benjamini-Hochberg). Horizontal lines show the mean PVE. i, Allele effects across ages for the top six age-specific QTL (permutation test, adjusted p-value < 0.01). QTL mapping was performed using n= 569, 513, 646, 522, and 368 samples respectively at 5, 10, 16, 22, and 28 months. Data are presented as mean ± SEM. The title above each sub-panel indicates the genus, chromosome, and genotyping marker for the QTL result. Color of each line represents the allele effect for each of eight founders comprising the Diversity Outbred genetic pool.
Extended Data Fig. 8 |
Extended Data Fig. 8 |. Additional details related to the effects of dietary restriction.
a, Effect of dietary restriction (DR) on 273 pathways. DR coefficients and standard errors were calculated with a linear mixed model (Model 1). p-values were calculated using a conditional Wald test and adjusted with the Benjamini-Hochberg procedure. b, The L-lysine biosynthesis II pathway (PWY-2941) is increased by DR (n=2988 metagenomes with age ≤ 40 months). c, PWY-2941 is a specialized pathway, most highly correlated with Ligilactobacillus. d, The urea cycle pathway (PWY-4984) is decreased by DR (n=2988 metagenomes). e, PWY-4984 is a community-wide pathway with no correlations with genera above 0.5. f, Absolute magnitude of DR coefficients for 273 pathways. Gray lines connect the same pathway in different dietary groups. Horizontal bars show the mean. Statistical significance evaluated by a paired t-test. g, Comparison of DR coefficients for pathways. Pearson correlation and p-value is indicated above each scatterplot. Lines of best fit and 95% confidence intervals (linear regression) are shown in purple. h, Mean CR versus mean fasting coefficients for pathways. Vertical lines highlight the difference in mean CR coefficients (red) versus mean fasting coefficients (blue). Pathways with opposite signs are opaque, while pathways with the same sign are transparent. Dashed horizontal line at 0. i, Receiver operating characteristic (ROC) curves for the prediction of binary DR using pathways, separately at each age. Each gray line is the ROC curve for one of 5 cross-validation folds. The purple line is the mean ROC curve. The diagonal dashed line at y=x represents no predictive accuracy. AUC = area under the curve. j-k. Top 10 most important genera (j) and pathways (k) for prediction of binary DR status. Each dot is one of 20 cross-validation folds (4 post-randomization ages x 5 folds per age). X-axis shows the mean decrease in accuracy, i.e. between trees in the random forest that do include the feature of interest and trees that do not. l, Predicting dietary group using pathways before (gray) and after (purple) initiation of DR. Each dot represents prediction accuracy in one of 10 cross-validation folds. Horizontal dashed line at 20% represents expected accuracy by chance. Statistical significance evaluated by a one-sided t-test (testing whether the mean accuracy is greater than 20%). m, Prediction accuracy stratified by dietary group using pathways. Only predictions after the start of dietary restriction were considered. n, Fraction of features associated (Model 1, conditional Wald test, Benjamini-Hochberg adjusted p-value < 0.01) with DR when using genus-level or species-level data. o, Comparison of DR coefficients calculated using Kraken2 or MetaPhlAn taxonomic results. Diagonal dashed line at y=x represents perfect agreement. Spearman correlation (ρ) and p-value are indicated above the plot. For the boxplots in b and d, boxes extend from the 25th to 75th percentiles, whiskers extend to 1.5 times the interquartile range, and the center line is the median. In b, d, f, g, and l, p-value symbols are defined as follows: ns : p ≥ 0.05, * : p < 0.05, ** : p < 0.01, *** : p < 0.001, **** : p < 0.0001.
Extended Data Fig. 9 |
Extended Data Fig. 9 |. Dietary restriction does not rejuvenate the microbiome.
a, Age prediction with a random forest regressor trained on pathway data from n=573 AL samples. Vertical dashed line at six months represents start of dietary restriction, diagonal dashed line represents perfect prediction. Statistical significance evaluated by a t-test between AL (gray) and DR (purple) predictions at each age. b, Age prediction of a regressor trained on n=623 40% CR samples and evaluated on all other samples (n=2374), using genera (top) or pathways (bottom). Horizontal dashed line shows the actual age of samples collected at that timepoint. Boxes extend from the 25th to 75th percentiles, whiskers extend to 1.5 times the interquartile range, and the center line is the median. Statistical significance evaluated with a t-test against the AL group. c, PCoA of AL and 40% CR samples from middle-aged (10 months) and old (28 months) samples. Ordination based on just these samples. Group centroids are depicted by the four large points, along with 95% data ellipses. Arrows connect group centroids to depict the effect of age (gray) and the effect of caloric restriction (red). PCoA1 and PCoA2 explain 39% and 8% of overall variance, respectively. In a and b, p-value symbols are defined as follows: ns : p ≥ 0.05, * : p < 0.05, ** : p < 0.01, *** : p < 0.001, **** : p < 0.0001.
Extended Data Fig. 10 |
Extended Data Fig. 10 |. Additional details related to microbiome-phenotype associations.
Histogram of p-values for associations between phenotypes and genera (left) or pathways (right). Associations were performed using a linear mixed model (Model 11), and p-values were calculated using a likelihood ratio test in which the null model omitted the microbiome term. Associations with a Benjamini-Hochberg adjusted p-value < 0.01 are shown in blue.
Fig. 1 |
Fig. 1 |. Overview of DRiDO study and microbiome dataset.
a, At six months of age, genetically diverse mice started one of five dietary interventions. They were extensively phenotyped and stool was collected for microbiome profiling. b, Lifespan per dietary group. This analysis includes n=924 mice: n=937 mice were alive at the start of dietary restriction at 6 months, and n=13 mice were omitted from analysis due to accidental death during technician handling. p-values were calculated with pairwise log-rank tests against the AL group and adjusted with the Benjamini-Hochberg procedure. p-value symbols are defined as follows: ns: p ≥ 0.05, * : p < 0.05, ** : p < 0.01, *** : p < 0.001, **** : p < 0.0001. c, Microbiome data generation consisted of extracting DNA from stool samples, preparing libraries, performing shotgun metagenomic sequencing, performing quality control, and finally taxonomic and functional classification. After all quality control, the cohort consisted of 2997 stool samples. d, Principal Coordinates Analysis (PCoA) plot of n=2997 quality-controlled metagenomes. Ordination based on Bray-Curtis distances of genus-level relative abundances. Color denotes dietary group, and size encodes mouse age at the time of stool collection. Boxplots along the sides show PCoA1 (top) and PCoA2 (left) coordinates per dietary group. Barplots along the sides show the mean age of stool samples within each bin of PCoA1 (bottom) and PCoA2 (right) coordinates. PCoA1 and PCoA2 explain 35% and 8% of overall variance, respectively. For boxplots in b and d, boxes extend from the 25th to 75th percentiles, whiskers extend to 1.5 times the interquartile range, and the center line is the median.
Fig. 2 |
Fig. 2 |. Host age influences the microbiome.
a, Effect of age on genera. Age coefficients and standard errors were calculated with a linear mixed model (Model 1). p-values were calculated with a conditional Wald test and adjusted with the Benjamini-Hochberg procedure. b, Bifidobacterium increases with age (n=2988 metagenomes with age ≤ 40 months). Vertical dashed line at six months represents start of dietary restriction. c, Uniqueness increases with age (n=2988 metagenomes with age ≤ 40 months). d, Host age prediction using 573 genus-level metagenomes from AL mice. Green line represents the line of best fit and 95% confidence interval (linear regression). Black dashed line at y=x represents perfect accuracy. MAE = mean absolute error. e, Top 10 most important genera for age prediction. Each dot is one of 10 cross-validation folds. X-axis shows the percent increase in mean squared error (MSE) when that particular genus is excluded from a tree within the random forest regressor. In b and c, data are presented as mean ± standard error of the mean (SEM).
Fig. 3 |
Fig. 3 |. Universality of age-associated microbiome changes.
a, We compared 573 samples from DO AL mice to 141 samples from a different mouse aging cohort (“B6”) to 4101 human gut microbiome samples. b, Percentage of genera associated with age (Benjamini-Hochberg adjusted p-value < 0.1) based on linear mixed models (Models 5–7) within each dataset. c, Comparison of age-associated taxonomic changes across datasets. Each pairwise comparison shows all features that passed prevalence filtration in both datasets. Line of best fit and 95% confidence interval shown in gray. Spearman correlation and corresponding p-value shown above each plot. Features associated with age and with the same sign in the pairwise comparison are shown in green. d, Taxonomic uniqueness increases with age in all three datasets. Each panel includes the line of best fit and 95% confidence interval. e, Schematic of cohousing and separation experiment. Y = young always housed with young, O = old always housed with old, CY = young housed with old, CO = old housed with young, exCY = formerly CY that were separated from old, and exCO = formerly CO that were separated from young. f, PCoA (genus-level Bray-Curtis distances) of samples at baseline and one month of cohousing. + denotes group centroid. g, Bray-Curtis distances (n=863) between previously cohoused mice (exCY, exCO) and non-cohoused controls (Y, O). h, Random forest classifier trained on baseline samples and evaluated on cohousing and separation samples. Accuracy is the percentage of samples within each group correctly classified as young or old. i, Uniqueness split by age and cohousing status (n=264 samples). B = baseline, C = cohousing, S2 = 2 weeks of separation, S4 = 4 weeks of separation, etc. In g and i, significance of group differences was evaluated with a t-test, and p-value symbols are defined as follows: ns : p ≥ 0.05, * : p < 0.05, ** : p < 0.01, *** : p < 0.001, **** : p < 0.0001.
Fig. 4 |
Fig. 4 |. Genetic influence on the microbiome.
a, Heritability of n=107 genus-level features as calculated by a linear mixed model (Model 1). p-values were calculated with a likelihood ratio test and adjusted with the Benjamini-Hochberg procedure. Yellow vertical dashed line shows mean heritability for heritable features. b, Percentage of heritable taxa (as reported by the authors) in other studies. The number of samples per study is indicated. The color of each bar indicates whether the study was performed in Diversity Outbred mice, agricultural animals, or humans. c, Proportion of variance explained (PVE) by all experimental variables for 107 genus-level features (Model 10). p-values were calculated using a likelihood ratio test and adjusted with the Benjamini-Hochberg procedure. Horizontal lines show the mean PVE. d, Genome-wide results for the six age-specific significant QTL with Benjamini-Hochberg adjusted p-value < 0.1 (p-values calculated by permutation). Markers with LOD greater than 7.5 are colored red.
Fig. 5 |
Fig. 5 |. Effects of dietary restriction on the microbiome.
a, Effect of dietary restriction (DR) on 107 genus-level features. DR coefficients and standard errors were calculated with a linear mixed model (Model 1). p-values were calculated with a conditional Wald test and adjusted with the Benjamini-Hochberg procedure. Horizontal dashed gray lines are visual aids to help compare across dietary groups. b, UMGS1815 was increased by DR (n=2988 metagenomes). c, Ligilactobacillus was increased by DR (n=2988 metagenomes). d, Absolute magnitude of DR coefficients (n=107 genus-level features). Gray lines connect the same genus in different dietary groups. Horizontal bars show the mean. Statistical significance evaluated by a paired t-test. e, Comparison of DR coefficients. Pearson correlation and p-value is indicated above each scatterplot. Lines of best fit and 95% confidence intervals (linear regression) are shown in purple. f, Mean CR (red) versus mean fasting (blue) coefficients are connected by vertical lines. Genera with opposite signs are opaque, while genera with the same sign are transparent. Dashed horizontal line at 0. g, Emergencia is decreased only by CR (n=2988 metagenomes). AL group median is designated by a horizontal dashed gray line. h, Roseburia is decreased by fasting and increased by caloric restriction (n=2988 metagenomes). i, Receiver operating characteristic (ROC) curves for binary DR prediction. Each gray line is the ROC curve for one of 5 cross-validation folds. The purple line is the mean ROC curve. Diagonal dashed line represents no predictive accuracy. AUC = area under the curve. j, Predicting dietary group before (gray) and after (purple) DR initiation. Each dot represents prediction accuracy in one of 10 cross-validation folds. Horizontal dashed line at 20% represents expected accuracy by chance. Statistical significance evaluated by a one-sided t-test (testing whether the mean accuracy is greater than 20%). k, Prediction accuracy stratified by dietary group. Only predictions after the start of DR were considered. l, Age prediction with a random forest regressor trained on AL samples (n=2618 metagenomes from 5, 10, 16, 22, and 28 months). Vertical dashed line at six months represents DR initiation, diagonal dashed line represents perfect prediction. Statistical significance evaluated by a t-test between AL and DR predictions at each age. m, UBA11957 decreases with both age and DR (n=2988 metagenomes). n, Ligilactobacillus increases with both age and DR (n=2988 metagenomes). In b, c, g, and h, statistical significance evaluated by a t-test against the AL group. For boxplots in b, c, g and h, boxes extend from the 25th to 75th percentiles, whiskers extend to 1.5 times the interquartile range, and the center line is the median. In m and n, data are presented as mean ± SEM. In b-e, g-h, j, and l, p-value symbols are defined as follows: ns: p ≥ 0.05, * : p < 0.05, ** : p < 0.01, *** : p < 0.001, **** : p < 0.0001.
Fig. 6 |
Fig. 6 |. Microbiome-phenotype associations.
a, Association and mediation analyses were used to identify host phenotypes influenced by the microbiome. For association analysis, a linear mixed model was fit for every microbiome feature-phenotype pair, with age, DR, and mouse as covariates (Model 11). For mediation analysis, we tested each microbiome feature-phenotype pair to see which effects of DR are mediated by the microbiome (Models 13–14). b, Percentage of significant (Benjamini-Hochberg adjusted p-value < 0.01) microbiome-phenotype associations per phenotypic assay. p-values were calculated using a likelihood ratio test in which the null model omitted the microbiome term. The denominator for the percentage is the number of microbiome-phenotype pairs tested within each assay. c, Select associations (calculated as in b) between genera and body mass-related phenotypes. Positive associations are red, negative associations are blue. * indicates adjusted p-value < 0.01. d, Paramuriculum is associated with percent fat, as measured by dual-energy X-ray absorptiometry (DEXA). e, Overlap of microbiome-phenotype pairs with significant (adjusted p-value < 0.01) association (Model 11) and mediation (Models 13–14) results. f, Heatmap of select microbiome-phenotype pairs significant by just association analysis (indicated with +) or by both association and 40% CR mediation analysis (indicated with ++). Phenotypes are grouped by phenotypic domain. Positive associations are red, negative associations are blue. Pathways labeled in red are specialized pathways, and their most similar genus is labeled on the right side of the heatmap. g, Akkermansia is associated with energy expenditure. h, Methionine biosynthesis (PWY-7977) is associated with the volume of carbon dioxide produced. i, Percentage of significant (adjusted p-value < 0.01) cross-sectional microbiome-phenotype associations (Model 12) per phenotypic assay. p-values were calculated using a likelihood ratio test. The denominator for the percentage includes associations across all five ages tested. Lifespan is bolded to emphasize the absence of significant microbiome-lifespan associations. In d, g and h, blue lines represent the line of best fit and 95% confidence interval (linear regression).

References

    1. Green CL, Lamming DW & Fontana L Molecular mechanisms of dietary restriction promoting health and longevity. Nat. Rev. Mol. Cell Biol. 23, 56–73 (2022). - PMC - PubMed
    1. Fontana L & Partridge L Promoting health and longevity through diet: from model organisms to humans. Cell 161, 106–118 (2015). - PMC - PubMed
    1. Liao C-Y, Rikke BA, Johnson TE, Diaz V & Nelson JF Genetic variation in the murine lifespan response to dietary restriction: from life extension to life shortening. Aging Cell 9, 92–95 (2010). - PMC - PubMed
    1. Mitchell SJ et al. Effects of Sex, Strain, and Energy Intake on Hallmarks of Aging in Mice. Cell Metab. 23, 1093–1112 (2016). - PMC - PubMed
    1. Pak HH et al. Fasting drives the metabolic, molecular and geroprotective effects of a calorie-restricted diet in mice. Nat. Metab. 3, 1327–1341 (2021). - PMC - PubMed

LinkOut - more resources