. 2025 May;12(20):e2413443.
doi: 10.1002/advs.202413443. Epub 2025 Mar 31.

An Agrin-YAP/TAZ Rigidity Sensing Module Drives EGFR-Addicted Lung Tumorigenesis

Affiliations

An Agrin-YAP/TAZ Rigidity Sensing Module Drives EGFR-Addicted Lung Tumorigenesis

Reza Bayat Mokhtari et al. Adv Sci (Weinh). 2025 May.

Abstract

Despite epidermal growth factor receptor (EGFR) is a pivotal oncogene for several cancers, including lung adenocarcinoma (LUAD), how it senses extracellular matrix (ECM) rigidity remain elusive in the context of the increasing role of tissue rigidity on various hallmarks of cancer development. Here it is shown that EGFR dictates tumorigenic agrin expression in lung cancer cell lines, genetically engineered EGFR-driven mouse models, and human specimens. Agrin expression confers substrate stiffness-dependent oncogenic attributes to EGFR-reliant cancer cells. Mechanistically, agrin mechanoactivates EGFR through epidermal growth factor (EGF)-dependent and independent modes, thereby sensitizing its activity toward localized cancer cell-ECM adherence and bulk rigidity by fostering interactions with integrin β1. Notably, a feed-forward loop linking agrin-EGFR rigidity response to YAP-TEAD mechanosensing is essential for tumorigenesis. Together, the combined inhibition of EGFR-YAP/TEAD may offer a strategy to reduce lung tumorigenesis by disrupting agrin-EGFR mechanotransduction, uncovering a therapeutic vulnerability for EGFR-addicted lung cancers.

Keywords: EGFR, extracellular matrix; YAP/TAZ; agrin; hippo pathway; lung cancer.


Conflict of interest statement

The authors declare no conflict of interest.

Figures
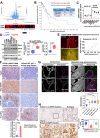
Figure 1
Figure 1
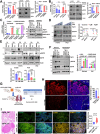
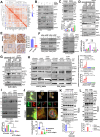
Agrin as a co‐dependent protein for EGFR‐driven lung cancers. A) Agrin (AGRN) as a top candidate gene overexpressed in lung adenocarcinoma with EGFR amplification and mutations (TCGA_dataset, n = 230). Inset shows the heatmap for the correlation of survival based on EGFR and AGRN expression. B) Survival curve based on high and low agrin–EGFR mutation in LUAD (TCGA_Firehose Legacy, n = 230, Log Rank Test, p = 0.02). C,D) RT‐PCR (C) and Western blot (D) showing agrin mRNA and protein levels in a panel of lung adenocarcinoma cell lines categorized based on low/wild‐type or high/mutant EGFR expression. Akt activity is shown in (D). β‐actin served as the loading control for panel D. The mean Agrin protein normalized to EGFR +/− SD and pAkt/Akt ratio are shown (n = 3, Students’ t test, p values indicated). E) Agrin and EGFR immunostaining in tumors extracted from EGFR–L858R–T790 M mouse lungs (n = 3 mice analyzed). Mean intensities for agrin and EGFR are plotted graphically (Pearson's r = 0.75). T‐tumor, ad.lung‐tumor adjacent lung tissue; white arrows point to regions with high agrin and EGFR. Scale bar: 50 µm. F) Representative immunohistochemistry (IHC) images for the indicated proteins in the lung tumors derived from EGFRL858R/T790 M and KRasG12D;p53 (–/–) models (n = 4 sections from four mice, Student's t test, p value indicated). G) Representative confocal microscopy images of normal and lung adenocarcinoma immunostained for EGFR and agrin. For EGFR (upper panels), regions of high expression are computationally determined as magenta, while those expressing low levels are in green. Likewise, high agrin expressing regions are in white while low expression is indicated by magenta (lower panels). Scale bar: 50 µm. Box and Whisker plots show the agrin occupancy normalized to EGFR levels (bars 1–99 percentile, central lines‐median, n = 7–10 tumors analyzed for each stage, one‐way ANOVA, Dunnett's multiple comparison test, p values indicated). H) Representative IHC analysis of Agrin from Roswell Park LUAD patient tissues with either no mutation or EGFR mutations (n = 27 patients). Boxed region presented as enlarged panels. The average Agrin occupancy score is presented as box‐and‐whisker plot (n = 27, Students t test, p value indicated, bars‐1‐99 percentile, central lines‐median).
Figure 2
Figure 2
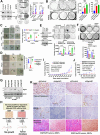
EGFR controls tumorigenic agrin expression. A) RT‐PCR analysis (left) and Western blot (right) for agrin mRNA and protein levels in indicated cell lines treated with EGFR siRNA. β‐actin served as the loading control. Agrin protein densities± SD is quantified (n = 3, Students t test, p values indicated). B) RT‐PCR analysis (left) and Western blot (right) for agrin mRNA and protein levels in indicated cell lines treated with 1 µM AG1478 for 18 h. In the right panel, pEGFR levels indicate targeted action of AG1478 while total EGFR and β‐actin served as controls. Agrin protein densities ±SD were quantified (n = 3, Students t test, p values indicated). C) RT‐PCR analysis of agrin mRNA in H1299 expressing vector, EGFR WT, or its mutants EX19 DEL and EX21 treated with 1 µM AG1478 for 18 h (left panel). Cells treated similarly were analyzed for agrin, pEGFR, and GFP by Western blot. β‐actin served as the loading control (n = 3 biological repeats). (E) (D) The indicated cell lines were treated with increasing doses of osimertinib for 18 h. Cell lysates were analyzed by Western blot for agrin, pEGFR, and EGFR, respectively. β‐actin served as the loading control. Relative agrin and pEGFR proteins were quantified (n = 3, multiple t test, p values indicated). E,F) H1975, PC9, and H1299 expressing EGFR, or its mutants were treated with 10 nM osimertinib for the indicated time. Resulting cell lysates were analyzed for the same proteins as in panel (F). Data presented as mean agrin protein intensity ± SD normalized to actin (H) (n = 3 repeats, Students t test, p values indicated) (G) Schematic showing the EGFR–L858R–T790 M based mouse lung adenocarcinoma model. Mean tumor volume (imaged by MRI) of mouse lungs treated with vehicle or CO‐1686 is presented (n = 3 animals/group). H) Representative confocal microscopy images showing agrin expression in mouse lung tumors from (I). T‐tumor; Ad.lung‐adjacent lung (n = 3 animals/group, data presented as the mean +/− SD, Student's t test, p value is indicated). Scale bar: 50 µm. I) Adenovirus‐Cre‐mediated activation of EGFR–L858R–T790 M showing the development of tumors in mouse lungs, as represented by Hematoxylin–Eosin‐stained images (left). Representative confocal microscopy images showing agrin expression in mouse lungs. Dashed region‐Tumor. The mean +/− SD agrin intensity is shown (n = 3 animals per group, Student's t test, p value indicated). Scale bar: 20 µm.
Figure 3
Figure 3
Agrin bestows ECM‐stiffness‐oncogenic traits to EGFR‐addicted cancer cells. A) Western blot validating agrin knockdown in the indicated cell lines (left). 10 000 cells were plated on 0.2 or 30 kPa substrate and analyzed for colony formation after day 5. Representative colony images are shown, and mean number of colonies±SD were quantified using ImageJ (n = 3, multiple t test, p values indicated). B) Indicated cell lines cultured on 0.5 kPa substrates were treated with increasing doses of sAgrin for 5 days. Representative colony images are shown. Results were quantified as in panel (A) (n = 3, data presented as the mean +/− SD, Student's t test, *p = 0.03, ***p = 0.004, 0.001, **p = 0.02, respectively). C,D) Indicated cell lines were 3D‐cultured in VitroGel matrix corresponding to 0.5 kPa either alone or containing increasing concentrations of sAgrin for 48 h (C). The shControl, agrin‐depleted cells, and those treated with 10 µg/mL sAgrin were cultured on 30 kPa stiff collagen matrix for 2 days. Representative bright‐field images of tumor spheres are shown for both panels. The number of protrusive structures is quantified for each condition (experiment repeated three times, n = 3 spheres analyzed for each group, Student's t test, p values indicated). E,F) Western blot validating EGFR knockdown in the indicated cell lines. Representative colony images of control, EGFR silenced, and those treated with 10 µg/mL sAgrin on 0.2 kPa (E) and 30 kPa (F) (n = 3, mean colony number±SD, Students t test, p values shown). G) Western blot validating the loss of agrin in H1299 EGFR WT and Ex19DEl. β‐actin served as the loading control. H) Schematic showing the stiffness‐based tumorigenic model for control and agrin depleted EGFR‐addicted cells. I–J) Tumor volumes of shControl and shAgrin EGFR WT and EX19DEL subcutaneously injected with stiff VitroGel in NOD/SCID mice (n = 5 animals/group; data presented as the mean +/− SEM, two‐way ANOVA, p values indicated). (K) Representative images of Ki67, cleaved caspase‐3, and CD‐31 immunohistochemistry in EGFR WT and Del19 control and agrin‐depleted tumors (n = 3 tumors per condition). Scale bar: 100 µm.
Figure 4
Figure 4
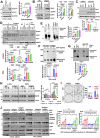
Agrin conveys ECM‐rigidity responses to EGFR. A) Western blot analysis showing EGFR activity of PC9 cells seeded on 0.2 kPa with 10 µg/mL indicated ECM agents for 1 h. Mean agrin intensity±SD was quantified (n = 3, One‐Way ANOVA, p values indicated). B) Untreated PC9 cells were seeded on soft (0.5 kPa), stiff (30 kPa), or plastic dishes either alone or containing 10 µg/mL sAgrin for 1 day. Cell lysates were analyzed by Western blot for the indicated proteins. GAPDH served as the loading control. Mean Agrin and pEGFR intensities±SD presented as heat map (n = 3, Multiple t tests, p values indicated). (C) Control and EGFR‐silenced H1975 on indicated substrates are assessed for Agrin and EGFR expression by Western blot. Mean agrin protein±SD levels were quantified (n = 2, multiple t tests, p values indicated) (D) Control and agrin siRNA were seeded similarly as in (B) either alone or in the presence of sAgrin in the substrates. Cell lysates were analyzed as in (B). Mean pEGFR intensities±SD presented (n = 3, multiple t tests, p values indicated). (E) Western blot analysis of PC9 lysates on 0.5 kPa treated with EGF (5 ng/mL), sAgrin (1 µg/mL), or their combination for 30 min and then treated with bis(sulfosuccinimidyl) suberate (BS3; 2 mM) for 30 min. The ratio of dimerized/monomer densities are presented as mean±SD (n = 3, multiple t tests, p values indicated). (F) Control and agrin knockdown PC9 seeded on 0.5 kPa and treated with 5 ng/mL EGF for 30 min and processed and quantified as in panel (E) (n = 3, Multiple t tests, p values shown). (G) Wild‐type (WT) or agrin KO PC9 seeded on 30 kPa treated with EGF or sAgrin as in (E‐F). Whole cell lysates were probed by Western blot for the EGFR as in (D). Results quantified as in panel (E). H) Western blot analysis of whole cell lysates of H1975 on 0.2 and 30 kPa containing indicated concentrations of sAgrin either treated with an isotype control (black dotted) or anti‐agrin antibody for 4 h. β‐Actin served as the loading control. Mean pEGFR±SD levels are presented (n = 3, Students’ t tests, p values indicated). (I) Colony formation of H1975 treated with isotype or agrin antibodies for 5 days on 0.2 or 30 kPa substrates. The mean number of colonies±SD are shown (n = 3, Multiple t tests, p values indicated). J) Western blot analysis of cell lysates treated with EGF for indicated time post‐serum starvation and analyzed for the indicated proteins (n = 3 repeats, data quantified as the mean pEGFR band intensity +/− SD, Student's t test, p values indicated).
Figure 5
Figure 5
Agrin‐dependent matrix mechanosensitizes EGFR to integrin β1. A) Adhesion on indicated control, agrin‐depleted cells, and those pre‐treated with 10 µg/mL sAgrin for 18 h on 30 kPa. At indicated timepoints, cell lysates were analyzed by Western blotting for indicated proteins. β‐Actin served as the loading control. Data quantified as the mean pEGFR band intensity +/− SD, n = 3, Student's t test, p values indicated). Left panel shows Western blot from cells that were suspended (non‐adherent) for 1h. B–G) Co‐immunoprecipitation (Co‐IP) with EGFR antibody in control and agrin‐depleted cells on 30 kPa (B, E) or 0.5 kPa (C, D, F, and G) treated with indicated amounts of sAgrin for 18 h. For panel D, agrin knockdown cells were either pre‐treated with RGD inhibitor for 2 h before being treated with sAgrin, or sAgrin (10µg/mL), FN (10µg/mL) and collagen‐1 (10µg/mL) for 18 h, and subsequently the EGFR‐pulldown assay was performed. The blot was probed for integrin β1 and EGFR as the control. Twenty percent whole cell lysates were run as input (repeated thrice). H) Molecular docking surface model simulation showing the sAgrin‐induced (beige) juxtaposed with the extracellular domains (ECD) of EGFR (purple)‐Integrin β1 (cyan). I) A working model for agrin deposition in stiff ECM that clusters pEGFR to integrins. J) WT and agrin KO cells were plated on 2 or 4 µm pillars alone or containing 10 µg/mL sAgrin for 4–6 h. Representative confocal images stained for pEGFR and integrin β1 are shown. The number of co‐localized clusters presented as the mean +/− SD, n = 15–20 cells/condition, Student's t test, p values indicated. Scale bar: 10 µm. White arrows indicate clusters. (K) Western blot showing EGFR activation in control or β1‐silenced cells alone or treated with 10µg/mL sAgrin for 18 h on soft, stiff and plastic plates. Actin served as loading controls. The mean pEGFR band intensity +/− SD is presented, n = 3, Student's t test, p values indicated. L) Representative brightfield images of colony formation in H1975 on soft and stiff substrates from panel (I) (n = 3, multiple t test, p values indicated).
Figure 6
Figure 6
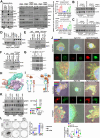
YAP/TAZ feedback on agrin–EGFR mechanotransduction. A) Heatmap showing AGRN amongst YAP/TAZ target genes based on TCGA_LUAD datasets (n = 515). B) Western blot analysis in the indicated control, EGFR, and agrin‐silenced cell lines for the indicated proteins. GAPDH served as the loading control (three biological repeats). C) Western blot analysis in whole‐cell lysates from control and EGFR knockdown H1975 treated with increasing concentrations of sAgrin for 18 h. β‐Actin served as the loading control. The mean pYAP± SD is shown (n = 3, multiple t tests). D) Indicated stably expressed H1299 cells expressing vector, EGFR‐WT, or its mutants were treated with control or agrin siRNA. After 72 h, one batch of agrin knockdown cells were treated with 10 µg/mL sAgrin for 18 h. Cell lysates were analyzed by Western blot for the indicated proteins. GAPDH served as the loading control (three biological repeats). E) IHC images of EGFR–L858R–T90 M mouse lung adenocarcinoma after vehicle or CO‐1686 treatment showing the YAP expression. Scale bar: 100 µm. Boxed region presents the enlarged panel. Black arrow shows cytoplasmic YAP. Nuclear YAP fraction represented as the mean +/− SD (n = 3 tumors per group, unpaired Student's t test, p value indicated). F) Western blot analysis of cell lysates from control or siYAP H1975 cells on 0.5 or 30 kPa in the presence/absence of 10 µg/mL sAgrin (left panels) or increasing doses (right panels) for 18 h on 0.5 kPa (right). β‐Actin served as the loading control (n = 3 repeats, data quantified as the mean pEGFR band intensity +/− SD, One‐Way ANOVA, p values indicated). (G) Western blot of H1299 cells expressing vector, EGFR‐WT, or its mutants were treated with control or YAP/TAZ (Y/T) siRNA and treated the same as in (D). (H) Western blot analysis of whole cell lysates from the control, siYAP, and those treated with sAgrin on 30 kPa substrates in the presence of EGF treatment for the indicated timepoints. GAPDH served as the loading control, n = 3 repeats, data quantified as the mean pEGFR band intensity +/− SD, Student's t test, p values indicated. I) Adhesion on the indicated control, Y/T‐depleted cells, and those pre‐treated with 10 µg/m sAgrin for 18 h on 30 kPa. At indicated timepoints, cell lysates were analyzed by Western blotting for indicated proteins. β‐Actin served as the loading control, n = 3, data quantified as the mean pEGFR band intensity +/− SD, Student's t test, p values shown. J) Control and Y/T‐depleted cells were plated on 4 µm pillars alone or containing 10 µg/mL sAgrin for 4–6 h. Representative confocal images stained for pEGFR and integrin β1 are shown. The number of co‐localized clusters presented as the mean +/− SD, n = 10–20 cells/condition, Student's t test, p values indicated. White arrows indicate clusters. Scale bar: 10 µm. (K) PC9 cells on 30 kPa were treated with indicated dose of defactinib for 4 h alone or in the presence of pre‐treatment with sAgrin for 16 h. Resulting cell lysates were analyzed for the indicated proteins. GAPDH served as a loading control (n = 2 repeats). (L) Control and FAK knockdown H1975 on 0.2 kPa were stimulated by sAgrin (10µg/mL) for 16h. Cell lysates were analyzed by Western blotting for the indicated proteins. GAPDH served as a loading control. Quantification of pTyr357/S127 of YAP is shown for panels K‐L (n = 2 repeats, multiple t tests).
Figure 7
Figure 7
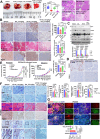
Dual targeting of EGFR–YAP/TEAD restricts lung tumorigenesis by agrin downregulation. A) Representative photograph of mouse lungs bearing tumors (marked by white dashed lines) derived from implantation of H1299del19 that received vehicle, osimertinib (2.5 mg kg−1), VT107 (10 mg kg−1), and their combinations for five times every 3 days. Scale: 1 cm. Hematoxylin and Eosin‐stained images of lungs from different treatments after one month. Scale bar: 50 µm. The number of visible tumor nodules (in black) are presented as the mean +/− SD (n = 9 mice/group, multiple t tests, p values indicated). B) Representative IHC images of mouse lung tumors for Ki67, CD‐31, and Masson's Trichrome amongst treatment groups as in (A). Scale bar: 50 µm. The mean intensities +/− SD are quantified (n = 3 tumors from three mice/condition, multiple t tests, p values indicated). C) Western blot analysis from lysates from lung tumors of different treatment groups for the indicated proteins. β‐Actin served as the loading control. Data quantified from n = 3 tumors from three mice, multiple t test, p values indicated). D) Representative IHC images for PDX#20 and #18 tumors stained with indicated EGFR‐mutant specific antibodies. Scale bar: 50 µm. (E) Tumor volumes of PDX#20 and #18 injected subcutaneously in NOD/SCID mice and receiving the vehicle, osimertinib (2.5 mg kg−1), VT107 (10mg kg−1), and their combination on indicated days (black arrow) (n = 5 mice/group). F) Representative IHC images of PDX#20 for Ki67, CD‐31, and Masson's Trichrome amongst various treatment groups as in (E). Boxed region of YAP/TAZ staining presented as enlarged panels. Results are presented as the mean +/− SD (n = 3–4 sections. from three mice per condition, unpaired Student's t test, p values indicated). Scale bar: 100 µm. G) Confocal microscopy images showing pEGFR and integrin β1 mechanosensitive junctions in PDX#20 tumors treated as in (E). Scale bar: 50 µm. Inset shows the enlarged region. The co‐localized EGFR‐β1 clusters presented as the mean +/− SD (n = 3 sections from three tumors, Student's t test, p values indicated).

References

    1. a) Humphrey J. D., Dufresne E. R., Schwartz M. A., Nat. Rev. Mol. Cell Biol. 2014, 15, 802; - PMC - PubMed
    2. b) Krause D. S., Van Etten R. A., N. Engl. J. Med. 2005, 353, 172,. - PubMed
    1. Gridelli C., Rossi A., Carbone D. P., Guarize J., Karachaliou N., Mok T., Petrella F., Spaggiari L., Rosell R., Nat. Rev. Dis. Primers 2015, 1, 15009. - PubMed
    1. Hirsch F. R., Varella‐Garcia M., P. A. Bunn, Jr. , Di Maria M. V., Veve R., Bremmes R. M., Baron A. E., Zeng C., Franklin W. A., J. Clin. Oncol. 2003, 21, 3798. - PubMed
    1. a) Sharma S. V., Bell D. W., Settleman J., Haber D. A., Nat. Rev. Cancer 2007, 7, 169; - PubMed
    2. b) Shigematsu H., Lin L., Takahashi T., Nomura M., Suzuki M., Wistuba I. I., Fong K. M., Lee H., Toyooka S., Shimizu N., Fujisawa T., Feng Z., Roth J. A., Herz J., Minna J. D., Gazdar A. F., J. Natl. Cancer Inst. 2005, 97, 339. - PubMed
    1. Cooper A. J., Sequist L. V., Lin J. J., Nat. Rev. Clin. Oncol. 2022, 19, 499. - PMC - PubMed

MeSH terms

LinkOut - more resources