

Enhancing access to nephrology care: telenephrology dashboard optimization via human-centered design
- PMID: 40165098
- PMCID: PMC11956470
- DOI: 10.1186/s12882-025-04076-5
Enhancing access to nephrology care: telenephrology dashboard optimization via human-centered design
Abstract
Background: Ensuring that patients, especially those in underserved areas, have access to specialized nephrology care is essential to addressing the increasing burden of chronic kidney disease. To address this, we developed the Telenephrology Dashboard for the 150,000 Veterans served by the Iowa City Veterans Affairs Health Care System (ICVAHCS). Our goal was to optimize the dashboard as a comprehensive and practical tool for end-users in order to monitor kidney health and facilitate remote nephrology consultations.
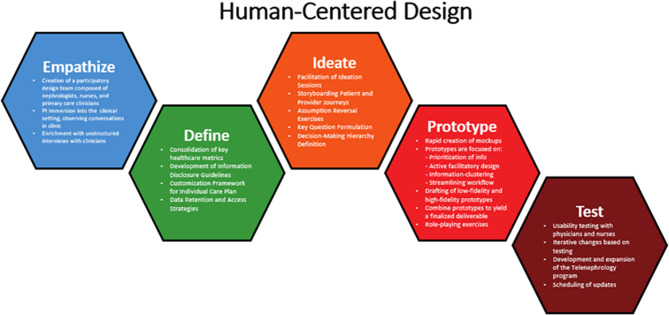
Methods: The optimization process adhered to the Human-Centered Design (HCD) framework, encompassing five stages: Empathize, Define, Ideate, Prototype and Test. Research team members spent 10 h observing nephrologists during remote consultations and supplemented these observations with semi-structured interviews with clinicians to gain insights into existing workflows and challenges. A rapid ideation workshop was then held to propose innovative solutions that balanced technical needs with user preferences. Subsequent prototyping and testing helped refine and evaluate the proposed designs, identifying key areas for improvement.
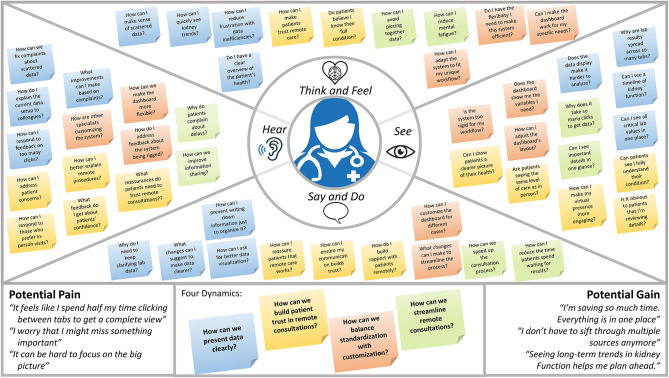
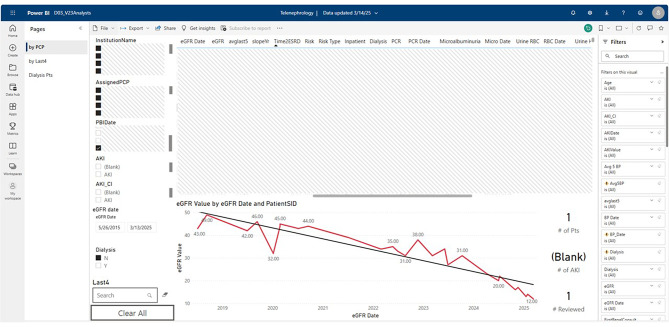
Results: The iterative design process identified three critical needs: (1) improved clarity in visual data representation, (2) enhanced data accuracy, and (3) a balance between standardized features and customization options. Five dashboard prototypes were created, tested, and iteratively refined into a final version. The completed Telenephrology Dashboard includes five core features: (1) graphical representation of kidney function trends, (2) tables summarizing key lab data, (3) functionality to examine specific events in detail, (4) customizable views tailored to user workflows, and (5) integration of predictive kidney disease progression models.
Conclusion: The Telenephrology Dashboard was developed using a Human-Centered Design approach to improve remote nephrology consultations. Future efforts will focus on evaluating its impact on user satisfaction, referring clinician satisfaction, access to nephrology care, and patient care outcomes.
Clinical trial number: Not applicable, as this is not a clinical trial.
Keywords: Chronic kidney disease; Clinical decision support; Dashboard; Quality improvement; Telehealth; Telenephrology.
© 2025. This is a U.S. Government work and not under copyright protection in the US; foreign copyright protection may apply.
Conflict of interest statement
Declarations. Ethics and consent to participate: This study was reviewed by the Institutional Review Board (IRB) of the Iowa City Veterans Affairs Health Care System (University of Iowa IRB-03 under the Human Subjects Office). As a quality improvement project, it was determined to be exempt from IRB review under the provisions of 45 CFR 46 Sect. 101(b). The need for informed consent was waived based on this determination by the Iowa City Veterans Affairs Health Care System IRB (University of Iowa IRB-03). Consent to publish: Not applicable. Competing interests: The authors declare no competing interests.
Figures
References
MeSH terms
Grants and funding
LinkOut - more resources
Full Text Sources
Medical
Miscellaneous
