. 2025 Mar 31;25(1):445.
doi: 10.1186/s12879-025-10822-9.

Integrated bioinformatics and experiment validation reveal cuproptosis-related biomarkers and therapeutic targets in sepsis-induced myocardial dysfunction

Affiliations

Integrated bioinformatics and experiment validation reveal cuproptosis-related biomarkers and therapeutic targets in sepsis-induced myocardial dysfunction

Xuemei Shi et al. BMC Infect Dis. .

Abstract

Background: Sepsis-induced myocardial dysfunction (SIMD) is a serious sepsis complication with high mortality, yet current diagnostic and therapeutic approaches remain limited. The lack of early, specific biomarkers and effective treatments necessitates exploration of novel mechanisms. Recently, cuproptosis has been implicated in various diseases, but its role in SIMD is unclear. This study aimed to identify cuproptosis-related biomarkers and potential therapeutic agents, supported by animal model validation.

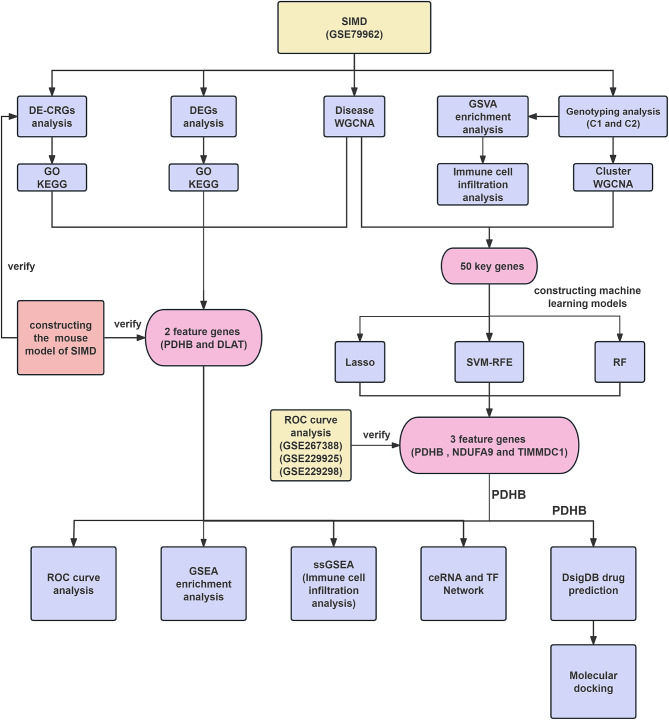
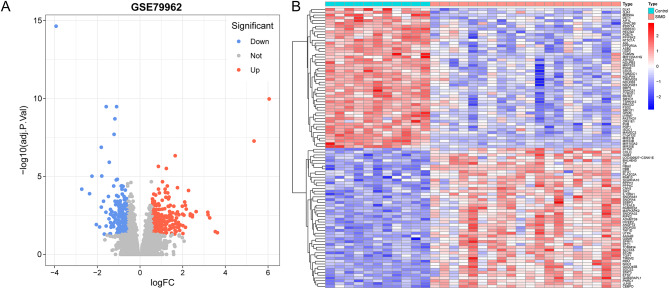
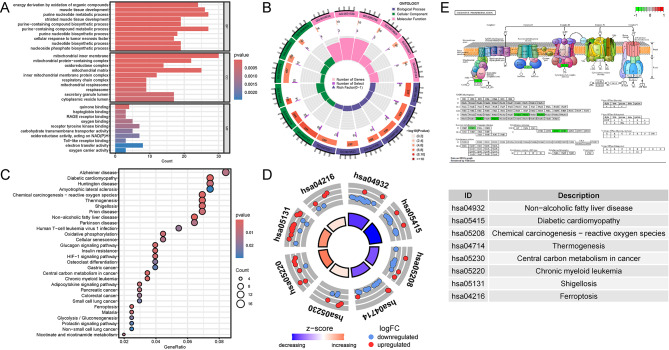
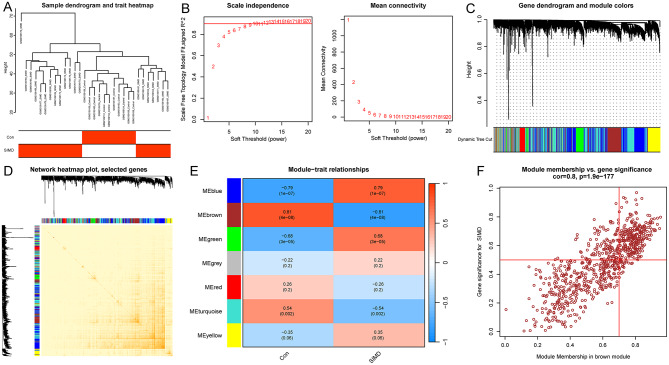
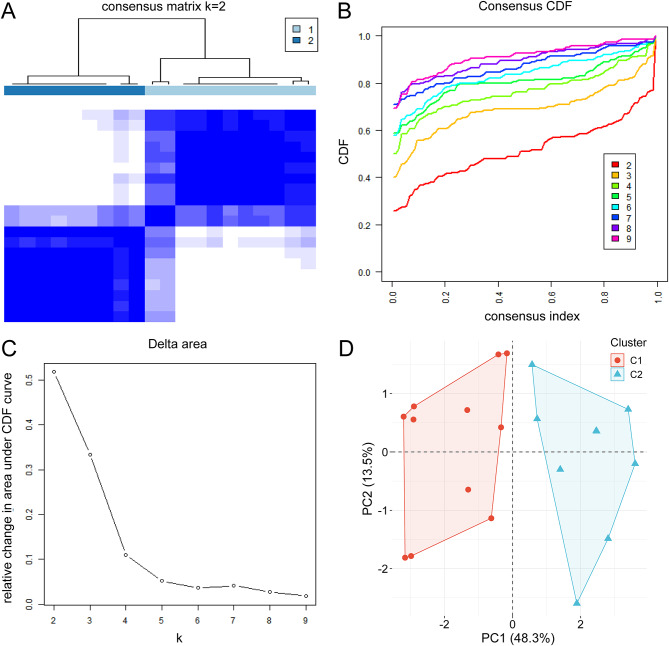
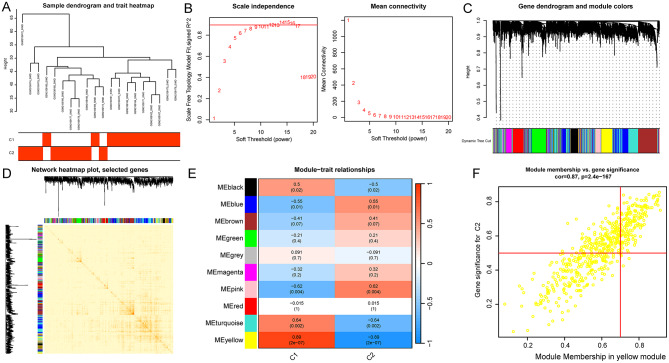
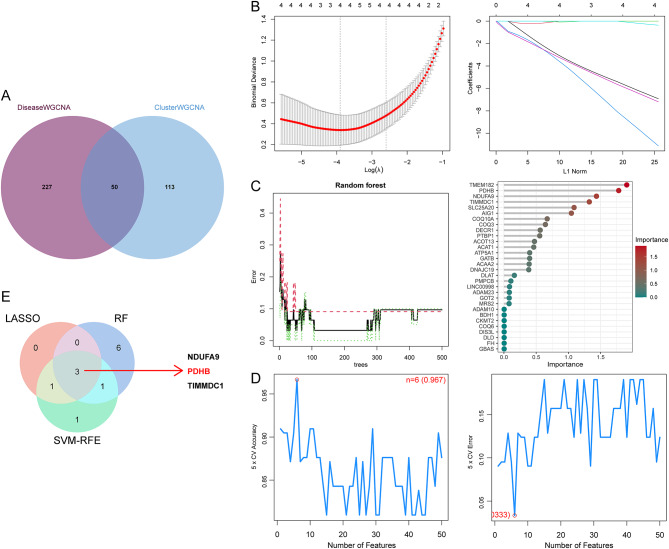
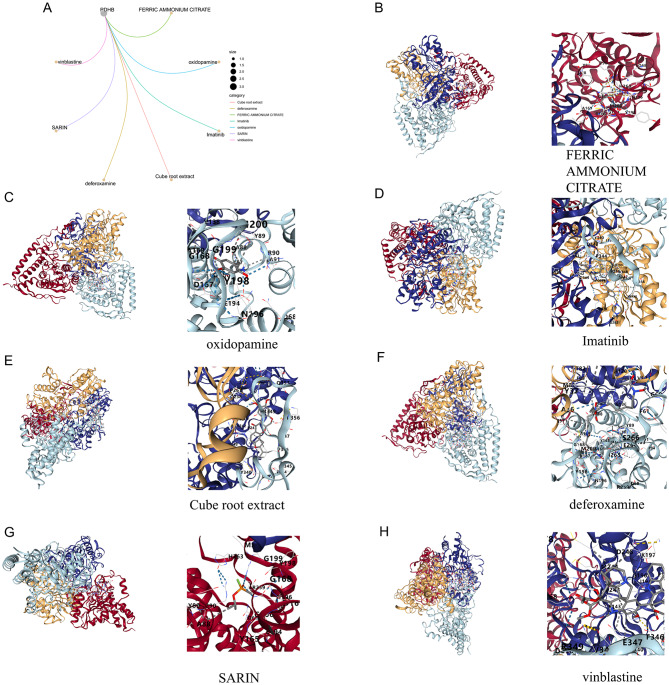
Methods: Four GEO datasets (GSE79962, GSE267388, GSE229925, GSE229298) were analyzed using Limma and WGCNA to identify overlapping genes from differentially expressed genes (DEGs), cuproptosis-related DEGs (DE-CRGs), and module-associated genes. Gene Set Enrichment Analysis (GSEA) and single-sample GSEA (ssGSEA) were performed to assess biological functions and immune cell infiltration, respectively. ceRNA and transcription factor networks were constructed to explore gene regulatory mechanisms, while consensus clustering was employed to define cuproptosis-related subtypes. Diagnostic genes were selected through SVM-RFE, LASSO, and random forest models. Additionally, potential gene-targeting agents were predicted using drug-gene interaction analysis. The findings were validated in SIMD animal models through qPCR and immunohistochemical analysis to confirm gene expression.

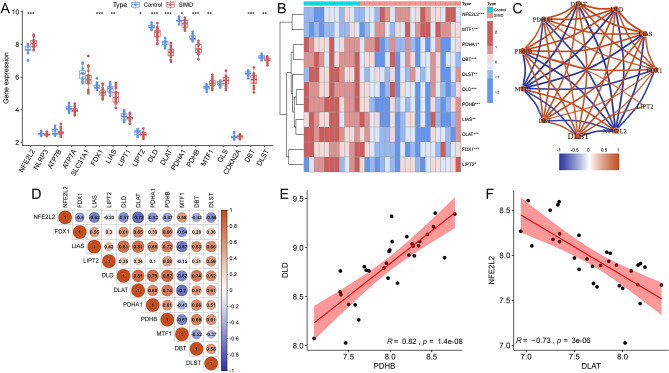
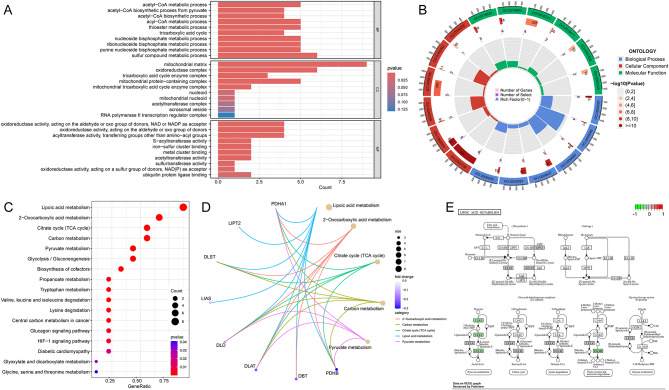
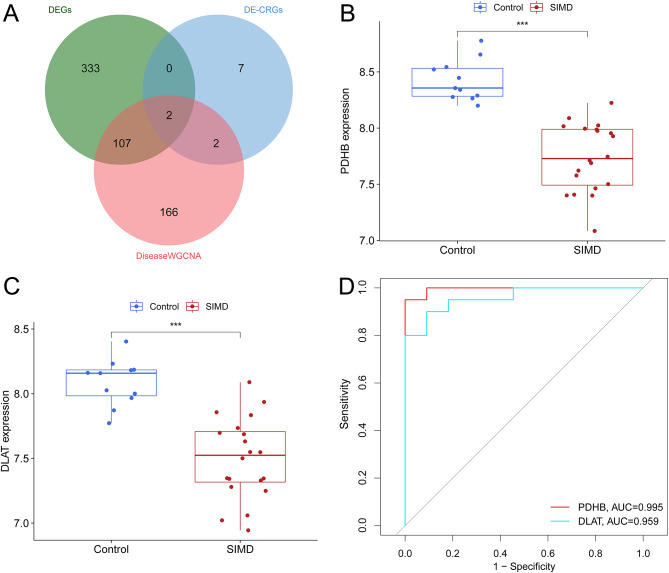
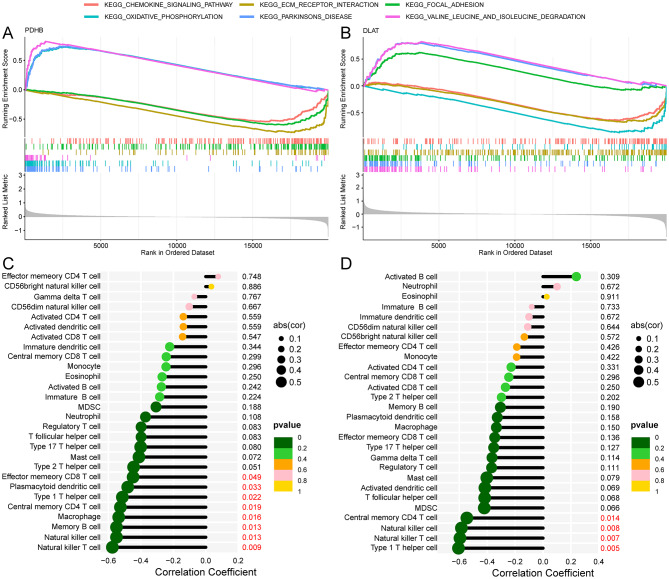
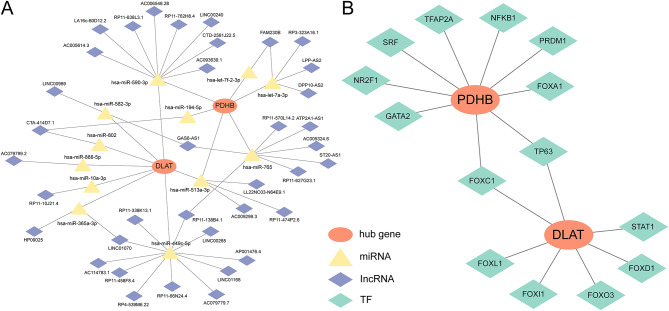
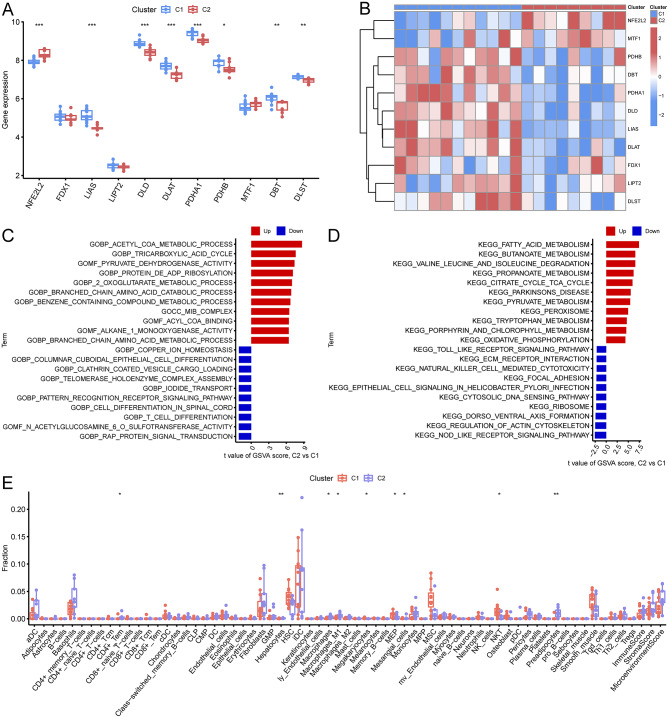
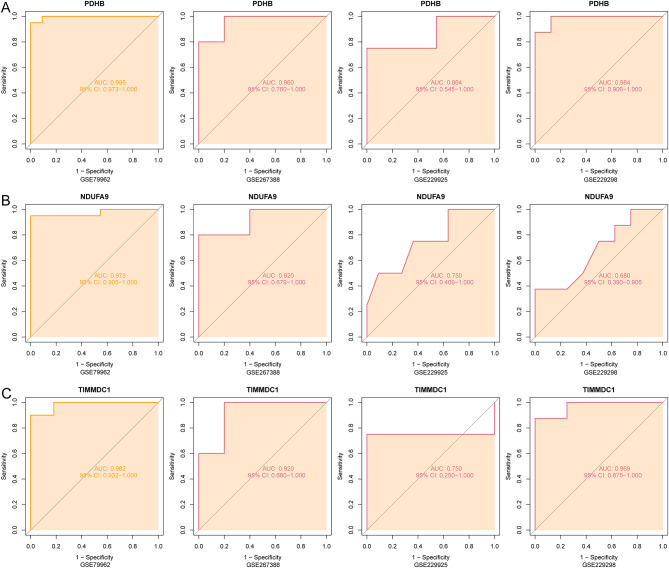
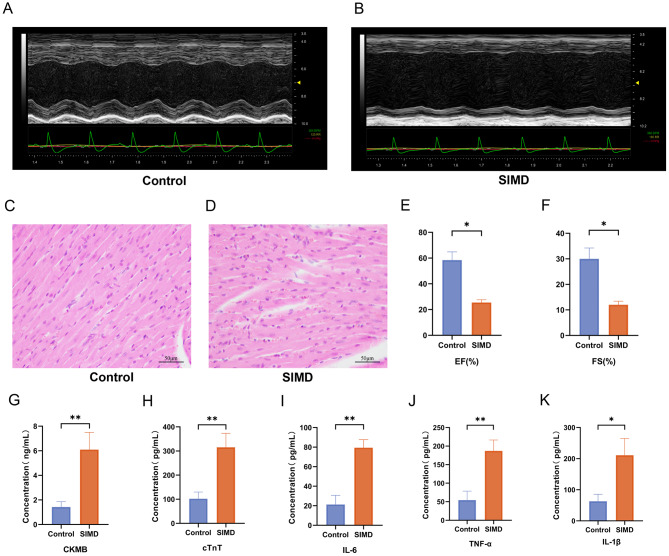
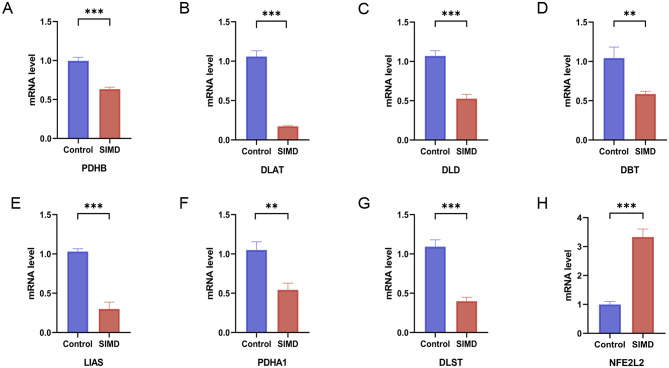
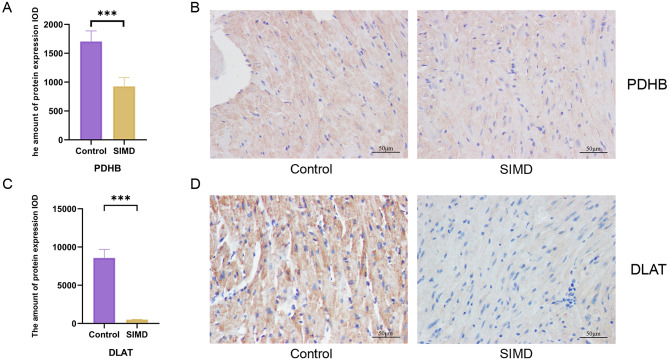
Results: PDHB and DLAT emerged as key cuproptosis-related biomarkers. GSEA indicated upregulation of oxidative phosphorylation and downregulation of chemokine signaling. ssGSEA revealed negative correlations with several immune cell types. A ceRNA network (51 nodes, 56 edges) was constructed. Machine learning identified PDHB, NDUFA9, and TIMMDC1 as diagnostic genes, with PDHB showing high accuracy (AUC = 0.995 in GSE79962; AUC = 0.960, 0.864, and 0.984 in external datasets). Using the DSigDB database, we predicted six drugs that exhibit significant binding activity with PDHB. qPCR and immunohistochemistry confirmed reduced PDHB and DLAT expression in SIMD animal models.

Conclusion: This study identifies PDHB and DLAT as cuproptosis-related biomarkers, addressing the diagnostic and therapeutic gaps in SIMD by unveiling novel molecular insights for early intervention and targeted treatment.

Clinical trial number: Not applicable.

Keywords: Biomarkers; Cuproptosis-related genes; Machine learning; Molecular mechanism; Sepsis-induced myocardial dysfunction; Therapeutic targets.


Conflict of interest statement

Declarations. Ethics approval and consent to participate: Studies involving animals have been reviewed and approved by the Ethics Committee of the Affiliated Hospital of Southwest Medical University. NO.:20231016-013. Consent for publication: Not Applicable. Competing interests: The authors declare no competing interests.

Figures

Fig. 1
Fig. 1
The flowchart of this study. SIMD, sepsis-induced myocardial dysfunction; DE-CRGs, differentially expressed cuproptosis-related genes; DEGs, differentially expressed genes; GO, gene ontology; KEGG, kyoto encyclopedia of genes and genomes; WGCNA, weighted gene co-expression network analysis; ROC, receiver operating characteristic. GSEA, gene set enrichment analysis; ssGSEA, single-sample gene set enrichment analysis; ceRNA, competing endogenous RNA; GSVA, gene set variation analysis; Lasso, least absolute shrinkage and selection operator; SVM-RFE, support vector machine-recursive feature elimination; RF, radio frequency; DSigDB, drug signatures database
Fig. 2
Fig. 2
Data preprocessing for differentially expressed genes (DEGs). A Volcano plot in GSE79962. B Heatmap of DEGs expression. Red represent up-regulation and blue represent down-regulation
Fig. 3
Fig. 3
Functional enrichment study based on DEGs. A, B GO analysis from three perspectives: biological processes, cellular composition, and molecular function. C, D KEGG pathway analysis. E Pathways of Oxidative phosphorylation
Fig. 4
Fig. 4
Differential expression and correlation analysis of CRGs in SIMD. A Box diagram and (B) heatmap of the 19 CRGs between between SIMD and normal samples. C Correlation coefficient network and (D) matrix diagram between the 11 DE-CRGs. E The Pearson correlation coefficient graph displayed the strongest positive and (F) the strongest negative correlation. *P < 0.05, **P < 0.01, ***P < 0.001
Fig. 5
Fig. 5
Functional enrichment study based on DE-CRGs. A, B GO analysis from three perspectives: biological processes, cellular composition, and molecular function. C, D KEGG pathway analysis. E Pathways of lipoic acid metabolism
Fig. 6
Fig. 6
Key modules and genes identified by WGCNA in SIMD. A Sample dendrogram and trait heatmap. B Scale-free fit parameters of different soft-thresholding powers and the average connectivity. C Cluster dendrogram of different co-expression modules. D Network heatmap plot of 7 modules. E Heatmap of module-trait correlations. F Scatter plot of module membership and gene significance in the brown module
Fig. 7
Fig. 7
Identifying the feature genes. A Venn diagram of DEGs, DE-CRGs and DiseaseWGCNA. B PDHB expression. C DLAT expression. D Quantification of ROC curves values of AUC for PDHB and DLAT
Fig. 8
Fig. 8
Gene set enrichment analysis (GSEA) and immune characteristics correlation analysis. The pathway related to two genes (A) PDHB and (B) DLAT. Correction between (C) PDHB and (D) DLAT
Fig. 9
Fig. 9
Characteristic gene regulatory network. A lncRNA-miRNA-mRNA ceRNA network. B mRNA-TF network
Fig. 10
Fig. 10
Identification of cuproptosis-related clusters in SIMD patients. A Consensus clustering analysis of 11 DE-CRGs at k = 2. B Consensus index of the cumulative distribution function (CDF). C Relative change in the area under the CDF delta curves for k = 2 by increasing the index from 2 to 9. D Principal component analysis (PCA)
Fig. 11
Fig. 11
Differential expression and enrichment analysis of clusters. The expression levels of the 11 DE-CRGs in the two clusters are shown in the box diagram (A) and (B) heatmap. C GSVA of GO terms between C1 and C2 clusters. D GSVA of KEGG terms between C1 and C2 clusters. E Box plot of immune cell infiltration. *P < 0.05, **P < 0.01, ***P < 0.001
Fig. 12
Fig. 12
Key modules and genes identified by WGCNA in Clusters. A Sample dendrogram and trait heatmap. B Scale-free fit parameters of different soft-thresholding powers and the average connectivity. C Cluster dendrogram of different co-expression modules. D Network heat map plot of 10 modules. E Heatmap of module-trait correlations. F Scatter plot of module membership and gene significance in the yellow module
Fig. 13
Fig. 13
Construction of three machine learning models. A Venn diagram of DiseaseWGCNA and ClusterWGCNA. B Regression coefficient path diagram and cross-validation curves in LASSO. C The identification of feature importance based on random forests. D The curve of change in the predicted true and error value of each gene in SVM-RFE. E Venn diagram of the there feature genes obtained from the LASSO, SVM-RFE, and RF
Fig. 14
Fig. 14
ROC curves and area under the curve of (A) PDHB, (B) NDUFA9 and (C) TIMMDC1 in GSE79962 and three external datasets
Fig. 15
Fig. 15
Prediction of the top 7 candidate drugs for SIMD based on PDHB. A The netplot of PDHB with 7 drugs. Molecular docking between PDHB and (B) FERRIC AMMONIUM CITRATE, (C) oxidopamine, (D) Imatinib, (E) Cube root extract, (F) deferoxamine, (G) SARIN and (H) vinblastine
Fig. 16
Fig. 16
Construction of SIMD mouse model. A, B Representative echocardiographic images. C, D Representative images showing HE-stained sections of heart tissues. Scale bar: 50 mm. Echocardiographic data comparing left ventricle (E) ejection fraction (EF) and (F) fractional shortening (FS). ELISA results for (G) CKMB, (H) cTnT, (I) IL-6, (J) TNF-α, and (K) IL-1β in heart tissues. *P < 0.05, **P < 0.01
Fig. 17
Fig. 17
The mRNA differential expression of (A) PDHB, (B) DLAT, (C) DLD, (D) DBT, (E) LIAS, (F) PDHA1, (G) DLST, (H) NFE2L2 was analyzed by PCR in SIMD mouse and controls. **P < 0.01, ***P < 0.001
Fig. 18
Fig. 18
Immunohistochemical staining analysis of two feature genes. A Quantitative immunohistochemical profiling of PDHB expression. B Immunohistochemical staining for PDHB. C Quantitative immunohistochemical profiling of DLAT expression. D Immunohistochemical staining for DLAT. ***P < 0.001

Similar articles

References

    1. Parrillo JE, Parker MM, Natanson C, Suffredini AF, Danner RL, Cunnion RE, Ognibene FP. Septic shock in humans. Advances in the Understanding of pathogenesis, cardiovascular dysfunction, and therapy. Ann Intern Med. 1990;113(3):227–42. - PubMed
    1. Neri M, Riezzo I, Pomara C, Schiavone S, Turillazzi E. Oxidative-Nitrosative Stress and Myocardial Dysfunctions in Sepsis: Evidence from the Literature and Postmortem Observations. Mediators Inflamm 2016, 2016:3423450. - PMC - PubMed
    1. Hollenberg SM, Singer M. Pathophysiology of sepsis-induced cardiomyopathy. Nat Rev Cardiol. 2021;18(6):424–34. - PubMed
    1. Adamcova M, Šimko F. Multiplex biomarker approach to cardiovascular diseases. Acta Pharmacol Sin. 2018;39(7):1068–72. - PMC - PubMed
    1. Lutsenko S. Human copper homeostasis: a network of interconnected pathways. Curr Opin Chem Biol. 2010;14(2):211–7. - PMC - PubMed

LinkOut - more resources