. 2025 Mar 31;24(1):102.
doi: 10.1186/s12943-025-02293-y.

C1Q+ TPP1+ macrophages promote colon cancer progression through SETD8-driven p53 methylation

Affiliations

C1Q+ TPP1+ macrophages promote colon cancer progression through SETD8-driven p53 methylation

Veronica Veschi et al. Mol Cancer. .

Abstract

Background: In many tumors, the tumor suppressor TP53 is not mutated, but functionally inactivated. However, mechanisms underlying p53 functional inactivation remain poorly understood. SETD8 is the sole enzyme known to mono-methylate p53 on lysine 382 (p53K382me1), resulting in the inhibition of its pro-apoptotic and growth-arresting functions.

Methods: We analyzed SETD8 and p53K382me1 expression in clinical colorectal cancer (CRC) and inflammatory bowel disease (IBD) samples. Histopathological examinations, RNA sequencing, ChIP assay and preclinical in vivo CRC models, were used to assess the functional role of p53 inactivation in tumor cells and immune cell infiltration.

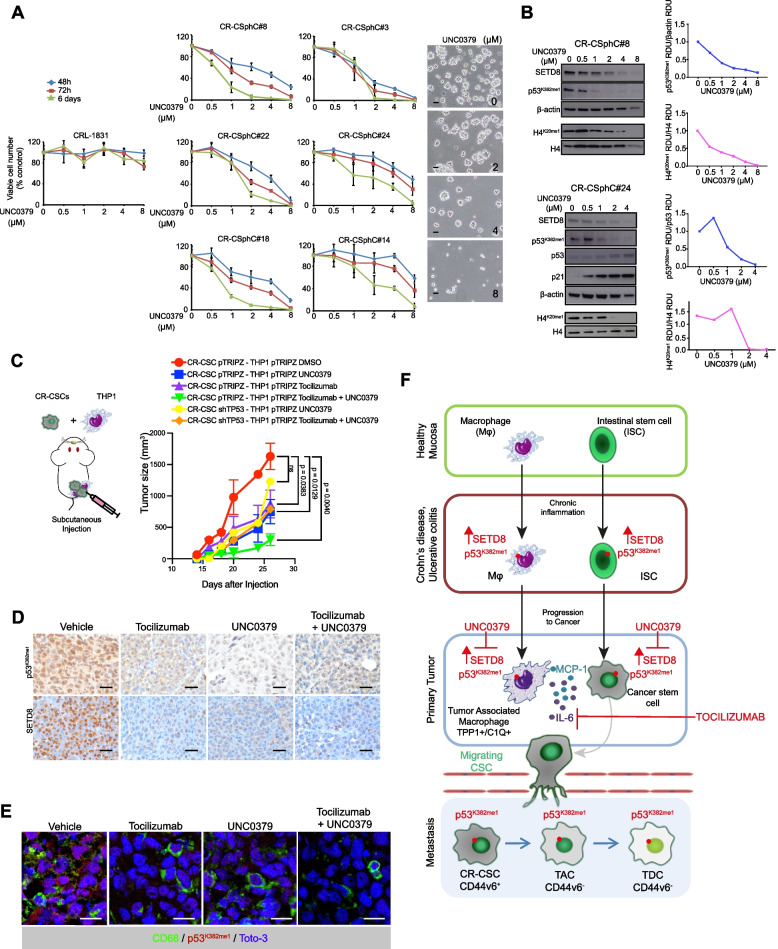
Results: By integrating bulk RNAseq and scRNAseq approaches in CRC patients, SETD8-mediated p53 regulation resulted the most significantly enriched pathway. p53K382me1 expression was confined to colorectal cancer stem cells (CR-CSCs) and C1Q+ TPP1+ tumor-associated macrophages (TAMs) in CRC patient tissues, with high levels predicting decreased survival probability. TAMs promote p53 functional inactivation in CR-CSCs through IL-6 and MCP-1 secretion and increased levels of CEBPD, which directly binds SETD8 promoter thus enhancing its transcription. The direct binding of C1Q present on macrophages and C1Q receptor (C1QR) present on cancer stem cells mediates the cross-talk between the two cell compartments. As monotherapy, SETD8 genetic and pharmacological (UNC0379) inhibition affects the tumor growth and metastasis formation in CRC mouse avatars, with enhanced effects observed when combined with IL-6 receptor targeting.

Conclusions: These findings suggest that p53K382me1 may be an early step in tumor initiation, especially in inflammation-induced CRC, and could serve as a functional biomarker and therapeutic target in adjuvant setting for advanced CRCs.

Keywords: C1Q+ TPP1+ macrophages; CRC; Cancer stem cells; IBD; P53K382me1; SETD8.


Conflict of interest statement

Declarations. Ethics approval and consent to participate: CRC human tissues were harvested in accordance with the ethical standards of the Institutional Committee on Human Experimentation (authorization CE9/2015, Policlinico Paolo Giaccone, Palermo), with informed consent from the patients. All animal experiments and procedures were approved and performed in accordance with the guidelines of the institutional animal care committee at the University of Palermo (authorization # n. 154/2017-PR, Italian Ministry of Health). Consent for publication: All the authors provided consent for the publication of the manuscript in the journal Molecular Cancer. Competing interests: The authors declare no competing interests.

Figures

Fig. 1
Fig. 1
SETD8 is highly expressed in CRC cells and p53K382me1 is an independent prognostic factor associated with poor prognosis in CRC patients. A Flow chart of the methodological approach to select chromatin modifying enzymes with positive fold change and p-value < 0.05 overexpressed in tumors derived from CRC patients compared with healthy subjects (TCGA dataset) and enriched in CRC cells compared to normal enterocytes (scRNA-seq data from GEO, GSE 200997). The top 15 significantly enriched pathways were obtained by Enrichment Pathway Analysis based on the Reactome Gene set (Molecular Signature Database, MSigDB), utilizing msigdbR library and p < 0.05. Pathways related to p53 signaling are among the top significantly enriched pathways. Venn Diagram showing the common genes enriched in the top 5 p53-related pathways. B Relapse-free survival (RFS) analysis of TP53 expression in CRC patients from R2 database (Tumor colon, Marisa dataset). Statistical significance was calculated using the log-rank test. C TCGA analysis of KMT5A (SETD8) relative mRNA expression levels in normal and tumor tissue derived from CRC patients (COAD dataset). D Immunohistochemical analysis of SETD8 and p53K382me1 on healthy colon mucosa of a healthy subject and on tumor tissue of a p53WT CRC patient. Scale bars, 40 µm. E Immunoblot analysis of the indicated total and histone proteins in SY5Y NB cells, HCT116 and LOVO colon cancer cells, and 11 CR-CSphCs (left panel). Densitometry analysis of p53K382me1 protein levels compared with p53 total protein levels measured as relative density units (RDU) (right panel). F Immunoblot analysis of the indicated proteins in CRL-1790 and CRL-1831 healthy colon cells, in HCT116 colon cancer cells and in CR-CSphC#8. β-actin was used as loading control. G Immunofluorescence analysis of p53K382me1 and CD44v6 in tumor tissue derived from a p53WT CRC patient. Nuclei were counterstained by Toto-3. Scale bars, 40 µm. H Immunohistochemical analysis of CD44v6 and immunofluorescence analysis of p53K382me1 and SETD8 on tumor tissue of two CRC TMAs representative of high staining intensity (#1) or lack of staining (#2), respectively. Nuclei were counterstained by Toto-3. Scale bars, 40 µm. I Immunofluorescence analysis of p53K382me1 in CRC TMA patients in tumor tissue (T) or in the immune cell infiltration (I). Four different conditions are indicated (Tum + /Inf-, Tum + /Inf + , Tum-/Inf-, Tum-/Inf +). Nuclei were counterstained by Toto-3. Scale bars, 40 µm. J Probability of survival in CRC TMA patients based on the p53K382me1 expression in tumor tissue (Tum ±) and/or in the immune cell infiltration (Inf ±). K Disease-free survival probability in CRC patients based on p53K382me1 expression in tumor tissue or in the immune cell infiltration. See also Tables S1, Table S2, Table S3 and Figure S1
Fig. 2
Fig. 2
p53K382me1 expression is specifically enriched in CD68+ macrophages present in IBD and CRC patients. A Immunofluorescence analysis of p53K382me1 and CD68 in tumor tissue derived from a p53WT CRC patient. Nuclei were counterstained by Toto-3. Scale bars, 40 µm. B p53K382me1 positivity percentage of CD68+ (macrophages), CD163+ (TAMs), CD8+ (lymphocytes), CD4+ (lymphocytes), CD15+ (B cells) and CD20+ (neutrophils) immune cells in tumor tissues derived from p53WT CRC patients. Data represent mean ± SD of three independent experiments. ns, not significant. C Analysis of KMT5A (SETD8) and CD68 relative mRNA expression levels in normal and inflamed tissues derived from IBD patients in E-MTAB-184 array express dataset. D Immunofluorescence analysis of p53K382me1 and CD68 in inflamed and peri-inflamed tissues derived from patients affected by Crohn’s disease (CD) and Ulcerative colitis (UC). Nuclei were counterstained by Toto-3. Scale bars, 40 µm. E p53K382me1 positivity percentage of total cell population (upper panel) and CD68+ macrophages (lower panel) in IBD patients as in (D). Data are expressed as mean ± SD of three independent experiments. F Immunohistochemical analysis of p53K382me1 on peri-inflamed tissue of a Crohn’s disease (CD) patient as measured by Image J software. Scale bars, 40 µm (left panels). Scheme showing the basal, transit-amplifying cells (TAC) and apical compartments of a colon crypt (right upper panel). p53K382me1 positivity percentage of epithelial cells in the indicated colon crypt compartments as shown in the left panels. Data are expressed as mean ± SD of three independent experiments. ns, not significant (right lower panel). G Scheme showing the generation of three conditioned media (CM) and its administration on healthy colon cells, CR-CSphCs and macrophages. Immunoblot analysis showing the expression of the indicated proteins in healthy colon cells, CR-CSphCs#14 and THP1 treated with three CM for 72 h. H Heatmap of the p53 pathway-related genes (2−ΔCt expression values) in healthy colon cells and CR-CSphCs#14 treated with CM3 for 48 h. Data are presented as normalized mRNA expression values of 2 biological replicates. The color key represents the normalized expression values: blue (low) to red (high). I The top 15 differentially expressed canonical pathways in CR-CSphCs#14 treated as in (H) obtained by Enrichment Pathway Analysis based on the Reactome Gene set (Molecular Signature Database, MSigDB), utilizing msigdbR library and p < 0.05. Pathways related to p53 signaling are among the top differentially expressed pathways. J Lollipop plot representing the number of cytokines released by CR-CSphCs#8 and THP1 cells (CM3) compared with CM1 as measured by Luminex Bio-plex assay. Data are expressed as LogFC values of 2 biological replicates. K Analysis of IL-6 and CCL2 (MCP-1) relative mRNA expression levels in normal and tumor tissues derived from CRC patients in TNM plot dataset. See also Figure S2
Fig. 3
Fig. 3
Direct interaction between macrophages and CR-CSphCs inhibits p53 transcriptional activity and induces an inflammatory response in CR-CSphCs. A Immunoblot analysis showing the expression of the indicated proteins in healthy colon cells and CR-CSphCs (#22 and #14) treated with IL-6 and MCP-1 alone and in combination for 72 h. B Heatmap showing the top 189 differentially expressed genes (DEGs) with Log2FC ≥ 1.5 and p < 0.05 obtained by total transcriptome analysis (RNAseq), in CR-CSphCs#14 treated with CM3 for 48 hr. Data are presented as normalized expression values of 2 biological replicates based on edgeR library analysis. The color key represents the normalized expression values: blue (low) to red (high). C The top six differentially expressed canonical pathways in CR-CSphCs#14 treated as in (B) defined by Hallmark Gene set based on fgsea library analysis and p < 0.05. GSEA (Gene Set Enrichment Analysis) showing the enrichment in TNF alpha signaling via NFKB, EMT and IFN alpha response. D Dot plot for the enrichment of p53 signaling pathway-associated genes in CR-CSphCs#14 treated as in (B). The color represents p-value and the size indicates the number of genes significantly enriched in the indicated p53 signaling pathways. GeneRatio is calculated as number of enriched genes vs total genes. E, F P53-related genes differentially regulated in CR-CSphCs#14 treated as in (B). Data are presented as Log2FC values of 2 biological replicates. GSEA (Gene Set Enrichment Analysis) showing the reduced enrichment in p53 activity by phosphorylation and p53 transcription of DNA repair genes. G ChIP-qPCR for C/EBPδ at the KMT5A (SETD8) promoter in THP1 cells untreated and treated with IL-6 for 90 minutes. Data are presented as Fold enrichment of C/EBPδ at the KMT5A (SETD8) promoter over IgG control. Data are representative of three independent experiments. Statistical analysis was estimated by two-way ANOVA test. ns, not significant. H Schematic model of the proposed mechanism showing the cross-talk between colorectal cancer stem cells (CR-CSCs) and tumor-associated macrophages (TAMs M2). IL-6, secreted by immune cells in the tumor microenvironment, prompts macrophages to secrete MCP-1, which recruits TAMs and facilitates the production of IL-6 by CR-CSCs.  In both CR-CSCs and TAMs, an altered IL-6/IL-6R and MCP-1/CCR2 signaling lead to the activation of C/EBPδ, a transcription factor, which directly binds SETD8 promoter resulting in increased SETD8 expression and p53 inactivation through K382 methylation (p53K382me1). In CR-CSCs, p53 inhibition enhances stemness and tumorigenic capabilities. See also Figure S3
Fig. 4
Fig. 4
scRNA-seq data analysis reveals high expression levels of SETD8 in CR-CSCs and Paneth cells. A, B UMAP visualization of major populations in normal colon mucosa (A) and tumor tissue of CRC patients (B). C UMAP visualization of the epithelial compartment in CRC (Bulk tumor cells=Tumor cells 1; Cancer stem cells=Tumor cells 2). D Trajectory analysis of the epithelial compartment in CRC. Black circles indicate the start or end point of the trajectory. The red arrow indicates normal stem cells. The red circle indicates metaplastic or inflammatory Paneth cells. The blue circle indicates Cancer stem cells. E UMAP visualization of the epithelial compartment in CRC colored by KMT5A (SETD8) expression. F Dot plot for the expression of KMT5A (SETD8) and TP53 genes in all the subpopulations of the epithelial compartment in CRC. The color represents the scaled average expression of KMT5A and TP53 genes in each cell type, and the size indicates the proportion of cells expressing KMT5A and TP53 genes. G Expression of MYC, CDKN1A and HDAC2 as a function of pseudotime in the epithelial compartment in CRC, with cells colored according to the corresponding cell type. See also Figure S4
Fig. 5
Fig. 5
scRNA-seq data analysis identifies C1Q+ TPP1+ macrophages as TAM M2 with an altered p53 signaling in CRC. A UMAP visualization of macrophage subpopulations in normal colon mucosa and tumor tissue of CRC patients. B Trajectory analysis of macrophage subpopulations in CRC. FCN1 trajectory and C1Q trajectory show opposite directions. C, D and E Dot plot for the expression of CD163, KMT5A (SETD8), TP53, CDKN1A, IL6 and CCL2 (MCP-1) genes in the indicated macrophage subpopulations in CRC. The color represents the scaled average expression of the indicated genes in each cell type, and the size represents the proportion of cells expressing the indicated genes. F Dot plot for the enrichment of the indicated signaling pathway-associated genes expressed as normalized enrichment score (NES), in C1Q+ TPP1+ macrophages in CRC tissue vs normal mucosa. The color represents p-value and the size indicates the number of genes significantly enriched in the indicated pathways. P53 pathway is among the top down-regulated pathways. G Immunofluorescence analysis of TPP1, C1Q, FCN1 and p53K382me1 in tumor tissue derived from a p53WT CRC patient. The yellow square indicates the inset shown on the right. Scale bars, 20 µm (left panels). p53K382me1 positivity percentage of TPP1+/C1Q+ and FCN1+ macrophages, in the indicated compartments of tumor tissue derived from a p53WT CRC patient as shown in left panels. Data are expressed as mean ± SD of three independent experiments. ns, not significant (right panels). (H, I) Dot plot for the enrichment of the indicated signaling pathway-associated genes expressed as normalized enrichment score (NES), in C1Q+ TPP1 macrophages (H) and in FCN1+ macrophages (I) in CRC tissue vs normal mucosa. The color represents p-value and the size indicates the number of genes significantly enriched in the indicated pathways. See also Figure S5 and Table S5, Table S6
Fig. 6
Fig. 6
In IBD and CRC patients with CMS4, SETD8 is correlated with poor prognosis and p53 is methylated on lysine 382 in C1Q+TPP1+ macrophages. A Immunohistochemical analysis of p53 DO7 and p53K382me1 on colon mucosa of a Crohn’s disease (CD) patient and an Ulcerative colitis (UC) patient at diagnosis and CRC progression. Scale bars, 40 µm. B Immunofluorescence analysis of TPP1, C1Q and p53K382me1 on colon mucosa of a Crohn’s disease (CD) patient at diagnosis and at CRC progression. Scale bars, 20 µm (left panels). p53K382me1 positivity percentage of TPP1+/C1Q+macrophages in colon mucosa of a Crohn’s disease (CD) patient at diagnosis and at CRC progression as shown in left panels. Data are expressed as mean ± SD of three independent experiments (right panel). C Relapse-free survival (RFS) analysis of CD68 and CD163 expression in CRC patients from R2 database (Guinney dataset). Statistical significance was calculated using the log-rank test. D Immunohistochemical analysis of p53K382me1 , CD68 and CD163 on tumor tissue derived from a p53WT CRC patient with consensus molecular subtype 4 (CMS4). Scale bars, 40 µm. (E, F) p53K382me1 positivity percentage of CD68+ macrophages (E) or CD163+ macrophages (F) in peritumoral, intratumoral tissues and invasive front derived from a p53WT CRC patient with CMS4 as shown in (D). G Immunofluorescence analysis of TPP1, C1Q and p53K382me1 on tumor tissue derived from a p53WT CRC patient with CMS4. Scale bars, 20 µm. H Immunofluorescence analysis of C1QR, CK20 and C1Q in CR-CSphC#8 and THP1 cells. Scale bars, 20 µm. I, J Relapse-free survival (RFS) analysis of C1Q and C1QR expression in CRC patients from R2 database (Guinney dataset). Statistical significance was calculated using the log-rank test. See also Figure S6
Fig. 7
Fig. 7
SETD8 genetic inhibition in CSCs and macrophages impairs tumor growth, metastasis formation and prolongs murine survival in in vivo models of CRC. A, B In vivo whole-body imaging analysis (A) and kinetics of tumor formation (B) detected by in vivo imaging analysis at the indicated time following orthotopic injection of CR-CSphC#8 stably transduced with doxycycline (DOXY)-inducible vectors pTRIPZ and shSETD8. Time −2 weeks indicates the day of cell implantation. After 2 weeks, DOXY was added to both groups of mice (pTRIPZ and shSETD8). Bars show the tumor size average of 6 mice/group ± SEM. Slopes of the growth rate were compared by Mann–Whitney test. C Immunohistochemical analysis of SETD8, p53K382me1 and CK20 on 2 tumors randomly chosen from each group divided as in (B) collected 4 weeks after the injection and 2 weeks after doxy treatment. Scale bars, 40 µm. D Xenograft tumor size in mice subcutaneously co-injected with CR-CSphC#8 and THP1 cells. CR-CSphC#8 and THP1 cells were both stably transduced with doxycycline (DOXY)-inducible vectors pTRIPZ and shSETD8 alone or in combination with shTP53. Day 0 indicates the day of cell implantation. Doxycycline (DOXY) was added after tumors reached 75-100 mm3, 12 days after the injection. Bars show the tumor size average of 6 mice/group ± SEM. Slopes of the growth rate were compared by t-test. E Immunohistochemical analysis of CK20 and CD68 on a tumor generated from the subcutaneous co-injection of CR-CSphC#8 and THP1 cells stably transduced with doxycycline (DOXY)-inducible vector pTRIPZ. Scale bars, 40 µm. F Kaplan-Meier graphs showing the murine survival upon SETD8 silencing alone or in combination with shTP53 in mice treated as in (D). The statistical significance between two treatment groups was evaluated using a log rank test. G Kinetics of metastasis formation detected by in vivo imaging analysis at the indicated time following spleen injection of CR-CSphC#8 stably transduced with doxycycline (DOXY)-inducible vectors pTRIPZ and shSETD8. Data are expressed as mean ± SD of 6 mice analyzed. Slopes of the growth rate were compared by t-test. H In vivo whole-body imaging analysis of mice treated as in (G) and analyzed at the indicated time points after splenectomy. I Photons count of all metastatic sites (intestine, lung and liver) in mice following spleen injection of CR-CSphC#8 and THP1 cells both stably transduced with doxycycline (DOXY)-inducible vectors pTRIPZ and shSETD8. Data are expressed as mean ± SD of 6 mice analyzed. The statistical significance between the treatment groups was evaluated using a t-test (upper panel). Representative in vivo imaging analysis of metastatic foci in the intestine, lung and liver of mice treated as indicated (lower panels). See also Figures S6 and S7
Fig. 8
Fig. 8
UNC0379, SETD8 inhibitor, impairs CSC proliferation reducing p53K382me1 levels and enhances the anti-tumor effects of Tocilizumab in in vivo CRC models. A Cell viability percentage of CRL-1831 and CR-CSphCs#8, #3, #22, #24, #18 and #14 treated with SETD8 inhibitor, UNC0379, at the indicated time and concentrations. Data are presented as percentage of cell number over control ± SD of three independent experiments. Images showing CR-CSC#8 treated with UNC0379 at the indicated concentrations for 72 h. Scale bars, 20 μm (right panels). B Immunoblot analysis of the indicated proteins in CR-CSphCs#8 and #24 treated with UNC0379 at the indicated concentrations. Densitometric analysis of p53K382me1 levels normalized to p53 protein levels and of H4K20me1 levels normalized to H4 protein levels upon UNC0379 treatment for 48 hr calculated as RDU using ImageJ software. C Xenograft tumor size in mice subcutaneously co-injected with THP1 cells and CR-CSphC#8 transduced with control vector (pTRIPZ) or with shTP53, upon treatment with UNC0379 or Tocilizumab alone or in combination. Day 0 indicates the day of cell implantation. Treatment was added after tumors reached 75-100 mm3, 12 days after the injection. Bars show the tumor size average of 6 mice/group ± SEM. Slopes of the growth rate were compared by t-test. D Immunohistochemical analysis of SETD8 and p53K382me1 on tumors generated from the subcutaneous co-injection of CR-CSphC#8 and THP1 cells treated with UNC0379 or Tocilizumab alone or in combination. Scale bars, 40 µm. E Immunofluorescence analysis of CD68 and p53K382me1 on tumors generated from the subcutaneous co-injection of CR-CSphC#8 and THP1 cells treated as in (C). Nuclei were counterstained by Toto-3. Scale bars, 20 µm. F Model of p53K382me1expression during chronic inflammation and CRC progression. Upon chronic inflammatory stimuli, p53 is inactivated in both macrophages and intestinal stem cells by methylation on lysine 382 (p53K382me1) mediated by SETD8. During progression to CRC, tumor-promoting macrophages TAM M2 expressing C1Q/TPP1 can activate CR-CSC functions by an altered cytokine secretion, particularly IL-6 and MCP-1, contributing to the elevated levels of SETD8 and p53 inactivation by p53K382me1. Finally, the migrating CSCs CD44v6+ can invade the metastatic site and repopulate a lineage of progenitors (TAC) and differentiated cells (TDC) with an inactive p53. A combinatorial treatment of SETD8 inhibitor (UNC0379) and IL-6R inhibitor (Tocilizumab) may impair tumor growth by counteracting SETD8/p53K382me1 axis and IL-6 signaling in both CR-CSphCs and TAM M2 (Mj: macrophage; ISC: intestinal stem cell; TAM: tumor-associated macrophage; CR-CSC: colorectal cancer stem cell; TAC: transit amplified cell; TDC: tumor differentiated cell). See also Figures S7 and S8

References

    1. Siegel RL, Miller KD, Fedewa SA, Ahnen DJ, Meester RGS, Barzi A, Jemal A. Colorectal cancer statistics, 2017. CA Cancer J Clin. 2017;67:177–93. - PubMed
    1. Hollstein M, Sidransky D, Vogelstein B, Harris CC. p53 mutations in human cancers. Science. 1991;253:49–53. - PubMed
    1. Cooks T, Pateras IS, Tarcic O, Solomon H, Schetter AJ, Wilder S, Lozano G, Pikarsky E, Forshew T, Rosenfeld N, et al. Mutant p53 prolongs NF-kappaB activation and promotes chronic inflammation and inflammation-associated colorectal cancer. Cancer Cell. 2013;23:634–46. - PMC - PubMed
    1. Lu M, Breyssens H, Salter V, Zhong S, Hu Y, Baer C, Ratnayaka I, Sullivan A, Brown NR, Endicott J, et al. Restoring p53 Function in Human Melanoma Cells by Inhibiting MDM2 and Cyclin B1/CDK1-Phosphorylated Nuclear iASPP. Cancer Cell. 2016;30:822–3. - PubMed
    1. Veschi V, Liu Z, Voss TC, Ozbun L, Gryder B, Yan C, Hu Y, Ma A, Jin J, Mazur SJ, et al. Epigenetic siRNA and Chemical Screens Identify SETD8 Inhibition as a Therapeutic Strategy for p53 Activation in High-Risk Neuroblastoma. Cancer Cell. 2017;31:50–63. - PMC - PubMed

MeSH terms

LinkOut - more resources