. 2025 Mar 31:37028251325553.
doi: 10.1177/00037028251325553. Online ahead of print.

Quantification of Protein Secondary Structures from Discrete Frequency Infrared Images Using Machine Learning

Affiliations

Quantification of Protein Secondary Structures from Discrete Frequency Infrared Images Using Machine Learning

Harrison Edmonds et al. Appl Spectrosc. .

Abstract

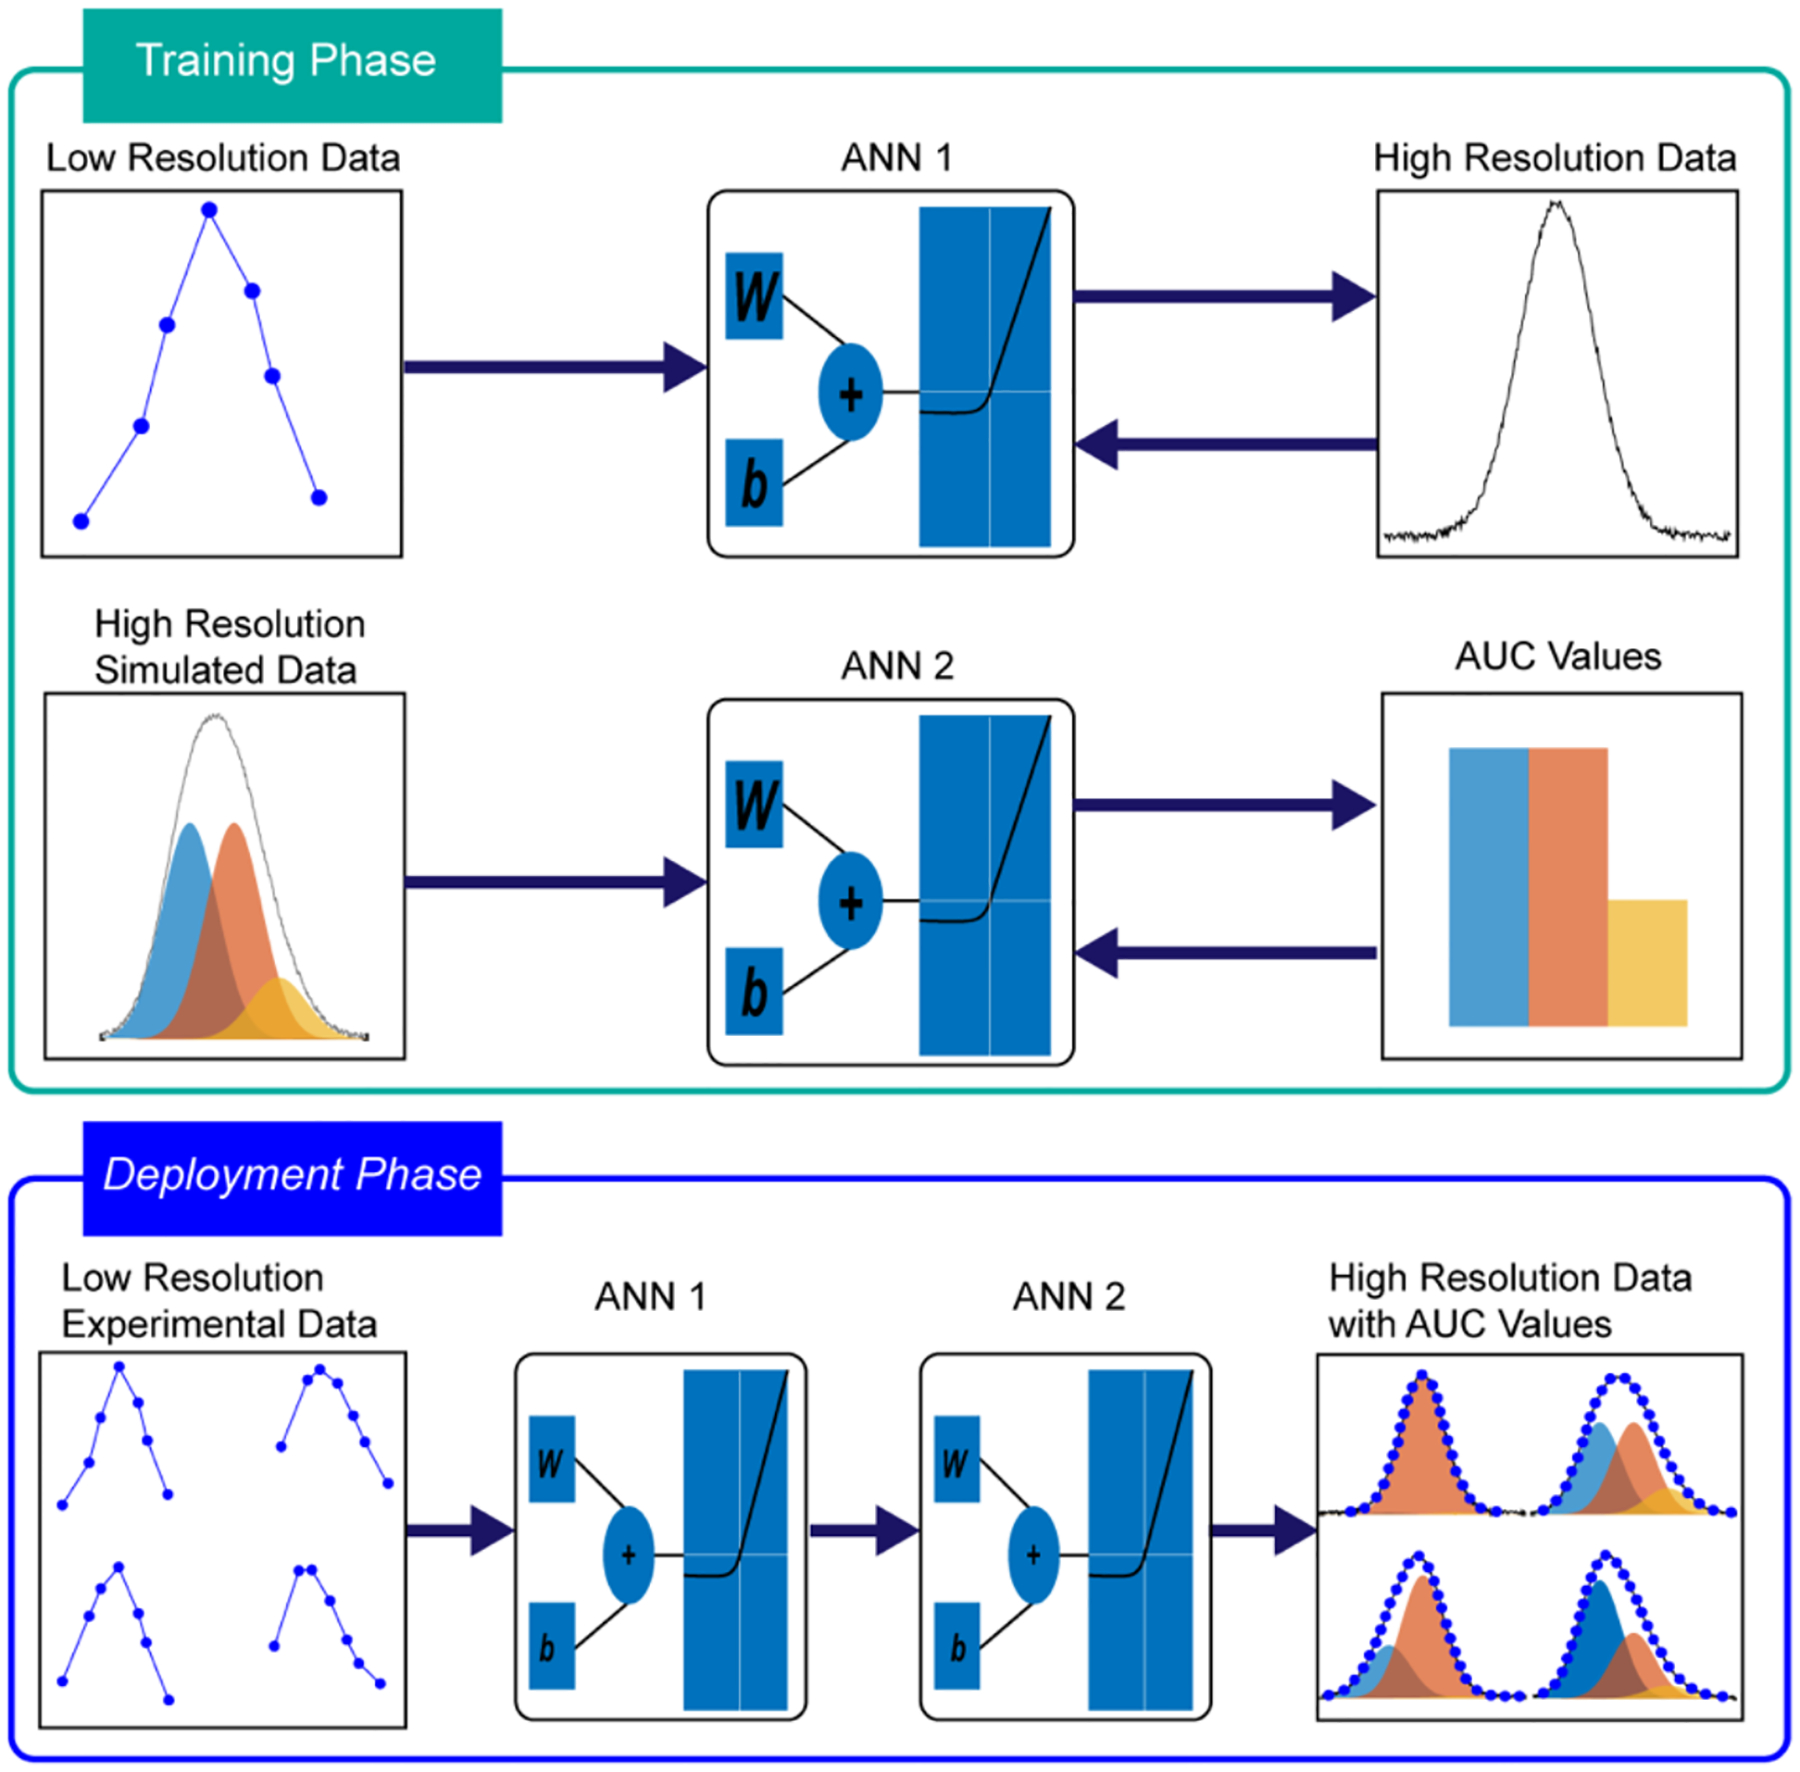
Discrete frequency infrared (IR) imaging is an exciting experimental technique that has shown promise in various applications in biomedical science. This technique often involves acquiring IR absorptive images at specific frequencies of interest that enable pathologically relevant chemical contrast. However, certain applications, such as tracking the spatial variations in protein secondary structure of tissue specimens, necessary for the characterization of neurodegenerative diseases, require deeper analysis of spectral data. In such cases, the conventional analytical approach involves band fitting the hyperspectral data to extract the relative populations of different structures through their fitted areas under the curve (AUC). While Gaussian spectral fitting for one spectrum is viable, expanding that to an image with millions of pixels, as often applicable for tissue specimens, becomes a computationally expensive process. Alternatives like principal component analysis (PCA) are less structurally interpretable and incompatible with sparsely sampled data. Furthermore, this detracts from the key advantages of discrete frequency imaging by necessitating the acquisition of more finely sampled spectral data that is optimal for curve fitting, resulting in significantly longer data acquisition times, larger datasets, and additional computational overhead. In this work, we demonstrate that a simple two-step regressive neural network model can be utilized to mitigate these challenges and employ discrete frequency imaging for retrieving the results from band fitting without significant loss of fidelity. Our model reduces the data acquisition time nearly six-fold by requiring only seven wavenumbers to accurately interpolate spectral information at a higher resolution and subsequently using the upscaled spectra to accurately predict the component AUCs, which is more than 3000 times faster than spectral fitting. Our approach thus drastically cuts down the data acquisition and analysis time and predicts key differences in protein structure that can be vital towards broadening potential applications of discrete frequency imaging.

Keywords: Discrete frequency infrared imaging; infrared spectroscopy; machine learning; protein secondary structure; spectral deconvolution‌.


Figures

Figure 1:
Figure 1:
Schematic representation of the method presented in this paper. AUC: Area Under Curve (AUC1: Blue, AUC2: Orange, AUC3: Yellow), ANN 1: Artificial Neural Network responsible for up-scaling of spectroscopic data, ANN 2: Artificial Neural Network responsible for estimating the deconvolution of said upscaled spectroscopic data.
Figure 2:
Figure 2:
(a) Various example spectra from the test dataset and their corresponding predicted spectral output, (b) optical IHC stained Aβ plaque, (c) intensity image collected at 1628 cm−1 of the plaque corresponding plaque with the approximate position estimated by the white dashed circle, (d) the same intensity image predicted by model output.
Figure 3:
Figure 3:
Scatter plots of Actual vs Predicted AUC values corresponding to the test dataset split.
Figure 4:
Figure 4:
(a, d) Optical IHC stained images of Aβ plaques with the plaque identified by the black dashed circle, (b, e) deconvoluted AUC1 images from collected hyperspectral data, and (c, f) reconstructed AUC1 images from network predictions with the approximate position of the plaque estimated by the white dashed circle.
Figure 5:
Figure 5:
(a) Network predicted AUC1 image from collected hyperspectral data of a frontal lobe Alzheimer’s tissue section, and a smaller cropped region of interest denoted by the dashed white box where the AUC1 was predicted using Gaussian fitting (b), and our pre-trained model (c).
Figure 6:
Figure 6:
Comparison of trends for Relative MAE in AUC prediction vs signal-noise-ratio for both Gaussian fitting and the model.

Similar articles

  • Prescription of Controlled Substances: Benefits and Risks.
    Preuss CV, Kalava A, King KC. Preuss CV, et al. 2025 Jul 6. In: StatPearls [Internet]. Treasure Island (FL): StatPearls Publishing; 2025 Jan–. 2025 Jul 6. In: StatPearls [Internet]. Treasure Island (FL): StatPearls Publishing; 2025 Jan–. PMID: 30726003 Free Books & Documents.
  • Short-Term Memory Impairment.
    Cascella M, Al Khalili Y. Cascella M, et al. 2024 Jun 8. In: StatPearls [Internet]. Treasure Island (FL): StatPearls Publishing; 2025 Jan–. 2024 Jun 8. In: StatPearls [Internet]. Treasure Island (FL): StatPearls Publishing; 2025 Jan–. PMID: 31424720 Free Books & Documents.
  • Electrophoresis.
    Sonagra AD, Zubair M, Dholariya SJ. Sonagra AD, et al. 2025 Jul 14. In: StatPearls [Internet]. Treasure Island (FL): StatPearls Publishing; 2025 Jan–. 2025 Jul 14. In: StatPearls [Internet]. Treasure Island (FL): StatPearls Publishing; 2025 Jan–. PMID: 36251838 Free Books & Documents.
  • Management of urinary stones by experts in stone disease (ESD 2025).
    Papatsoris A, Geavlete B, Radavoi GD, Alameedee M, Almusafer M, Ather MH, Budia A, Cumpanas AA, Kiremi MC, Dellis A, Elhowairis M, Galán-Llopis JA, Geavlete P, Guimerà Garcia J, Isern B, Jinga V, Lopez JM, Mainez JA, Mitsogiannis I, Mora Christian J, Moussa M, Multescu R, Oguz Acar Y, Petkova K, Piñero A, Popov E, Ramos Cebrian M, Rascu S, Siener R, Sountoulides P, Stamatelou K, Syed J, Trinchieri A. Papatsoris A, et al. Arch Ital Urol Androl. 2025 Jun 30;97(2):14085. doi: 10.4081/aiua.2025.14085. Epub 2025 Jun 30. Arch Ital Urol Androl. 2025. PMID: 40583613 Review.
  • Systemic pharmacological treatments for chronic plaque psoriasis: a network meta-analysis.
    Sbidian E, Chaimani A, Garcia-Doval I, Doney L, Dressler C, Hua C, Hughes C, Naldi L, Afach S, Le Cleach L. Sbidian E, et al. Cochrane Database Syst Rev. 2021 Apr 19;4(4):CD011535. doi: 10.1002/14651858.CD011535.pub4. Cochrane Database Syst Rev. 2021. Update in: Cochrane Database Syst Rev. 2022 May 23;5:CD011535. doi: 10.1002/14651858.CD011535.pub5. PMID: 33871055 Free PMC article. Updated.

References

    1. Bhargava R Digital Histopathology by Infrared Spectroscopic Imaging. Annu. Rev. Anal. Chem. (Palo Alto Calif.) 2023, 16 (1), 205–230. DOI: 10.1146/annurev-anchem-101422-090956 - DOI - PMC - PubMed
    1. Pilling MJ; Henderson A; Gardner P Quantum Cascade Laser Spectral Histopathology: Breast Cancer Diagnostics Using High Throughput Chemical Imaging. Anal. Chem 2017, 89 (14), 7348–7355. DOI: 10.1021/acs.analchem.7b00426 - DOI - PubMed
    1. Mukherjee SS; Bhargava R Phasor Representation Approach for Rapid Exploratory Analysis of Large Infrared Spectroscopic Imaging Data Sets. Anal. Chem 2023, 95 (30), 11365–11374. DOI: 10.1021/acs.analchem.3c01539 - DOI - PMC - PubMed
    1. Baker MJ; Trevisan J; Bassan P; Bhargava R, et al. Using Fourier Transform Ir Spectroscopy to Analyze Biological Materials. Nat. Protoc 2014, 9 (8), 1771–1791. DOI: 10.1038/nprot.2014.110 - DOI - PMC - PubMed
    1. Perl DP Neuropathology of Alzheimer’s Disease. Mt. Sinai. J. Med 2010, 77 (1), 32–42. DOI: 10.1002/msj.20157 - DOI - PMC - PubMed

LinkOut - more resources