

A combined radiomics and clinical model for preoperative differentiation of intrahepatic cholangiocarcinoma and intrahepatic bile duct stones with cholangitis: a machine learning approach
- PMID: 40165897
- PMCID: PMC11955465
- DOI: 10.3389/fonc.2025.1546940
A combined radiomics and clinical model for preoperative differentiation of intrahepatic cholangiocarcinoma and intrahepatic bile duct stones with cholangitis: a machine learning approach
Abstract
Background: This study aimed to develop and validate a predictive model integrating radiomics features and clinical variables to differentiate intrahepatic bile duct stones with cholangitis (IBDS-IL) from intrahepatic cholangiocarcinoma (ICC) preoperatively, as accurate distinction is crucial for determining appropriate treatment strategies.
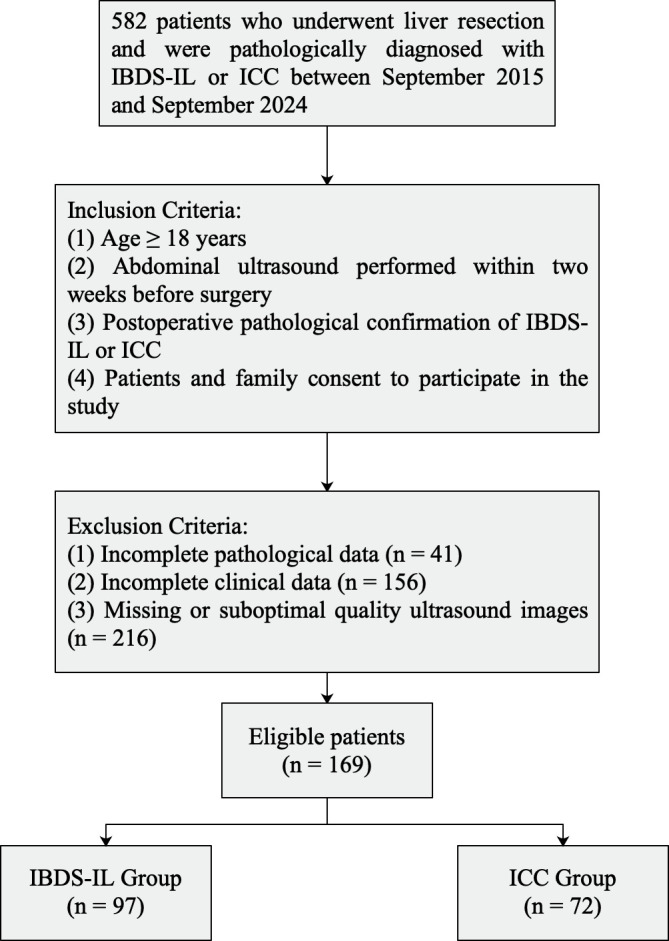
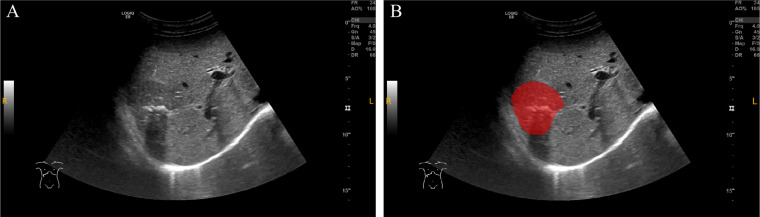
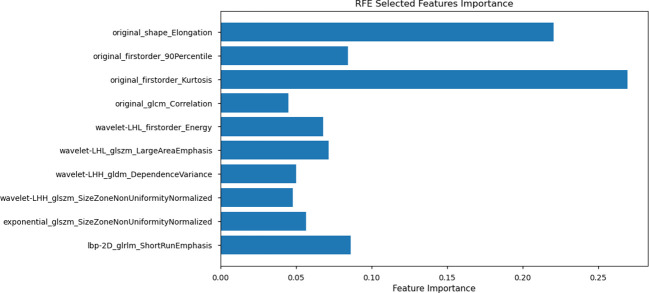
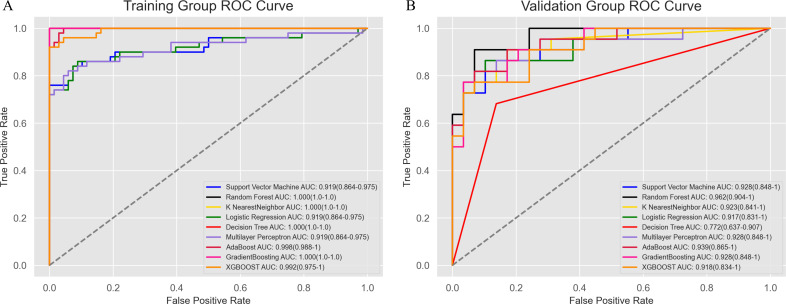
Methods: A total of 169 patients (97 IBDS-IL and 72 ICC) who underwent surgical resection were retrospectively analyzed. Radiomics features were extracted from ultrasound images, and clinical variables with significant differences between groups were identified. Feature selection was performed using LASSO regression and recursive feature elimination (RFE). The radiomics model, clinical model, and combined model were constructed and evaluated using the area under the curve (AUC), calibration curves, decision curve analysis (DCA), and SHAP analysis.
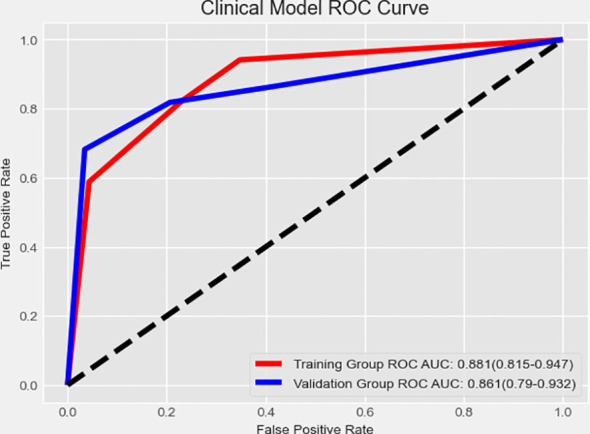
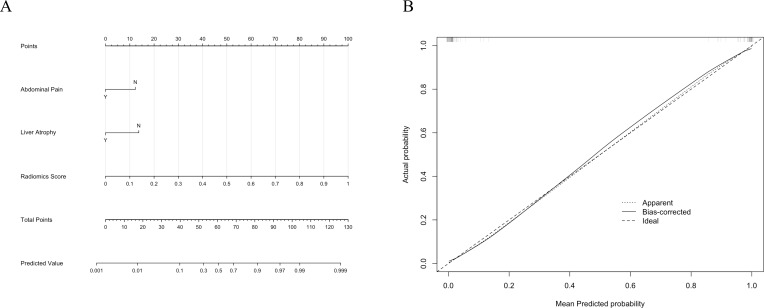
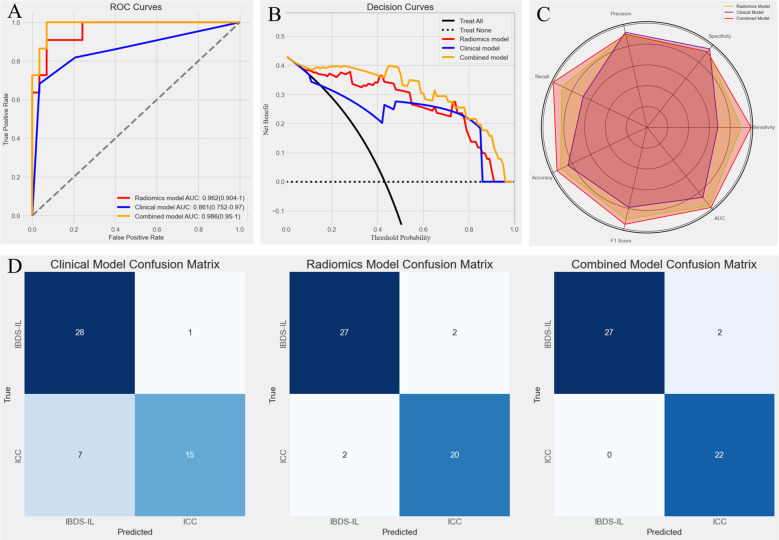
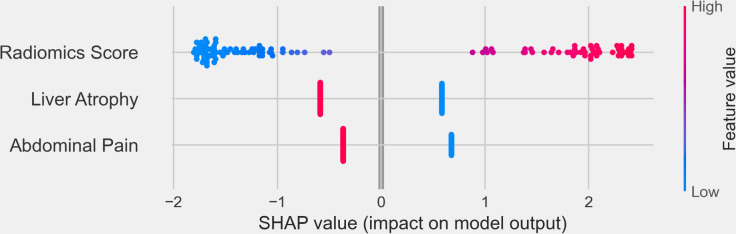
Results: The radiomics model achieved an AUC of 0.962, and the clinical model achieved an AUC of 0.861. The combined model, integrating the Radiomics Score with clinical variables, demonstrated the highest predictive performance with an AUC of 0.988, significantly outperforming the clinical model (p < 0.05). Calibration curves showed excellent agreement between predicted and observed outcomes, and the Hosmer-Lemeshow test confirmed a good model fit (p = 0.998). DCA revealed that the combined model provided the greatest clinical benefit across a wide range of threshold probabilities. SHAP analysis identified the Radiomics Score as the most significant contributor, complemented by abdominal pain and liver atrophy.
Conclusion: The combined model integrating radiomics features and clinical data offers a powerful and reliable tool for preoperative differentiation of IBDS-IL and ICC. Its superior performance and clinical interpretability highlight its potential for improving diagnostic accuracy and guiding clinical decision-making. Further validation in larger, multicenter datasets is warranted to confirm its generalizability.
Keywords: intrahepatic bile duct stones; intrahepatic cholangiocarcinoma; intrahepatic lithiasis; nomogram; radiomics.
Copyright © 2025 Qian, Huang, Dong, Xu, Chen, Zhou, Zhou, Yu and Lu.
Conflict of interest statement
The authors declare that the research was conducted in the absence of any commercial or financial relationships that could be construed as a potential conflict of interest.
Figures
Similar articles
-
Preoperative prediction of lymph node metastasis in intrahepatic cholangiocarcinoma: an integrative approach combining ultrasound-based radiomics and inflammation-related markers.BMC Med Imaging. 2025 Jan 2;25(1):4. doi: 10.1186/s12880-024-01542-8. BMC Med Imaging. 2025. PMID: 39748308 Free PMC article.
-
A radiomic-based model of different contrast-enhanced CT phase for differentiate intrahepatic cholangiocarcinoma from inflammatory mass with hepatolithiasis.Abdom Radiol (NY). 2021 Aug;46(8):3835-3844. doi: 10.1007/s00261-021-03027-6. Epub 2021 Mar 17. Abdom Radiol (NY). 2021. PMID: 33728532
-
The diagnostic value of a nomogram based on enhanced CT radiomics for differentiating between intrahepatic cholangiocarcinoma and early hepatic abscess.Front Mol Biosci. 2024 Aug 23;11:1409060. doi: 10.3389/fmolb.2024.1409060. eCollection 2024. Front Mol Biosci. 2024. PMID: 39247207 Free PMC article.
-
Differentiation combined hepatocellular and cholangiocarcinoma from intrahepatic cholangiocarcinoma based on radiomics machine learning.Ann Transl Med. 2020 Feb;8(4):119. doi: 10.21037/atm.2020.01.126. Ann Transl Med. 2020. PMID: 32175412 Free PMC article.
-
The Application Status of Radiomics-Based Machine Learning in Intrahepatic Cholangiocarcinoma: Systematic Review and Meta-Analysis.J Med Internet Res. 2025 May 5;27:e69906. doi: 10.2196/69906. J Med Internet Res. 2025. PMID: 40323647 Free PMC article. Review.
References
LinkOut - more resources
Full Text Sources