[Preprint]. 2025 Mar 19:rs.3.rs-6141479.
doi: 10.21203/rs.3.rs-6141479/v1.

Combination immunotherapy induces post-intervention control of HIV

Affiliations

Combination immunotherapy induces post-intervention control of HIV

M J Peluso et al. Res Sq. .

Abstract

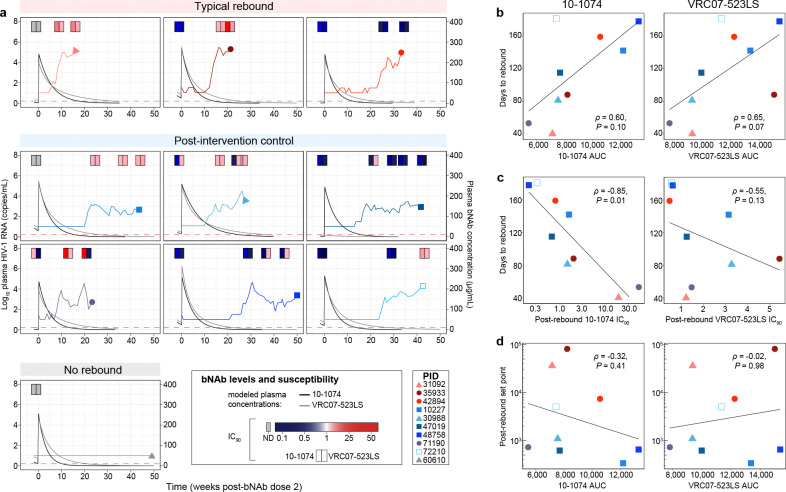
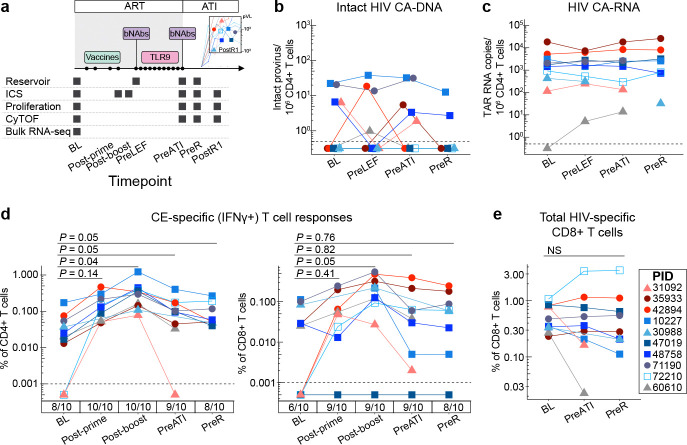
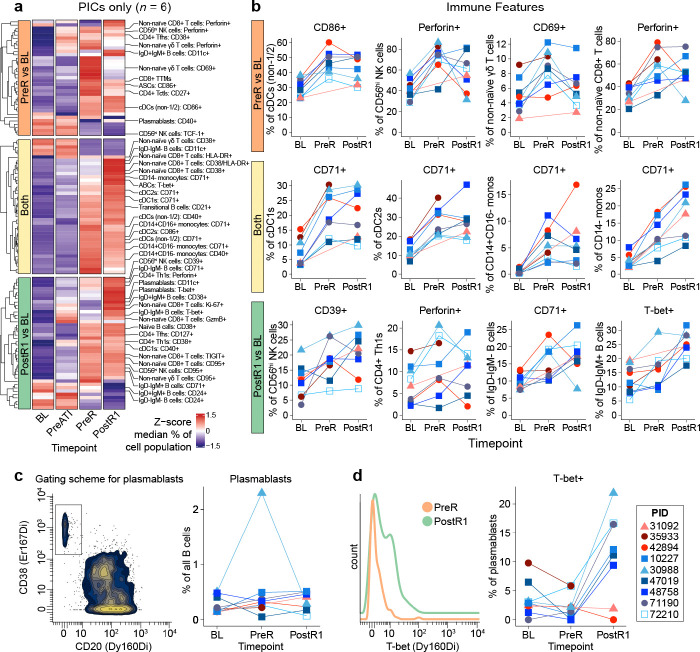
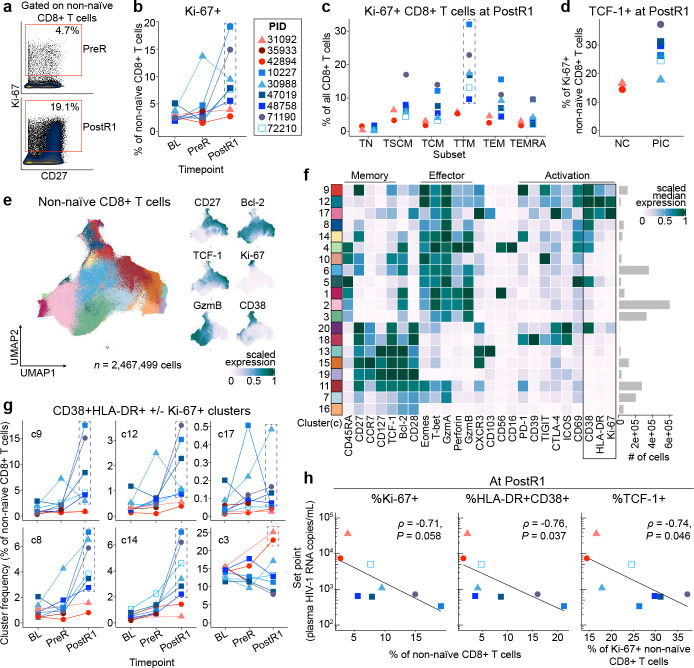
The identification of therapeutic strategies to induce sustained antiretroviral therapy (ART)-free control of HIV infection is a major priority.1 Combination immunotherapy including HIV vaccination, immune stimulation/latency reversal, and passive transfer of broadly neutralizing antibodies (bNAbs) has shown promise in non-human primate models,2-7 but few studies have translated such approaches into people. Here, we performed a single-arm, proof-of-concept combination study of these three approaches in ten people with HIV on ART that included (1) therapeutic vaccination with an HIV/Gag conserved element (CE)-targeted DNA+IL-12 prime/MVA boost regimen followed by (2) administration of two bNAbs (10-1074 and VRC07-523LS) and a toll-like receptor 9 (TLR9) agonist (lefitolimod) during ART suppression, followed by (3) repeat bNAb administration at the time of ART interruption. Seven of the ten participants exhibited partial (low viral load set point) or complete (aviremic) post-intervention control after stopping ART, independent of residual bNAb plasma levels. Robust expansion of activated CD8+ T cells early in response to rebounding virus correlated with lower viral load set points. These data suggest that combination immunotherapy approaches might prove effective to induce sustained control of HIV by slowing rebound and improving CD8+ T cell responses, and that these approaches should continue to be optimized.


Conflict of interest statement

Competing interest declaration MJP serves on a DSMB for American Gene Technologies. SGD reports consulting fees from AbbVie, Eli Lilly, Enanta, GSK, Hookipa, and Immunocore, participated on an advisory board for American Gene Technologies, and owns Tendel stock. MHS is founder and shareholder of Pro Biosciences and Teiko.bio, has been a paid consultant for Five Prime, Ono, January, Earli, Astellas, and Indaptus Therapeutics, and reports research funding from Roche/Genentech, Pfizer, Valitor, and Bristol Myers Squibb. MC served on a Gilead scientific advisory board. MCN has a patent to the bNAbs 10–1074 and 3BNC117 issued (Gilead), is on the SAB of Celldex, and reports personal fees from Gilead and Frontier Biosciences. BKF, GNP, and JIM are inventors on US Government-owned patents related to the CE DNA vaccine. MK has received funding to her institution from Gilead Sciences Inc and Intercept Pharmaceuticals and serves as a scientific consultant for Gilead Sciences Inc, GSK pharmaceuticals, and Resolution Therapeutics. JDR and CJP are employees of Labcorp-Monogram Biosciences and shareholders of Labcorp. DS and EV are employees of and hold stock in Gilead Sciences, Inc.

Figures

Fig. 1.
Fig. 1.. Combination immunotherapy promotes post-intervention control of HIV.
a) Study schema: administration of combination immunotherapy including a DNA vaccine targeting conserved elements (CE) of HIV Gag, two broadly neutralizing antibodies (bNAbs) with a toll-like receptor (TLR)9 agonist in 10 people with HIV (PWH) on antiretroviral therapy (ART), followed by a second infusion of bNAbs immediately prior to an analytic treatment interruption (ATI). b) Time to HIV rebound following ART discontinuation. c) Plasma viral load rebound kinetics from the first day of rebound (x=0); numbers on graph indicate set point (median viral load from 2 weeks post-peak viral load to the time of ART re-start); colors indicate rebound phenotype (red, non-control/typical rebound; blue, viremic post-intervention control; grey, no rebound for >18 months off ART); shape indicates timing of ART after HIV acquisition (circle, chronic infection; triangle, acute infection [<1 month]; square, early infection [1–6 months]; end points indicate day of ART restart, except participant with no rebound (grey); empty square indicates participant with HLA-B*57 allele. d) Comparison of maximum recorded viral load prior to ART initiation (single value) versus post-ART set point (Wilcoxon signed rank). e) HIV rebound slope (in log10 copies/mL/day) from time of rebound to time of peak viral load after stopping ART in people who were controllers prior to starting ART (“prior controller,” n = 7) or not (“prior non-controller,” n = 13) in the absence of any immunotherapeutic intervention, versus the six viremic post-intervention controllers from this trial. MVA, modified vaccinia Ankara. PID, participant ID. NC, non-control. PIC, post-intervention control. NR, no rebound. LOD, limit of detection.
Fig. 2.
Fig. 2.. bNAb pharmacokinetics and susceptibility predict time to HIV rebound but not post-ART set point.
a) Viral load and modeled bNAb concentrations over time following the second dose of bNAbs in each participant; bNAb line colors: 10–1074, black; VRC07–523LS, grey; at the top of each graph, phenotypic susceptibility of autologous HIV to neutralization by bNAbs (inhibitory concentration [IC90]) is depicted in pairs of shaded rectangles (left rectangle: 10–1074; right rectangle: VRC07–523LS); susceptibility was measured from both cell-associated provirus at baseline (depicted in the left-most rectangles in each graph; grey indicates value could not be determined [ND]) as well as from post-rebound plasma virus at multiple timepoints, as indicated. b) Correlation between 10–1074 and VRC07–523LS exposure (AUC, area under the bNAb concentration-time curve following the second dose of bNAbs) and time to rebound. c) Correlation between bNAb susceptibility (IC90) post-rebound and time to rebound after ATI. d) Correlation between bNAb exposure and post-rebound viral load set point. Statistical testing: Spearman’s correlation (b-d).
Fig. 3.
Fig. 3.. Impact of combination immunotherapy on the HIV reservoir and HIV-specific T cell responses.
a) Longitudinal peripheral blood sampling timepoints (applies to Figs. 3–6). CD4+ T cell-associated (CA) (b) potentially intact HIV DNA, as measured by IPDA, and (c) HIV RNA (TAR region, indicating total initiated HIV transcripts). d) Magnitude of IFNγ+ CE-specific CD4+ and CD8+ T cells as measured by intracellular cytokine staining (ICS); numbers below x-axis indicate the proportion of participants with detectable CE-specific responses at each timepoint. e) Magnitude of total (Gag+Pol+Nef+Env) HIV-specific CD8+ T cell responses by ICS. Statistical testing: Linear mixed effect analysis with Tukey’s multiple comparisons test. IPDA, intact proviral DNA assay. TAR, transactivating response. Timepoints: BL, baseline prior to interventions (i.e., on ART); Post-prime, day of MVA vaccination (>8 weeks after last DNA vaccination); Post-boost, 2 weeks after MVA vaccination; PreLEF, immediately prior to lefitolimod dosing; PreATI, immediately prior to ATI; PreR, last PBMC sampling timepoint available prior to rebound (sampled within 1–4 weeks prior to HIV rebound); PostR1, first PBMC sampling timepoint after rebound (for participants with sample available ≤28 days after rebound, at a low viral load [all <2,600 copies/mL]). IFNγ, interferon gamma. NS, no significant change.
Fig. 4.
Fig. 4.. Sequential activation of innate and adaptive immune cells peri-rebound after combination immunotherapy.
a) Heatmap depicting the subset of manually gated immune cell features (including cell types and phenotypes) whose abundance changed significantly between baseline compared to pre-rebound (top), baseline compared to the first post-rebound timepoint (bottom), baseline compared to both timepoints (middle) in the six viremic post-intervention controllers, as measured by CyTOF (Wilcoxon signed rank, P <0.05; median values are z-scored by feature). b) Participant-level changes in key immune features from (a), also including non-controllers.c ) Gating (left) and longitudinal assessment (right) of total plasmablast abundance. d) Representative plot (left) and longitudinal assessment (right) of the frequency of T-bet+ plasmablasts. See Fig. 3 for timepoint definitions. cDC, conventional dendritic cell. NK, natural killer cell. Th, T helper. Ttm, transitional memory. ASC, antibody secreting cell. ABC, activated B cell. Tctl, cytotoxic CD4+ T cell.
Fig. 5.
Fig. 5.. Post-intervention control of HIV is associated with a robust stem/memory-like, activated/proliferating CD8+ T cell response to rebound.
a) Gating strategy and b) Frequency of Ki67+ non-naïve CD8+ T cells by manual gating at the BL, PreR, and PostR1 timepoints as measured by CyTOF. c) Distribution of Ki67+ cells across CD8+ T cell subsets at PostR1. d) Frequency of TCF-1+ cells within the Ki67+ non-naïve CD8+ T cells at PostR1. e) Left panel: UMAP of non-naïve CD8+ T cells including cells from all participants at BL, PreR, PreATI, and PostR1 timepoints. Right panels: Expression of individual markers on the UMAP. f) Heatmap of scaled median expression of markers across all clusters (activation markers CD38, HLA-DR, Ki-67 boxed for emphasis). g) Frequencies of clusters from (f) of activated CD8+ T cells across BL, PreR, and PostR1 timepoints. h) Spearman correlations between each participant’s post-ART set point viral load and the frequency of select non-naïve CD8+ T cell populations at the PostR1 timepoint. Analysis excludes PID 60610 (no rebound) and 35933 (no PostR1 sample). Dashed boxes in b, c, g encompass datapoints from post-intervention controllers. c, cluster. TCF-1, T cell factor 1. GzmB, Granzyme B. GzmA, Granzyme A. Eomes, Eomesodermin.

Similar articles

References

    1. Landovitz R. J., Scott H. & Deeks S. G. Prevention, treatment and cure of HIV infection. Nat. Rev. Microbiol. 21, 657–670 (2023). - PubMed
    1. Nishimura Y. et al. Early antibody therapy can induce long-lasting immunity to SHIV. Nature 543, 559–563 (2017). - PMC - PubMed
    1. Nishimura Y. et al. Immunotherapy during the acute SHIV infection of macaques confers long-term suppression of viremia. J. Exp. Med. 218, (2021). - PMC - PubMed
    1. Borducchi E. N. et al. Ad26/MVA therapeutic vaccination with TLR7 stimulation in SIV-infected rhesus monkeys. Nature 540, 284–287 (2016). - PMC - PubMed
    1. Borducchi E. N. et al. Antibody and TLR7 agonist delay viral rebound in SHIV-infected monkeys. Nature 563, 360–364 (2018). - PMC - PubMed

Publication types

LinkOut - more resources