[Preprint]. 2025 Mar 18:rs.3.rs-5167552.
doi: 10.21203/rs.3.rs-5167552/v1.

Large-scale Plasma Proteomic Profiling Unveils Novel Diagnostic Biomarkers and Pathways for Alzheimer's Disease

Affiliations

Large-scale Plasma Proteomic Profiling Unveils Novel Diagnostic Biomarkers and Pathways for Alzheimer's Disease

Carlos Cruchaga et al. Res Sq. .

Update in

  • Large-scale plasma proteomic profiling unveils diagnostic biomarkers and pathways for Alzheimer's disease.
    Heo G, Xu Y, Wang E, Ali M, Oh HS, Moran-Losada P, Anastasi F, González Escalante A, Puerta R, Song S, Timsina J, Liu M, Western D, Gong K, Chen Y, Kohlfeld P, Flynn A, Thomas AG, Lowery J, Morris JC, Holtzman DM, Perlmutter JS, Schindler SE, Vilor-Tejedor N, Suárez-Calvet M, García-González P, Marquié M, Fernández MV, Boada M, Cano A, Ruiz A, Zhang B, Bennett DA, Benzinger T, Wyss-Coray T, Ibanez L, Sung YJ, Cruchaga C. Heo G, et al. Nat Aging. 2025 Jun;5(6):1114-1131. doi: 10.1038/s43587-025-00872-8. Epub 2025 May 20. Nat Aging. 2025. PMID: 40394224

Abstract

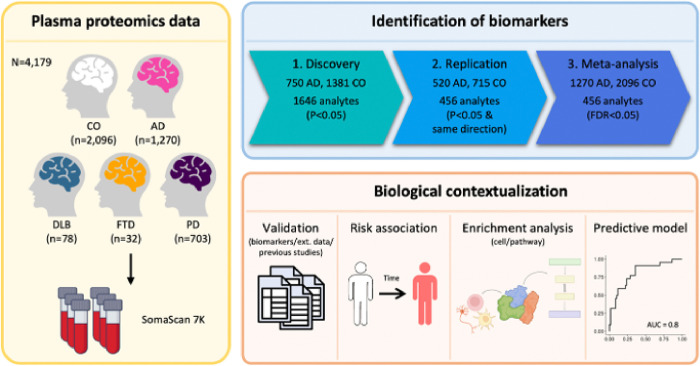
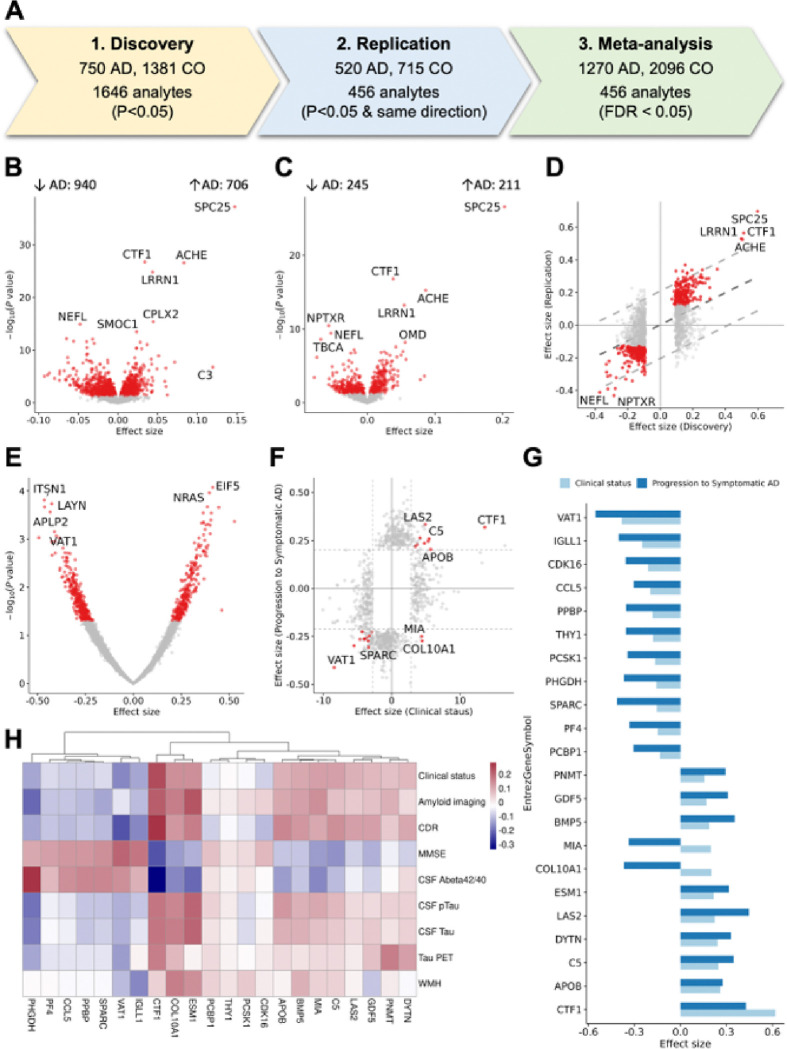
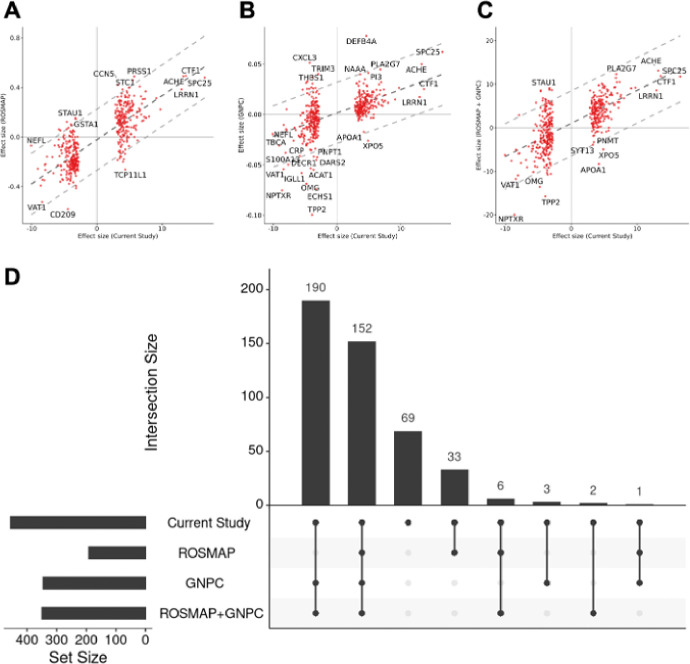
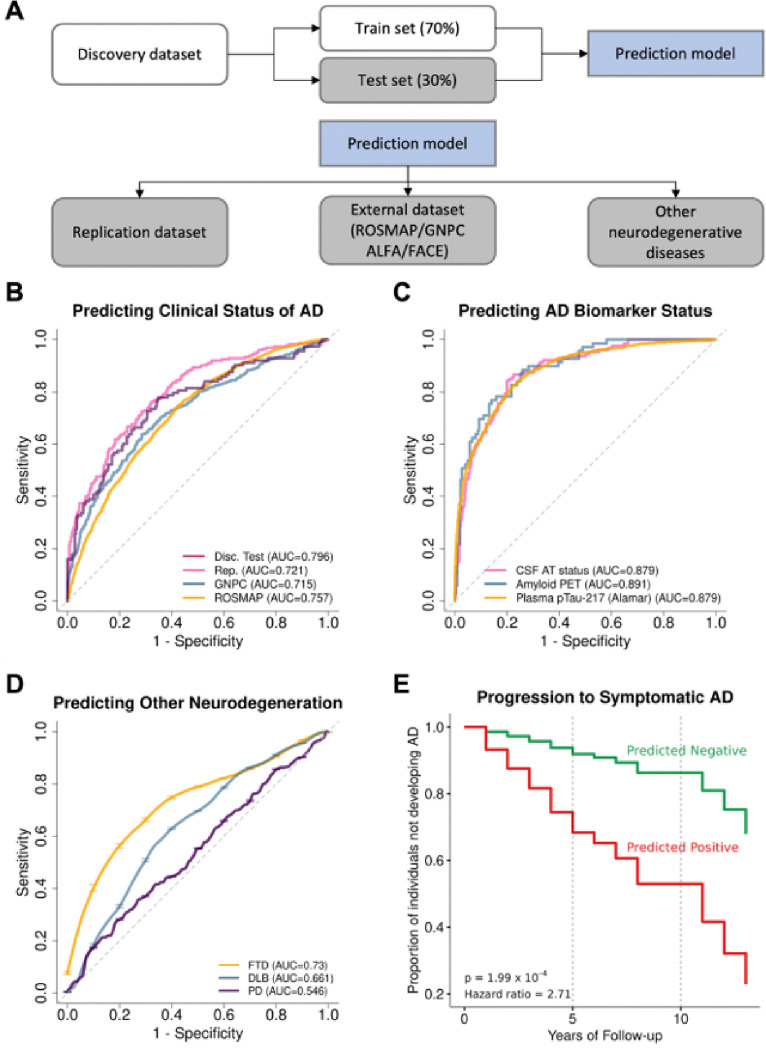
Alzheimer disease (AD) is a complex neurodegenerative disorder. Proteomic studies have been instrumental in identifying AD-related proteins present in the brain, cerebrospinal fluid, and plasma. This study comprehensively examined 6,905 plasma proteins in more than 3,300 well-characterized individuals to identify new proteins, pathways, and predictive model for AD. With three-stage analysis (discovery, replication, and meta-analysis) we identified 416 proteins (294 novel) associated with clinical AD status and the findings were further validated in two external datasets including more than 7,000 samples and seven previous studies. Pathway analysis revealed that these proteins were involved in endothelial and blood hemostatic (ACHE, SMOC1, SMOC2, VEGFA, VEGFB, SPARC), capturing blood brain barrier (BBB) disruption due to disease. Other pathways were capturing known processes implicated in AD, such as lipid dysregulation (APOE, BIN1, CLU, SMPD1, PLA2G12A, CTSF) or immune response (C5, CFB, DEFA5, FBXL4), which includes proteins known to be part of the causal pathway indicating that some of the identified proteins and pathways are involved in disease pathogenesis. An enrichment of brain and neural pathways (axonal guidance signaling or myelination signaling) indicates that, in fact, blood proteomics capture brain- and disease-related changes, which can lead to the identification of novel biomarkers and predictive models. Machine learning model was employed to identify a set of seven proteins that were highly predictive of both clinical AD (AUC > 0.72) and biomarker-defined AD status (AUC > 0.88), that were replicated in multiple external cohorts as well as with orthogonal platforms. These extensive findings underscore the potential of using plasma proteins as biomarkers for early detection and monitoring of AD, as well as potentially guiding treatment decisions.


Conflict of interest statement

Declarations Conflict of interest CC has received research support from GSK and EISAI. CC is a member of the scientific advisory board of Circular Genomics and owns stocks. CC is a member of the scientific advisory board of ADmit. There is an invention disclosure for the prediction models, including protein IDs, alternative proteins and weights, cut off and algorithms. CC has served on scientific advisory for GSK and Novo Nordisk DMH is a co-founder with equity in C2N Diagnostics, LLC. DMH is on the scientific advisory boards of Genentech, Denali, C2N Diagnostics, and Cajal Neurosciences. DMH consults for Asteroid, Acta Pharmaceuticals, Alnylam, Pfizer, and Switch. TWC and HSO are co-founders and scientific advisors of Teal Omics Inc. and have received equity stakes. TWC is a co-founder and scientific advisor of Alkahest Inc. and Qinotto Inc. and has received equity stakes in these companies. SES has served on scientific advisory boards on biomarker testing and clinical care pathways for Eisai and Novo Nordisk and has received speaking fees for presentations on biomarker testing from Eisai, Eli Lilly, and Novo Nordisk. MS-C has received in the past 36mo consultancy/speaker fees (paid to the institution) from by Almirall, Eli Lilly, Novo Nordisk, and Roche Diagnostics. He has received consultancy fees or served on advisory boards (paid to the institution) of Eli Lilly, Grifols, Novo Nordisk, and Roche Diagnostics. He was granted a project and is a site investigator of a clinical trial (funded to the institution) by Roche Diagnostics. MS-C did not receive any personal compensation from these organizations or any other for-profit organization.

Figures

Figure 1
Figure 1. Study Overview.
Plasma samples from the Knight ADRC and Stanford ADRC cohorts were analyzed using the SomaLogic SomaScan assay, measuring a total of 6,905 analytes targeting 6,106 proteins. Differential abundance analyses were conducted to compare cognitively normal individuals with those diagnosed with Alzheimer’s disease. A meta-analysis was then performed using results from both discovery and replication datasets. Identified proteins were further validated using Alzheimer’s disease biomarkers, external datasets and findings from previous studies. Subsequent analyses assessed the risk of progression to Alzheimer’s disease. Enrichment tests were conducted to explore associations with cell types and pathways. Lastly, a predictive model was trained to evaluate the performance of the selected proteins. Abbreviations: CO, Control; AD, Alzheimer’s disease; DLB, Dementia with Lewy bodies; FTD, Frontotemporal dementia; PD, Parkinson’s disease; Ext. data, External dataset.
Figure 2
Figure 2. Differential Abundance Analysis.
(A) Overview of the process for identifying plasma biomarkers dysregulated in clinical Alzheimer’s disease. (B, C) Volcano plots displaying proteins with significantly different abundances when comparing cognitively normal controls (CO) and Alzheimer’s disease (AD) patients in (B) Discovery and (C) Replication datasets. Red dots indicate proteins with a p-value < 0.05. (D) Scatter plot comparing effect sizes between the Discovery and Replication datasets, focusing on aptamers that were significant in the Discovery dataset (1,646 aptamers). The central dotted line shows the comparison pattern, with outer dotted lines marking the 95% confidence interval. (E)Volcano plot showing proteins with significantly different abundances when comparing individuals who converted to AD. (F) Scatter plot comparing effect sizes from the meta-analysis and AD risk analysis. Red dots indicate proteins that were significant in both analyses (FDR in meta-analysis and p < 0.05 in AD risk analysis) (G) Bar plot comparing effect sizes from the AD risk and clinical status analyses for 22 analytes significant in both the meta-analysis and AD risk analysis. (H) Heatmap showing correlations between 22 aptamers and AD-related phenotypes. Abbreviations: CO, Control; AD, Alzheimer’s disease; CSF, Cerebrospinal fluid; pTau, Phosphorylated tau; CDR, Clinical Dementia Rating; WMH, White matter hyperintensities; MMSE, Mini-Mental State Examination; Abeta, amyloid beta.
Figure 3
Figure 3. Replication in External Datasets.
(A-C) Scatter plots comparing effect sizes from the meta-analysis with those from (A) ROSMAP, (B) GNPC, and (C) a combined meta-analysis of ROSMAP and GNPC, focusing on 456 proteins identified as significant in clinical Alzheimer’s disease. The central dotted line shows the comparison pattern, with outer dotted lines marking the 95% confidence interval. (D) Upset plot showing the overlap of significant analytes from the current study, ROSMAP, GNPC, and the combined meta-analysis with ROSMAP and GNPC, highlighting the 456 significant proteins.
Figure 4
Figure 4. Pathway and Network Analyses of AD associated Proteins.
(A)Heatmap showing the association of specific genes with biological pathways and processes from GO, IPA, and Reactome. The color coding corresponds to the specific group each pathway belongs to. (B) Networks of two key modules M4 and M7 identified through the MEGENA. Nodes represent individual proteins, with up-regulated proteins colored in red and down-regulated proteins in blue. Protein without significant changes in AD are shown in gray. Hub proteins are shown as larger nodes. Abbreviations: GO, Gene Ontology; IPA, Ingenuity Pathway Analysis.
Figure 5
Figure 5. Predictive Performance of the Model with 7 Plasma Proteins.
(A) Diagram showing how the datasets were used for training and testing the predictive model. (B) Receiver Operating Characteristic (ROC) curves evaluating the model’s predictive power in classifying clinical Alzheimer’s disease (AD) status using two independent datasets: the test set from Discovery dataset (red). Replication dataset (pink), GNPC (blue) and ROSMAP (orange). (C) ROC curves for distinguishing AD biomarker status, including CSF AT status (pink), Amyloid PET (blue), and ptau217(orange). (D) ROC curves for distinguishing frontotemporal dementia (FTD; orange), dementia with Lewy bodies (DLB; blue), and Parkinson’s disease (PD; purple). (E) Kaplan-Meier survival curves for progression to symptomatic AD after the initial blood draw. The predicted negative group (green line) and the predicted positive group (red line) are plotted, illustrating the proportion of participants remaining cognitively normal over years of follow-up. The p-value indicates the significant difference in progression to AD between individuals predicted to have AD versus controls, according to the cox proportional hazard model. Abbreviations: AD, Alzheimer’s disease; Disc, Discovery; Rep, Replication; CSF, Cerebrospinal fluid; AT, Amyloid/tau; PET, Positron emission tomography; pTau, Phosphorylated tau; FTD, Frontotemporal dementia; DLB, Dementia with Lewy bodies; PD, Parkinson’s disease.

References

    1. 2024 Alzheimer’s disease facts and figures. Alzheimers Dement 20, 3708–3821 (2024). 10.1002/alz.13809 - DOI - PMC - PubMed
    1. Hansson O. et al. CSF biomarkers of Alzheimer’s disease concord with amyloid-beta PET and predict clinical progression: A study of fully automated immunoassays in BioFINDER and ADNI cohorts. Alzheimers Dement 14, 1470–1481 (2018). 10.1016/j.jalz.2018.01.010 - DOI - PMC - PubMed
    1. Hansson O., Lehmann S., Otto M., Zetterberg H. & Lewczuk P. Advantages and disadvantages of the use of the CSF Amyloid beta (Abeta) 42/40 ratio in the diagnosis of Alzheimer’s Disease. Alzheimers Res Ther 11, 34 (2019). 10.1186/s13195-019-0485-0 - DOI - PMC - PubMed
    1. Janelidze S. et al. Plasma P-tau181 in Alzheimer’s disease: relationship to other biomarkers, differential diagnosis, neuropathology and longitudinal progression to Alzheimer’s dementia. Nat Med 26, 379–386 (2020). 10.1038/s41591-020-0755-1 - DOI - PubMed
    1. Karikari T. K. et al. Blood phosphorylated tau 181 as a biomarker for Alzheimer’s disease: a diagnostic performance and prediction modelling study using data from four prospective cohorts. Lancet Neurol 19, 422–433 (2020). 10.1016/S1474-4422(20)30071-5 - DOI - PubMed

Publication types

LinkOut - more resources