. 2022 Sep 14;5(1):228-240.
doi: 10.1016/j.fmre.2022.08.021. eCollection 2025 Jan.

The comprehensive assessment of epigenetics changes during skin development

Affiliations

The comprehensive assessment of epigenetics changes during skin development

Li Lei et al. Fundam Res. .

Abstract

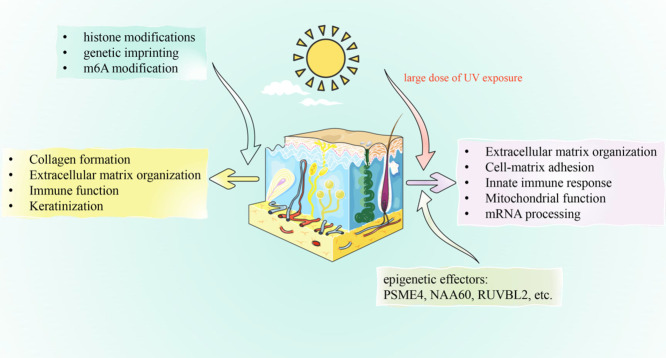
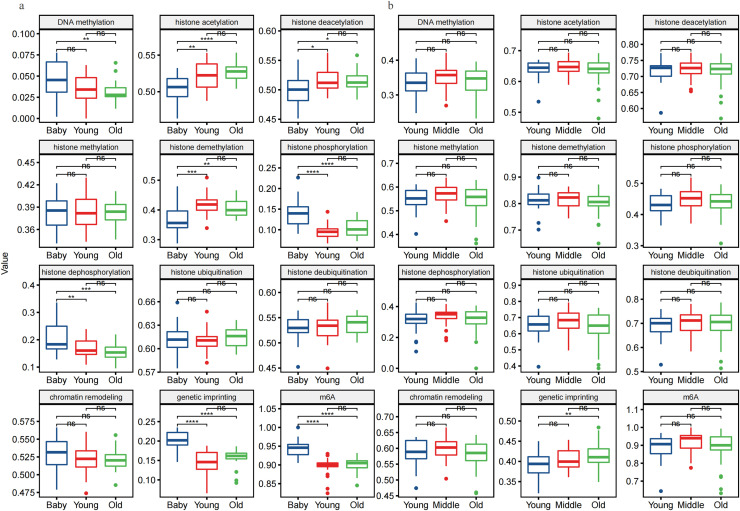
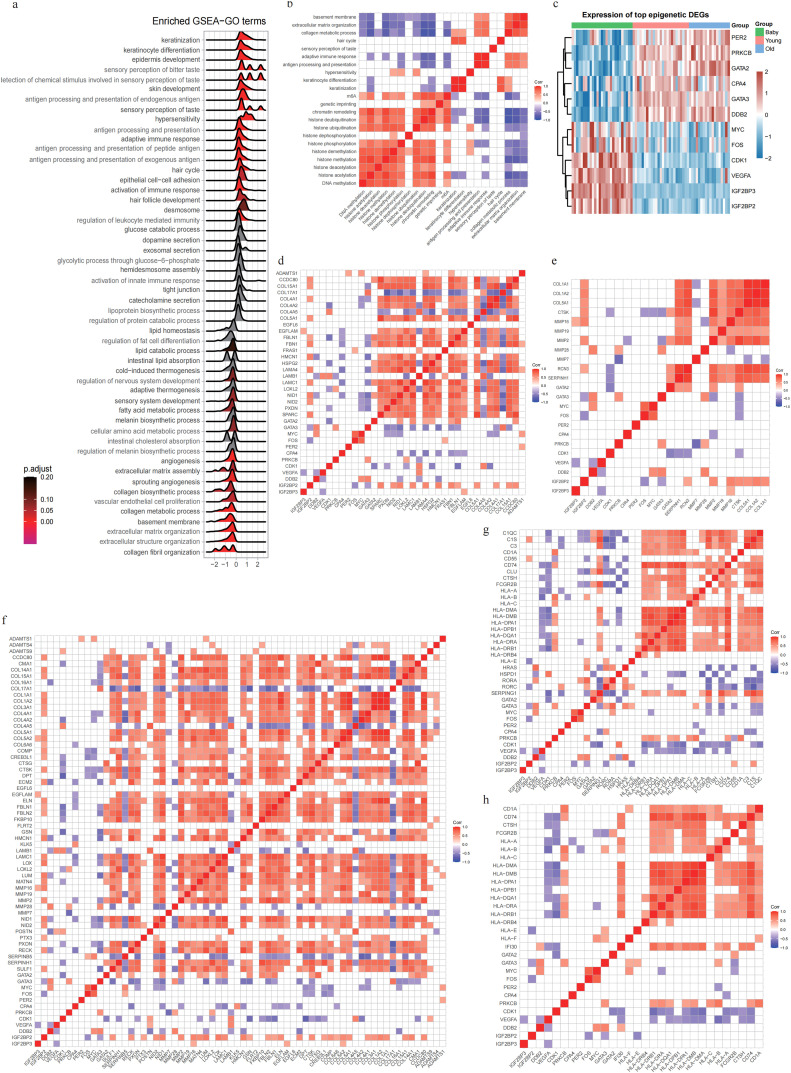
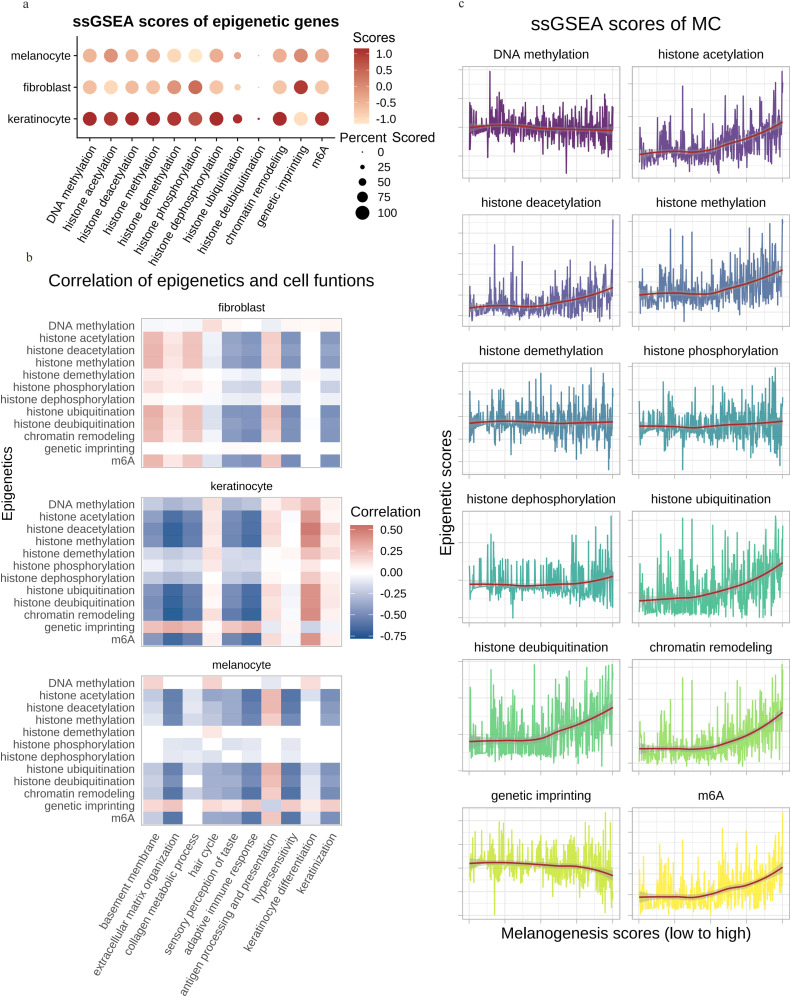
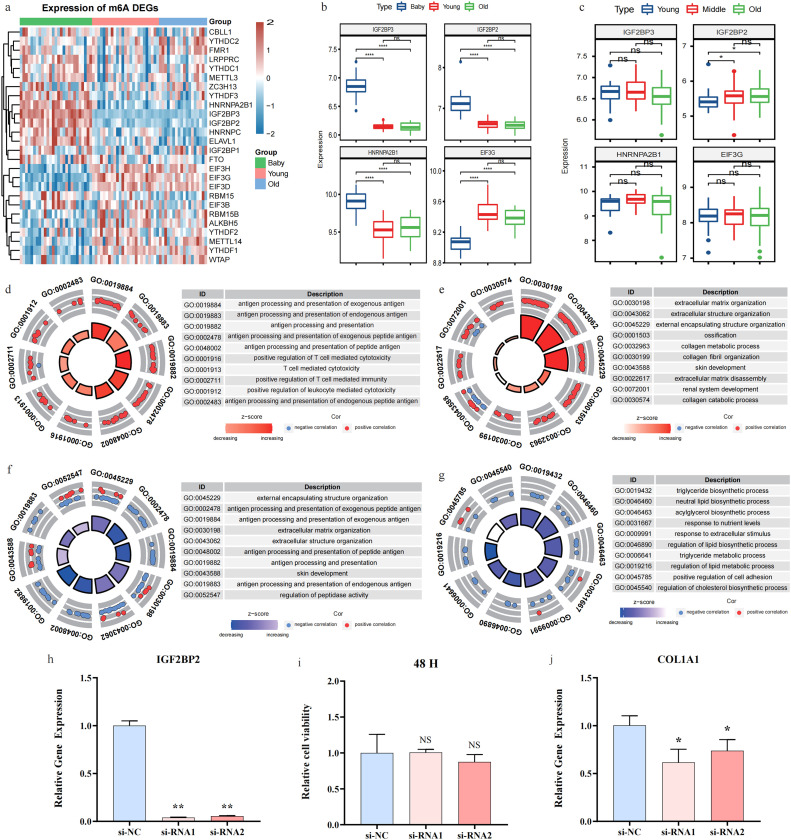
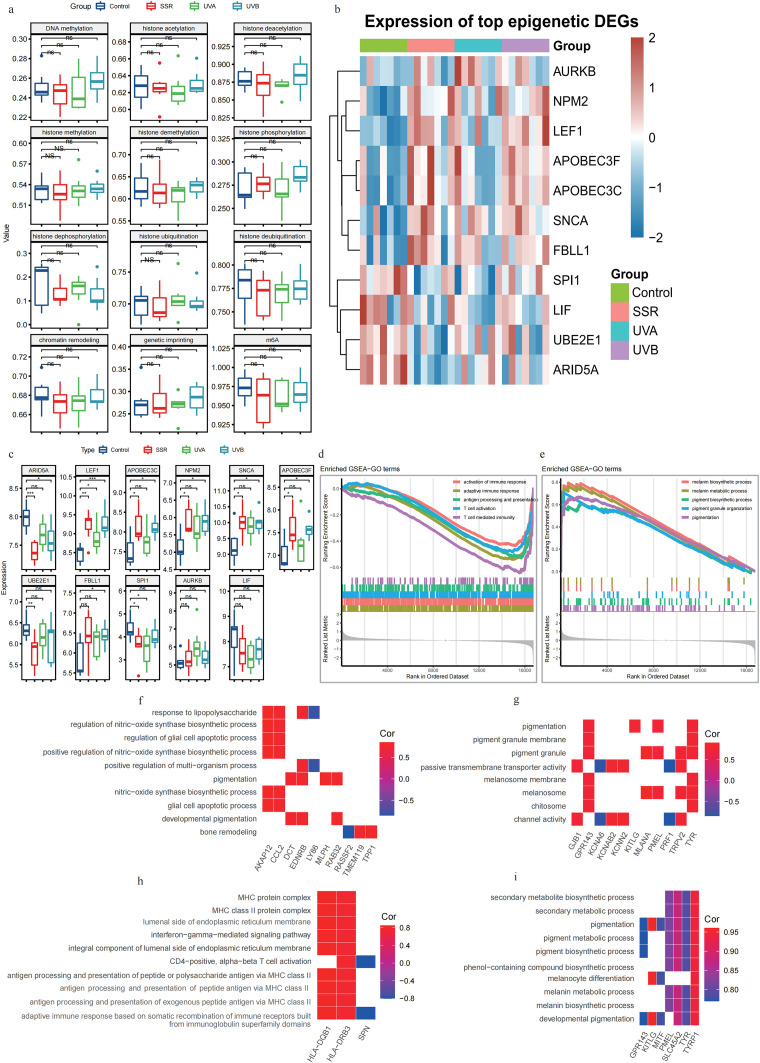
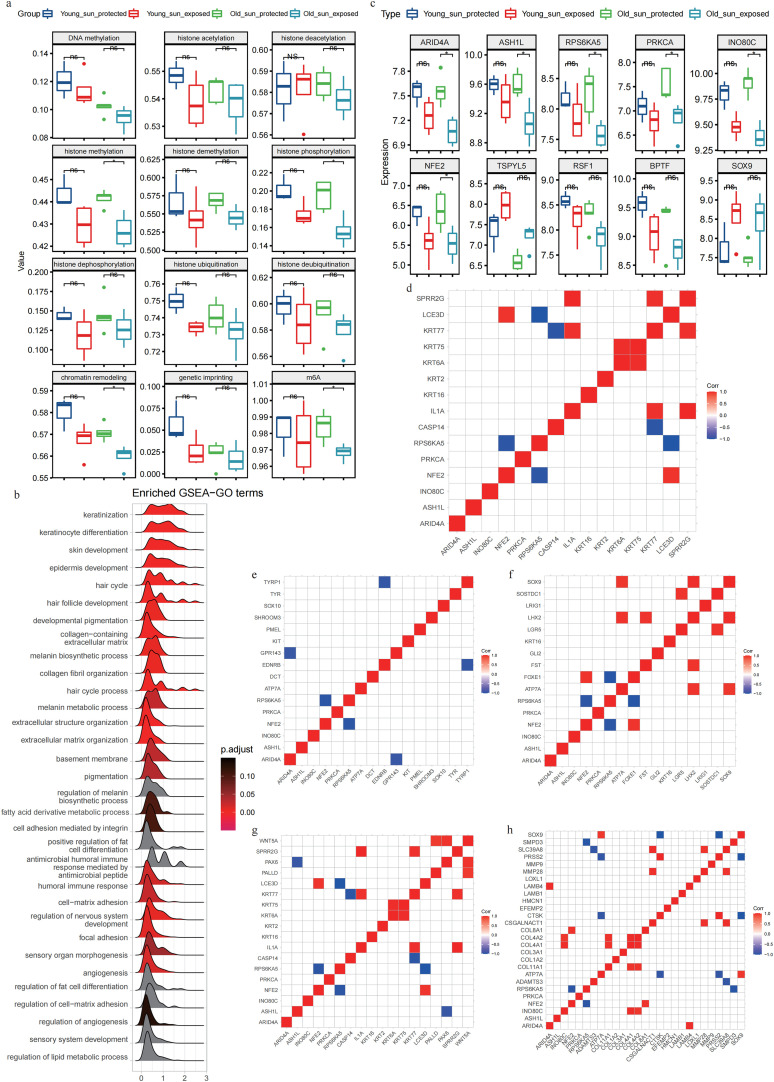
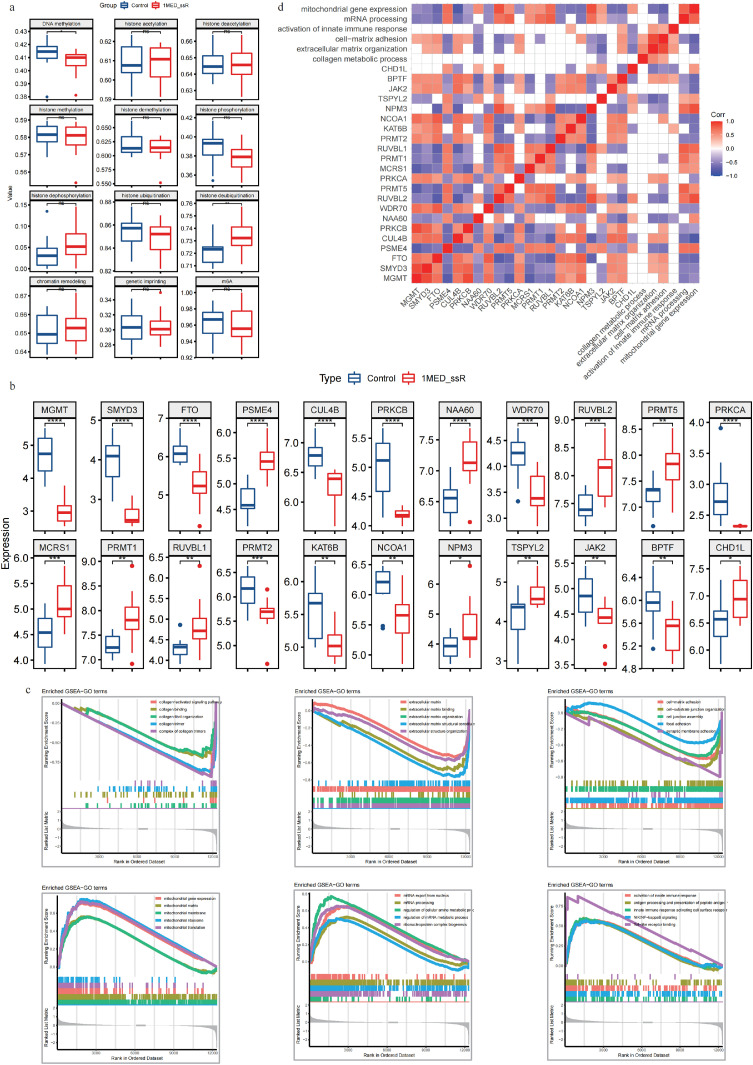
Epigenetic regulation is critical to multiple physiological and pathological processes. However, little is known regarding the epigenetic changes during neonatal skin development and skin aging, and in response to ultraviolet (UV) exposure. The transcriptomes of human skin samples from different ages or irradiated with different types and doses of UV light were analyzed using R (version 4.0.3) software. The epigenetic landscape of the skin, including histone modifications, genetic imprinting and m6A modification, which are mainly involved in collagen formation, extracellular matrix organization, immune function and keratinization, underwent significant changes during neonatal to adult development. Epigenetic effectors such as IGF2BP2, GATA2, GATA3, CPA4 and CDK1 were significantly correlated with extracellular matrix organization, and VEGFA, CDK1 and PRKCB with skin immune function. The m6A readers such as IGF2BP2, IGF2BP3, HNRNPA2B1 and EIF3G showed significant correlation with extracellular matrix organization, metabolism, or antigen processing and presentation. Small doses of UV exposure only induced changes in the expression levels of some epigenetic effectors, without any significant effect on the overall epigenetic landscape. However, the minimal erythema dose of UV exposure altered multiple epigenetic effectors regulating extracellular matrix organization, cell-matrix adhesion, innate immune response, mitochondrial function and mRNA processing. In addition, epigenetic changes following UV exposure were more pronounced in the elderly skin compared to the younger skin. In conclusion, histone modifications, genetic imprinting and m6A modification play critical roles during skin development, and a large dose of UV exposure can significantly change the expression of multiple epigenetic effectors.

Keywords: Aging; Epigenetics; Skin development; Ultraviolet; m6A.


Conflict of interest statement

The authors declare that they have no conflicts of interest in this work.

Figures

Image, graphical abstract
Graphical abstract
Fig 1
Fig. 1
Age-related changes in epigenetic modifications in the human skin. Epigenetic changes in the unexposed skin from different ages were determined by ssGESA on the (a) GSE181022 and (b) GSE18876 datasets. The value of the ordinate represents the normalized score of ssGSEA. Wilcox.test was used to compare data between two groups. * p < 0.05, ** p < 0.01, *** p < 0.001, **** p < 0.0001, ns: p > 0.05.
Fig 2
Fig. 2
The association between epigenetic regulation and skin function. Bioinformatics analysis of neonate and young skin data in GSE181022 dataset. (a) GSEA was used to perform GO enrichment analysis of the skin functions. (b) Correlation of each functional set with each epigenetic modification. (c) Heatmap showing epigenetic effectors among the top DEGs. (d-g) Correlation analysis of top epigenetic effectors and genes in the functional sets of basement membrane (d), collagen metabolic process (e), extracellular matrix organization (f), adaptive immune response (g) and antigen processing and presentation (h). The “pearson” method was used for correlation analysis. "corr" is short for correlation. White squares represent p-values greater than 0.05.
Fig 3
Fig. 3
Epigenetics in different skin cells from single-cell transcriptome data of 8 healthy human skin samples (GSE147424). (a) ssGSEA was performed to score each epigenetic modification in different skin cells. (b) Correlation of each functional set with each epigenetic modification. The “pearson” method was used for correlation analysis. White squares represent p-values greater than 0.05. (c) Melanocytes were sorted by melanogenesis-related gene scores (left to right of horizontal axis: low to high scores), the vertical axis represents the score of epigenetic scores.
Fig 4
Fig. 4
Correlation of m6A modification with skin function. Possible roles of genes related to m6A modification in skin function. (a) Heatmaps showing changes in key genes related to m6A modification in GSE181022 dataset. (b) Differential expression of readers in the neonate and young skin (GSE181022). (c) Differential expression of readers in adult skin of different ages (GSE18876). (d-g) Top GO enrichment results of DEGs highly correlated with (e) EIF3G, (e) IGF2BP2, (f) HNRNPA2B1 and (g) IGF2BP3. After the siRNAs targeting IGF2BP2 were transfected into the fibroblasts, (h) qRT-PCR was used to detect the expression of IGF2BP2, (I) CCK8 assay was used to detect the cell viability, and (j) qRT-PCR was used to detect the expression of COL1A1. The graphs in Fig. 4 d-g present the enrichment results using a circle. The outside of the circle shows the ID of GO. The specific information of GO is displayed in the table on the right side of the circle. Dots in outer circle represent genes that are positively or negatively correlated with EIF3G, IGF2BP2, HNRNPA2B1 or IGF2BP3. The red dots present positive correlation, and the light blue dots present negative correlation. Squares in inter circle represent the z-score. The z-score gives an indication that a GO term is more likely to decrease or increase. Calculation method of z-score: (number of positive correlation genes-number of negative correlation genes)/sqrt (number of genes). Wilcox.test or t.test was used to compare data between two groups. * p < 0.05, ** p < 0.01, **** p < 0.0001, ns: p > 0.05.
Fig 5
Fig. 5
Changes in epigenetic modifications in a model of UV-induced skin pigmentation. The overall effects of ultraviolet A (UVA), ultraviolet B (UVB), and solar-simulated radiation (SSR, UVA+UVB) on epigenetic modifications were analyzed in the GSE56754 dataset. (a) Epigenetic changes as per ssGSEA. The value of the ordinate represents the normalized score of ssGSEA. (b) Heatmap showing epigenetic effectors in top DEGs. (c) Differential analysis of top epigenetic effectors. (d-e) GSEA was used to analyze the changes in skin immune function and melanogenesis function. (f-i) Top GO results of DEGs highly correlated with (f) ARID5A, (g) LEF1, (h) NPM2 and (i) SNCA. Wilcox.test was used to compare data between two groups. Cor represented the correlation coefficient between DEGs and ARID5A, LEF1, NPM2, or SNCA. The gradient color represented the correlation coefficient. * p < 0.05, ** p < 0.01, *** p < 0.001, ns: p > 0.05.
Fig 6
Fig. 6
Epigenetic changes differ between young and old skin under exposure conditions. Changes in epigenetic modifications in the GSE52980 dataset. (a) Epigenetic changes as per ssGESA. The value of the ordinate represents the normalized score of ssGSEA. (b) GSEA was used to analyze the changes of skin function. (c) Differential analysis of top epigenetic effectors. (d-h) Correlation between top epigenetic effectors and top DEGs involved in (d) keratinization, (e) pigmentation, (f) hair cycle, (g) keratinocyte differentiation and (h) extracellular structure organization. The “pearson” method was used for correlation analysis. “corr” is short for correlation. Wilcox.test was used to compare data between two groups. * p < 0.05, ns: p > 0.05. White squares represent p-values greater than 0.05.
Fig 7
Fig. 7
Effects of MED UV on epigenetic regulation of skin. The transcriptomes of control group and MED/SSR-treated skin in the GSE22083 dataset were analyzed. (a) Epigenetic changes as per ssGESA. The value of the ordinate represents the normalized score of ssGSEA. (b) Differential analysis of top epigenetic effectors. (c) GSEA was used to analyze the changes of skin function. (e) Correlation analysis of top epigenetic effectors with each functional set. The “pearson” method was used for correlation analysis. "corr" is short for correlation. Wilcox.test was used to compare data between two groups. * p < 0.05, ** p < 0.01, *** p < 0.001, **** p < 0.0001, ns: p > 0.05. White squares represent p-values greater than 0.05.

Similar articles

References

    1. Friedman N., Rando O.J. Epigenomics and the structure of the living genome. Genome Res. 2015;25(10):1482–1490. - PMC - PubMed
    1. Stricker S.H., Köferle A., Beck S. From profiles to function in epigenomics. Nat. Rev. Genet. 2017;18(1):51–66. - PubMed
    1. Cavalli G., Heard E. Advances in epigenetics link genetics to the environment and disease. Nature. 2019;571(7766):489–499. - PubMed
    1. Giunta E.F., Arrichiello G., Curvietto M., et al. Epigenetic regulation in melanoma: Facts and hopes. Cells. 2021;10(8) - PMC - PubMed
    1. Long H., Yin H., Wang L., et al. The critical role of epigenetics in systemic lupus erythematosus and autoimmunity. J. Autoimmun. 2016;74:118–138. - PubMed

LinkOut - more resources