[Preprint]. 2025 May 20:2025.03.19.644049.
doi: 10.1101/2025.03.19.644049.

Two Axes of White Matter Development

Affiliations

Two Axes of White Matter Development

Audrey C Luo et al. bioRxiv. .

Abstract

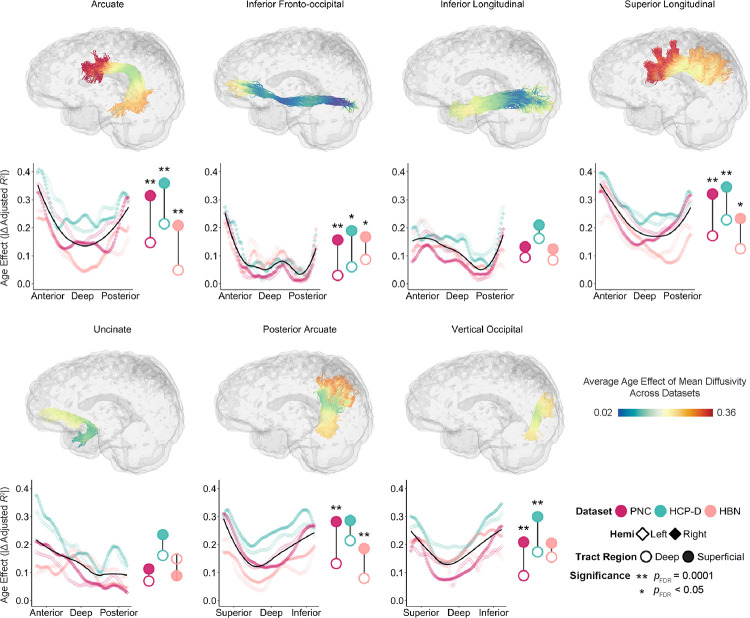
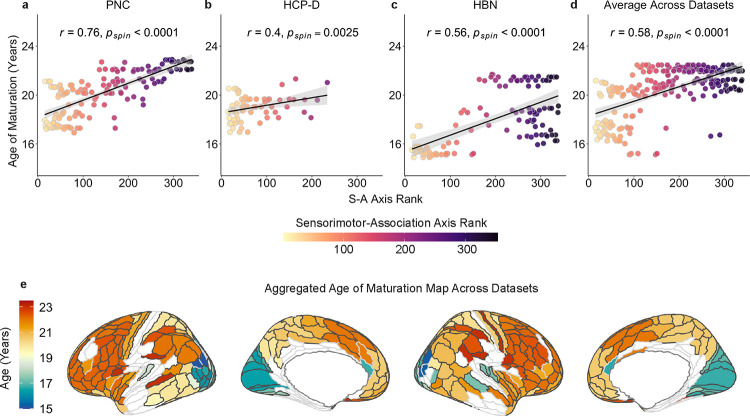
Despite decades of neuroimaging research, how white matter develops along the length of major tracts in humans remains unknown. Here, we identify fundamental patterns of white matter maturation by examining developmental variation along major, long-range cortico-cortical tracts in youth ages 5-23 years using diffusion MRI from three large-scale, cross-sectional datasets (total N = 2,716). Across datasets, we delineate two replicable axes of human white matter development. First, we find a deep-to-superficial axis, in which superficial tract regions near the cortical surface exhibit greater age-related change than deep tract regions. Second, we demonstrate that the development of superficial tract regions aligns with the cortical hierarchy defined by the sensorimotor-association axis, with tract ends adjacent to sensorimotor cortices maturing earlier than those adjacent to association cortices. These results reveal developmental variation along tracts that conventional tract-average analyses have previously obscured, challenging the implicit assumption that white matter tracts mature uniformly along their length. Such developmental variation along tracts may have functional implications, including mitigating ephaptic coupling in densely packed deep tract regions and tuning neural synchrony through hierarchical development in superficial tract regions - ultimately refining neural transmission in youth.


Conflict of interest statement

DECLARATION OF INTERESTS R.T.S has received consulting income from Octave Bioscience and compensation for scientific reviewing from the American Medical Association. A.A.B. holds equity in Centile Biosciences.

Figures

Figure 1.
Figure 1.. White matter development occurs along a deep-to-superficial axis in callosal tracts.
The magnitude of the mean diffusivity age effect varies continuously along each of eight tracts that comprise the corpus callosum. Each callosal tract is shown in a glass brain of an exemplar participant, with that participant’s streamlines colored by the average magnitude of the age effect across datasets. Below each glass brain, we display the magnitude of the age effect at 100 equidistant nodes that span the length of each tract. Data points are colored by dataset: the Philadelphia Neurodevelopmental Cohort (PNC; magenta), Human Connectome Project: Development (HCP-D; teal), and Healthy Brain Network (HBN; coral). Nodes without a significant age association are colored in gray (QFDR > 0.05). The black LOESS-smoothed line shows the overall trend for each tract, averaged across datasets. To the right of each age effect plot, average age effects for superficial (filled circle) and deep (open circle) tract regions are shown for each dataset. Significant differences between age effects of superficial and deep tract regions were assessed using a network enrichment significance test. Stars denote significance levels following FDR correction.
Figure 2.
Figure 2.. Development of microstructural measures from multi-shell diffusion models occurs along a deep-to-superficial axis in callosal tracts.
The magnitudes of the intracellular volume fraction (ICVF; computed from NODDI) and return-to-origin probability (RTOP; computed from MAP-MRI) age effect vary continuously along each of eight tracts that comprise the corpus callosum. We display the magnitude of the age effect for each diffusion measure at 100 equidistant nodes that span the length of each tract. Data points are colored by each dataset with multi-shell diffusion imaging data: Human Connectome Project: Development (HCP-D; teal) and Healthy Brain Network (HBN; coral). Nodes without a significant age association are colored in gray (QFDR > 0.05). The black LOESS-smoothed line shows the overall trend for each tract, averaged across datasets. To the right of each age effect plot, average age effects for superficial (filled circle) and deep (open circle) tract regions are shown for each dataset. Significant differences between age effects of superficial and deep tract regions were assessed using a network enrichment significance test. Stars denote significance levels following FDR correction.
Figure 3.
Figure 3.. White matter development follows a deep-to-superficial axis in association tracts.
Magnitudes of the mean diffusivity age effect along bilateral association tracts vary along a deep-to-superficial axis in PNC, HCP-D, and HBN. Each tract from an exemplar participant is colored by the average magnitude of the mean diffusivity age effect across datasets, depicting the spatial distribution of age effects. Below each glass brain, we display the magnitude of the age effect at 100 equidistant points along the tract’s length. Colors indicate dataset; nodes that do not display significant age effects are shown in gray (QFDR > 0.05). Open and closed diamond shapes represent left and right hemisphere tracts, respectively. The black LOESS-smoothed line shows the trend for each tract averaged across datasets and hemispheres. To the right of each age effect plot, average age effects for bilateral superficial (filled circle) and deep (open circle) tract regions are displayed for each dataset. Statistical comparisons between age effects of superficial and deep tract regions were assessed using a network enrichment significance test, with significance indicated by stars following FDR correction.
Figure 4.
Figure 4.. Superficial tract regions in the motor segment of the corpus callosum connecting homotopic cortical endpoints exhibit similar developmental patterns.
Developmental measures of superficial tract regions in PNC (first column), HCP-D (second column), and HBN (third column) show similar patterns for each endpoint of the callosum motor. (a-c) Magnitudes of the mean diffusivity age effect for the superficial tract regions adjacent to the right and left hemisphere cortical endpoints of the callosum motor are displayed on the cortical surface. (d-f) Magnitudes of the age effect at the right (red) and left (blue) motor endpoints do not significantly differ in all three datasets. Statistical comparisons between right and left white matter age effects were assessed using a network enrichment significance test. (g-h) Developmental patterns for superficial tract regions are overlaid on participant-level mean diffusivity values. In all three datasets, superficial tract regions adjacent to right and left motor cortices exhibit highly similar patterns. Colored bars indicate windows of significant developmental change in mean diffusivity, with higher transparency corresponding to slower rates of change.
Figure 5.
Figure 5.. Superficial tract regions in inferior fronto-occipital fasciculus connecting heterotopic cortical endpoints exhibit distinct developmental patterns.
Superficial tract regions in the inferior fronto-occipital fasciculus (IFOF) exhibit distinct developmental patterns between the frontal and occipital endpoints, which respectively have high and low sensorimotor-association (S-A) ranks on average. (a-c) The magnitudes of the age effect for frontal and occipital white matter of IFOF are shown on the cortical surface. (d-f) The age effect, averaged across hemispheres, is significantly larger in frontal (red) compared to occipital (blue) white matter in PNC and HCP-D. Statistical comparisons between frontal and occipital white matter age effects were assessed using a network enrichment significance test. (g-h) Developmental patterns for frontal and occipital white matter are overlaid on participant-level mean diffusivity values. Colored bars depict windows of significant developmental change, with higher transparency indicating slower rates of change. In all datasets, occipital white matter matures in mid-adolescence whereas frontal white matter continues to significantly decrease in mean diffusivity beyond the studied age window.
Figure 6.
Figure 6.. Cortical endpoints at opposite ends of the cortical hierarchy have discrepant ages of maturation.
(a) Callosum motor terminates on homotopic motor regions, resulting in a small mean S-A rank difference of 0.8. (b) The inferior fronto-occipital fasciculus is a long-range association tract that connects frontal regions with high sensorimotor-association (S-A) axis ranks to occipital regions with low S-A ranks, resulting in a large mean S-A rank difference (>200) between its endpoints in each hemisphere. (c-e) The relationship between the difference in age of maturation (ΔAge) and the difference in mean S-A axis rank (ΔS-A rank) between endpoints is displayed for (c) the PNC, (d) HCP-D, (e) HBN, and (f) across datasets. Each data point represents a unique white matter tract, colored by tract type (association tracts in light pink, callosal tracts in dark pink). Tracts connecting regions with small ΔS-A rank—including all callosal tracts and several association tracts such as the arcuate—exhibit small ΔAge. In contrast, bilateral inferior fronto-occipital and inferior longitudinal fasciculi, which connect regions with large ΔS-A rank, exhibit large ΔAge between their endpoints. In all datasets, spin-based permutation tests confirmed that tracts with large differences in S-A rank have significantly greater ΔAge between their endpoints compared to tracts with small differences. Horizontal lines indicate the mean ΔAge for the two groups.
Figure 7.
Figure 7.. Superficial tract regions develop hierarchically along the sensorimotor-association axis.
Parcellated cortical maps were created by averaging ages of maturation across superficial tract regions and assigning the average value to each HCP-MMP region that had a tract termination for each dataset. (a-c) Age of maturation is associated with S-A axis rank in each dataset; regions with older ages of maturation rank higher on the S-A axis in all three datasets: (a) PNC (r = 0.76, pspin < 0.0001), (b) HCP-D (r = 0.4, pspin = 0.0025), and (c) HBN (r = 0.56, pspin < 0.0001), as well as (d) across all datasets (r = 0.58, pspin < 0.0001). Statistical significance of correlations was assessed using region-based spin tests. This analysis excluded superficial tract regions that matured later than the maximum age studied in each dataset; see Figure S5 for similar results that include these regions. (e) Dataset-specific maps were then averaged to produce a cross-dataset map. White represents HCP-MMP regions without a tract termination.

References

    1. Knickmeyer R. C. et al. A Structural MRI Study of Human Brain Development from Birth to 2 Years. J. Neurosci. 28, 12176–12182 (2008). - PMC - PubMed
    1. Lebel C. & Beaulieu C. Longitudinal Development of Human Brain Wiring Continues from Childhood into Adulthood. J. Neurosci. 31, 10937–10947 (2011). - PMC - PubMed
    1. Sydnor V. J. et al. Neurodevelopment of the association cortices: Patterns, mechanisms, and implications for psychopathology. Neuron 109, 2820–2846 (2021). - PMC - PubMed
    1. Luo A. C. et al. Functional connectivity development along the sensorimotor-association axis enhances the cortical hierarchy. Nature Communications 15, 3511 (2024). - PMC - PubMed
    1. Sydnor V. J. et al. Intrinsic activity development unfolds along a sensorimotor–association cortical axis in youth. Nat Neurosci 1–12 (2023) doi: 10.1038/s41593-023-01282-y. - DOI - PMC - PubMed

Publication types

LinkOut - more resources