[Preprint]. 2025 Mar 17:2025.03.14.643359.
doi: 10.1101/2025.03.14.643359.

Antigenic cancer persister cells survive direct T cell attack

Affiliations

Antigenic cancer persister cells survive direct T cell attack

Michael X Wang et al. bioRxiv. .

Abstract

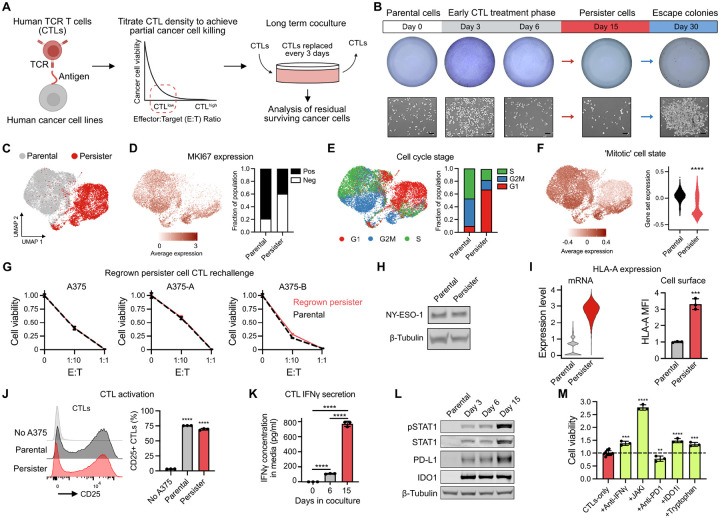
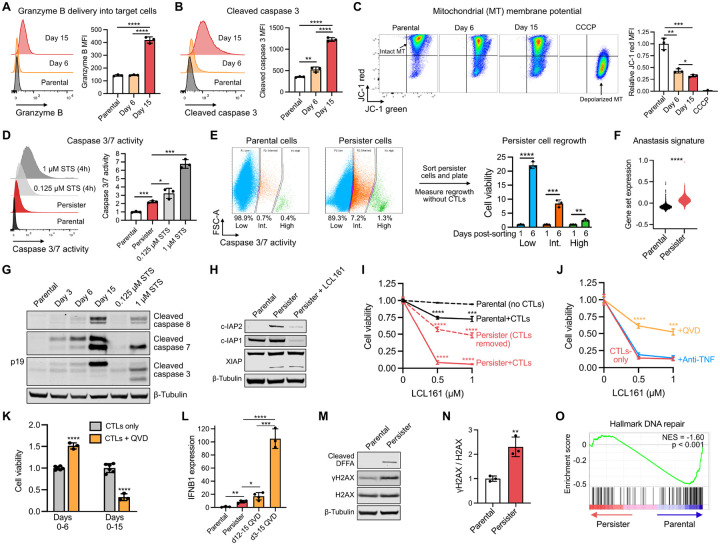
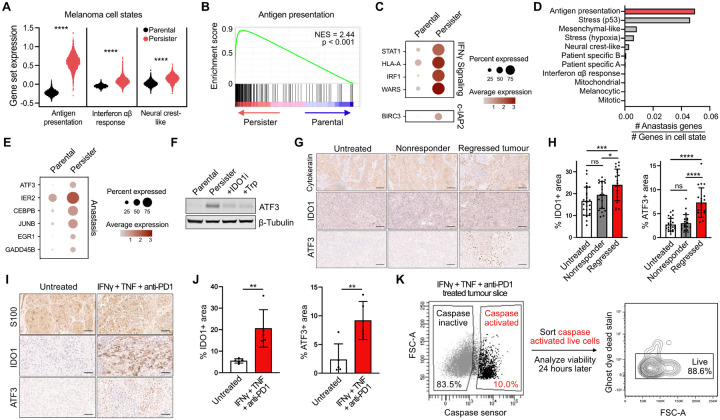
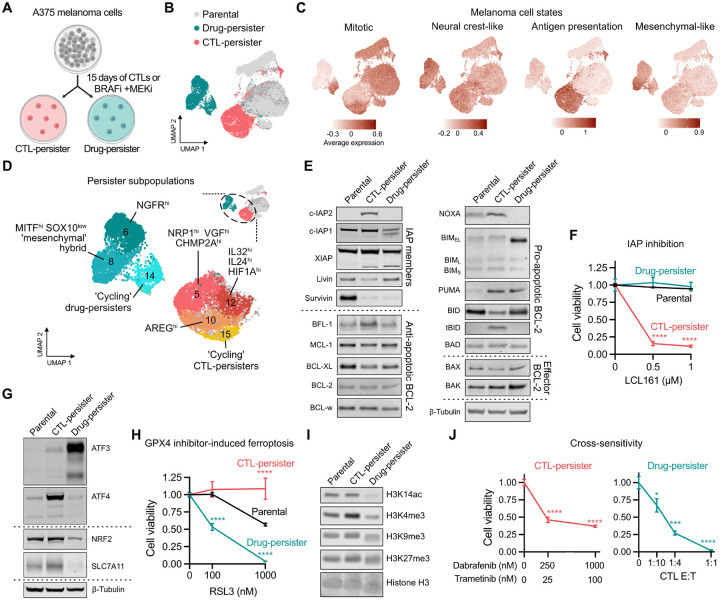
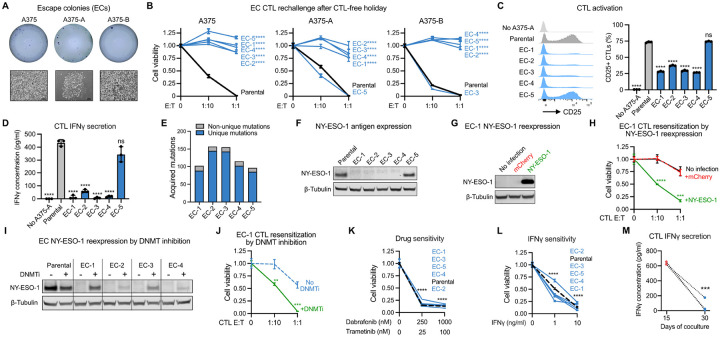
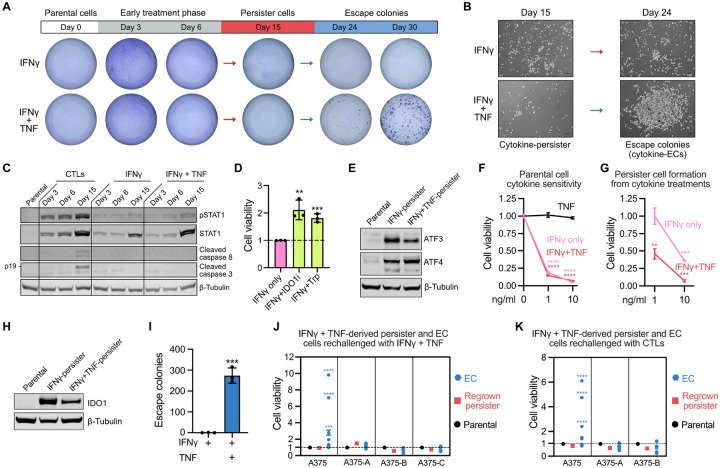
Drug-tolerant persister cancer cells were first reported fifteen years ago as a quiescent, reversible cell state which tolerates unattenuated cytotoxic drug stress. It remains unknown whether a similar phenomenon contributes to immune evasion. Here we report a persister state which survives weeks of direct cytotoxic T lymphocyte (CTL) attack. In contrast to previously known immune evasion mechanisms that avoid immune attack, antigenic persister cells robustly activate CTLs which deliver Granzyme B, secrete IFNγ, and induce tryptophan starvation resulting in apoptosis initiation. Instead of dying, persister cells paradoxically leverage apoptotic caspase activity to avoid inflammatory death. Furthermore, persister cells acquire mutations and epigenetic changes which enable outgrowth of CTL-resistant cells. Persister cell features are enriched in inflamed tumors which regressed during immunotherapy in vivo and in surgically resected human melanoma tissue under immune stress ex vivo. These findings reveal a persister cell state which is a barrier to immune-mediated tumor clearance.


Conflict of interest statement

M.J.H. is a cofounder, consultant, and research funding recipient of BridgeBio subsidiary Ferro Therapeutics.

Figures

Figure 1.
Figure 1.. Antigenic persister cells survive weeks of activated CTL exposure.
(A) Long term CTL coculture model. (B) A375 cells during NY-ESO-1 CTLlow coculture. Escape colonies are analyzed in Figure 5. Scale bars, 100 μm. (C-F) UMAP plot of parental and persister cell scRNA-seq (C), proliferation marker MKI67 (D), and cell cycle stage analysis (E) in A375 scRNA-seq data. (F) Human melanoma tumor ‘mitotic’ signature in A375 cells (Mann-Whitney test). (G) A375 bulk and clonally derived A375-A and A375-B parental and persister cells allowed to regrow for one month without CTLs prior to rechallenge with NY-ESO-1 CTLlow coculture for 6 days. (H) Western blot of NY-ESO-1 expression in A375 cells. (I) Expression of HLA-A mRNA in scRNA-seq (left) and flow cytometry of cell surface HLA-A expression (right) in A375 cells (mean fluorescence intensity (MFI). (J) Flow cytometry analysis of CTL activation marker CD25 on CTLs cultured alone, with A375 parental cells for 3 days or persister cells for days 12–15 of coculture (t-tests versus CTLs cultured alone). (K) Measurement of secreted IFNγ concentrations in media collected during CTLlow coculture with A375 cells (L) Western blot of IFNγ-signaling nodes within A375 cells during CTLlow coculture. (M) A375 persister cell viability after 15 days of CTLlow coculture with treatments added on days 9–15 (CTLs-only n = 9, all other conditions n = 3); neutralizing anti-IFNγ antibody (1 μg/mL), JAK inhibitor (1 μM ruxolitinib), anti-PD-1 antibody (10 μg/mL pembrolizumab), IDO1 inhibitor (2 μM epacadostat), tryptophan (100 μg/mL). N = 3, mean ± SD are plotted, and two-tailed unpaired t-tests were performed unless stated otherwise. *P < 0.05; **P < 0.01; ***P < 0.001; ****P < 0.0001. See also Figures S1 and S2.
Figure 2.
Figure 2.. Persister cells survive CTL attack-induced apoptotic signaling.
(A-O) Analysis of A375 cell CTLlow coculture. (A-C) Flow cytometry analyses of (A) granzyme B, (B) cleaved caspase 3 and (C) loss of mitochondrial (MT) polarity. (D) Flow cytometry of caspase 3/7 activity. (E) Cell viability of persister cells sorted for caspase 3/7 activity level and regrown without CTLs. (F) ScRNA-seq anastasis gene set signature score (Mann-Whitney test). (G-H) Western blots of (G) caspase cleavage and (H) IAPs including treatment with SMAC mimetic LCL161 (1 μM) for 15 hours. (I) Cell viability after LCL161 treatment in parental (3 days) or persister cells (days 12–15 of coculture) (t-tests versus parental). CTLs were absent or removed during LCL161 treatment where indicated. (J) A375 persister cells treated from days 12–15 with CTLs + LCL161 ± caspase inhibitor QVD (10 μM) or neutralizing TNF antibody (1 μg/mL) (t-tests versus CTLs-only). (K) Cell viability following treatment with CTLs ± 10 μM QVD (n = 6 for CTLs only, n = 3 for QVD, t-tests versus CTLs only). (L) IFNB1 mRNA expression (qRT-PCR) in parental cells, and in persister cells ± days 12–15 or 3–15 QVD co-treatment (n = 3–4). (M) Western blot of DFFA cleavage and DNA damage (γH2AX) and (N) quantification of γH2AX western blot signal. (O) Hallmark ‘DNA repair’ GSEA of differentially expressed genes in scRNA-seq data. N = 3, mean ± SD are plotted, and two-tailed unpaired t-tests were performed unless stated otherwise. *P < 0.05; **P < 0.01; ***P < 0.001; ****P < 0.0001. See also Figures S2 and S4.
Figure 3.
Figure 3.. Persister cell features are enriched in immunotherapy-treated human and mouse tumors.
A375 parental and CTL-tolerant persister cell scRNA-seq analysis of (A) signature scores of melanoma cell states observed in patients (Mann-Whitney test), (B) GSEA of the antigen presentation melanoma cell state and (C) expression of selected antigen presentation cell state genes. (D) Proportion of genes in each melanoma cell state which are anastasis-associated genes and (E) A375 cell scRNA-seq expression of selected anastasis-associated genes. (F) ATF3 expression in A375 persisters ± 2 μM IDO1 inhibitor epacadostat or 100 μg/mL tryptophan supplementation added during coculture days 12–15. (G-H) IHC analysis of 4MOSC1 head and neck squamous cell carcinoma syngeneic tumors from mice treated with 10 mg/kg anti-PD-1. (G) Representative IHC images and (H) quantification (n = 4–5 mice, 5 regions were analyzed per tumor). Scale bars, 50 μm. (I-K) Analysis of surgically resected primary human cutaneous melanoma tissue treated with 10 μg/mL anti-PD-1, 10 ng/mL IFNγ, and 10 ng/mL TNF for 6 days in culture. (I) Representative IHC images and (J) quantification (n = 1, five regions were analyzed per tumor slice). Scale bars, 50 μm. (K) Treated primary melanoma cells with elevated caspase 3/7 activity were sorted, replated, and tested for viability 24 hours later by flow cytometry (n = 1). Mean ± SD are plotted and two-tailed unpaired t-tests were performed unless stated otherwise. ns P > 0.05; *P < 0.05; **P < 0.01; ***P < 0.001; ****P < 0.0001. See also Figure S5.
Figure 4.
Figure 4.. Cancer cells enter distinct persister states to survive CTL attack or drug stress.
(A) Schematic of derivation of A375 persister cells that survive 15 days of NY-ESO-1 CTLlow coculture or 250 nM dabrafenib (BRAFi) and 25 nM trametinib (MEKi) treatment. (B) UMAP plot of A375 scRNA-seq. Dark and light grey are parental cells which were used for CTL and drug treatments, respectively. (C) UMAP plots highlighting expression of selected melanoma cell states. (D) UMAP plot subpopulations within drug-and CTL-persister populations. (E) Western blot analysis of IAP and BCL-2 family members. (F) Persister cell viability after 3 days of LCL161 treatment (n = 3, t-tests versus parental). (G) Western blot analysis of stress response and anti-ferroptosis factors. (H) Persister cell viability after 1 day of GPX4 inhibitor RSL3 treatment (n = 3–6, t-tests versus parental). (I) Western blot analysis of chromatin modifications in CTL- and drug-persisters. (J) CTL-persister viability after 3 day treatment with dabrafenib and trametinib (left) and drug-persister viability after 3 day coculture with CTLs (right). Initial CTL or drug exposure to derive persister cells was maintained during subsequent cotreatments. E:T is based on initially plated cell count prior to any treatment. (n = 3, t-tests versus untreated cells). Mean ± SD are plotted, and two-tailed unpaired t-tests were performed unless stated otherwise. *P < 0.05; **P < 0.01; ***P < 0.001; ****P < 0.0001. See also Figures S6 and S7.
Figure 5.
Figure 5.. Heterogeneous escape colonies regrow from persister cells during CTL coculture.
(A) ECs formed from bulk A375 and clonally derived A375-A and A375-B cell populations during 1 month of NY-ESO-1 CTLlow coculture. Scale bars, 100 μm. (B) ECs allowed to regrow without CTLs for one month before rechallenge with NY-ESO-1 CTLlow for 6 days (****P for both E:Ts versus parental). (C-M) A375-A cells and ECs previously regrown without CTLs were used unless otherwise stated. (C) Flow cytometry analysis of the activation marker CD25 on CTLs after 3 days of coculture (t-tests versus parental). (D) Soluble IFNγ after 3 days of CTL coculture (t-tests versus parental). (E) Acquired mutations identified within ECs. (F) Western blot of NY-ESO-1 expression in ECs and (G) EC-1 cells transduced to reexpress NY-ESO-1 or mCherry negative control. (H) Viability of NY-ESO-1 reexpressing EC-1 cells after 3 days of CTL coculture (t-tests versus no infection). (I) Western blot of antigen-loss ECs treated with the DNMT inhibitor (DNMTi) decitabine to reexpress NY-ESO-1 (1 μM, refreshed every day for 3 days). (J) EC-1 cell viability with 1 day pretreatment with 1 μM decitabine (DNMTi) followed by rechallenge with 3 days of NY-ESO-1 CTL coculture (t-tests versus no DNMTi treatment). (K) EC cell viability after 3 days of dabrafenib and trametinib treatment (****P for all cell lines and drug concentrations versus untreated cells) and (L) after 6 days of recombinant IFNγ exposure (n = 6 parental, n = 3 per EC, ****P for all cell lines and IFNγ concentrations versus untreated cells). (M) Soluble IFNγ in media collected at days 15 and 30 of A375-A CTLlow coculture. N = 3, mean ± SD are plotted, and two-tailed unpaired t-tests were performed unless stated otherwise. ns P > 0.05; *P < 0.05; **P < 0.01; ***P < 0.001; ****P ≤ 0.0002. See also Figure S8.
Figure 6.
Figure 6.. Cancer persistence against effector cytokines.
(A) Representative crystal violet staining and (B) microscopy depicting A375-A cells during one month of recombinant IFNγ ± TNF exposure (1 ng/ml each). Scalebars, 100 μm. (C) Western blot of A375 persister cells which survived 15 days of CTLlow coculture or recombinant IFNγ ± TNF (1 ng/ml each) exposure. (D) A375 IFNγ-tolerant persister cells derived from 12 days of IFNγ exposure (1 ng/ml) were further treated from days 12–15 with IDO1 inhibitor (+IDO1i, 2 μM epacadostat) or tryptophan supplementation (+Trp, 100 μg/mL) with continued IFNγ exposure (t-tests versus IFNγ-only). (E) Western blot of ATF3 and ATF4 expression in A375 cytokine-persisters. (F) A375 parental cell viability after 6 days of cytokine treatment (t-tests versus untreated cells). (G) A375 cell viability after 15 days of recombinant IFNγ ± TNF exposure to form persister cells (t-tests versus 1 ng/ml IFNγ). (H) Western blot of IDO1 expression in A375 cytokine-persisters. (I) Quantification of A375-A EC formation after one month of IFNγ ± TNF exposure (1 ng/ml each). (J) Viability of A375 IFNγ + TNF-tolerant persister and EC cells regrown without cytokines and then rechallenged with 9 days of IFNγ + TNF exposure (1 ng/ml each) or (K) 6 days of CTL coculture (t-tests versus parental). The three cytokine-resistant ECs isolated from IFNγ ± TNF exposure of bulk A375 cells shown in J are the same ECs which are cross-resistant to CTLlow exposure shown in K. N = 3, mean ± SD are plotted, and two-tailed unpaired t-tests were performed unless stated otherwise. *P < 0.05; **P < 0.01; ***P < 0.001; ****P < 0.0001. See also Figure S9.

Similar articles

References

    1. Bigger J. W. Treatment of Staphyloeoeeal Infections with Penicillin by Intermittent Sterilisation. Lancet 497–500 (1944).
    1. Sharma S. V. et al. A chromatin-mediated reversible drug tolerant state in cancer cell subpopulations. Cell 141, 69–80 (2010). - PMC - PubMed
    1. Shen S., Vagner S. & Robert C. Persistent Cancer Cells: The Deadly Survivors. Cell 183, 860–874 (2020). - PubMed
    1. Kalkavan H. et al. Sublethal cytochrome c release generates drug-tolerant persister cells. Cell 185, 3356–3374.e22 (2022). - PMC - PubMed
    1. Russo M. et al. Adaptive mutability of colorectal cancers in response to targeted therapies. Science 366, 1473–1480 (2019). - PubMed

Publication types

LinkOut - more resources