[Preprint]. 2025 Mar 17:2025.03.14.642821.
doi: 10.1101/2025.03.14.642821.

Spatial patterning of fibroblast TGFβ signaling underlies treatment resistance in rheumatoid arthritis

Affiliations

Spatial patterning of fibroblast TGFβ signaling underlies treatment resistance in rheumatoid arthritis

Kartik Bhamidipati et al. bioRxiv. .

Abstract

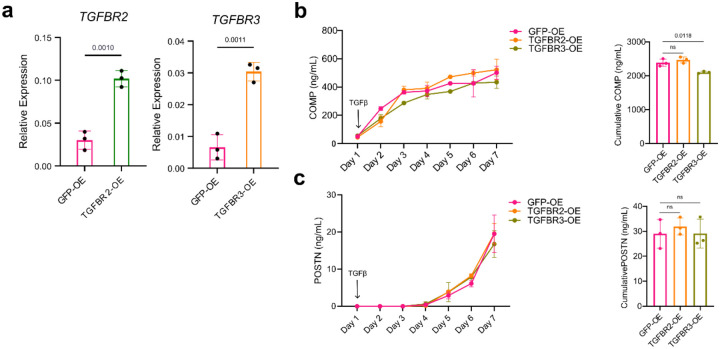
Treatment-refractory rheumatoid arthritis (RA) is a major unmet need, and the mechanisms driving treatment resistance are poorly understood. To identify molecular determinants of RA non-remission, we performed spatial transcriptomic profiling on pre- and post-treatment synovial tissue biopsies from treatment naïve patients who received conventional DMARDs or adalimumab for 6 months. In the baseline biopsies of non-remission patients, we identified significant expansion of fibrogenic fibroblasts marked by high expression of COMP, a fibrosis-associated extracellular matrix protein. COMPhi fibroblasts localized to perivascular niches that, unexpectedly, served as transcriptional hubs for TGFβ activity. We identified endothelial-derived Notch signaling as an upstream regulator of fibroblast TGFβ signaling via its dual role in driving TGFβ isoform expression and suppressing TGFβ receptors, generating a proximal-distal gradient of TGFβ activity. Further, disruption of steady-state Notch signaling in vitro enabled fibrogenic fibroblast activation. Analysis of post-treatment biopsies revealed marked expansion of COMPhi fibroblasts in non-remission RA patients, despite evidence of successful immune cell depletion, suggesting a spatiotemporal process of fibrogenic remodeling linked to treatment resistance. Collectively, our data implicates targeting of TGFβ signaling to prevent exuberant synovial tissue fibrosis as a potential therapeutic strategy for refractory RA.


Figures

Extended Data Figure 1.
Extended Data Figure 1.. Cell and niche analysis of pre-treatment RA synovium
a, UMAPs showing labelled niches (above) and niche marker genes (below). Each point represents a single niche. b, UMAPs showing labelled cell types (above) and cell type marker genes (below). Each point represents a single cell. c, Stacked bar plot summarizing cell type proportion in pre- and post-treatment samples for 17 patients. d, Correlations between the percent area of each sample occupied by the fibroblast-rich versus vascular or lining niches. e, The percent area of each sample occupied by immuneT and immuneP niches by pathotype. f, Dot plot representing the tissue area of niche in baseline biopsies by remission status. g, Violin plot representing the distribution of non-response scores per cell type. h, UMAP displaying markers for different fibroblast subtypes labelled in Figure 1h. i, Violin plot representing the distribution of non-response scores per fibroblast subtype.
Extended Data Figure 2.
Extended Data Figure 2.. Analysis of fibrogenic program in RA synovium.
a, UMAP projection of single cells from IPF and SSc datasets grouped by disease status (refs.,) and a corresponding dotplot of genes (n = 10) that comprise the fibrogenic gene signature. Dot plot color represents the scaled expression of genes, and the size of the dots represent the percent of cells expressing the gene. Violin plot displays the fibrogenic signature score, as calculated with UCell, in disease versus control samples. Wilcoxon test was used for statistical comparisons between the groups. b, Dot plot representing normalized transcript detection of DKK3, FMOD, and POSTN from pre-treatment spatial transcriptomics data by response status. c, Correlation between the percent of fibroblasts that express COMP (count > 0) per sample and abundance of endothelial and mural cells as a percent of total cells in the same sample. Left: 4 samples analyzed with a 50-gene custom panel. Right: 16 samples analyzed with a 5,101-gene panel. d, Heatmap representing spatial density correlations between fibrogenic and cell type marker genes (mean across 4 samples in the 50-gene custom panel). e, Examples of TGFB ligand transcript expression patterns in 50-gene custom panel, with cell type and subtype marker genes shown on the left for the same site. Scale bar indicates 50 μm. f, Representative immunofluorescence images showing pSMAD3 staining in CD45- cells in a NOTCH3+ perivascular region. Scale bars indicate 200 μm.
Extended Data Figure 3.
Extended Data Figure 3.. Micromass and ChIP-Seq analysis.
a, UMAP projection and dotplots of micromass organoid data representing COMP and POSTN expression. b-c, Chip-seq analysis of RBPJ binding to TGFBR2 and TGFBR3 promoter regions in HepG2 cells (data from ENCSR596FEL). Significant peaks are annotated with blue bars and were called using the narrowPeak function in MACS2.
Extended data Figure 4.
Extended data Figure 4.. Lentiviral overexpression of TGFBR2 and TGFBR3.
a, RT-qPCR analysis of TGFBR2 and TGFBR3 expression in TGFBR2-overexpressing or TGFBR3-overexpressing fibroblasts respectively, compared to control GFP-overexpressing fibroblasts. b-c, ELISA quantification of COMP and POSTN production from GFP-OE, TGFBR2-OE or TGFBR3-OE stimulated continuously with recombinant TGFβ1 (10 ng ml−1) stimulation. The bar plots to the right represent the area under the curve. For all comparisons, two tailed student’s t-test was used, data represents n = 3 biological replicates, are shown as mean +/− s.d. and data are representative of at least two independent experiments.
Extended Data Figure 5.
Extended Data Figure 5.. Validation of DLL4 knockdown and correlation of Notch activation score with vascular niche transcripts.
a, Representative RNAscope image showing DLL4 expression in siControl and siDLL4-treated co-culture. Scale bar indicates 2mm. b, Mean Pearson correlation (R) between Notch activation score and transcripts detected per vascular niche for each pre-treatment sample(n = 16). ACTA2 represents a positive control for expected correlation with Notch signaling.
Extended Data Figure 6.
Extended Data Figure 6.. Pre- and post-treatment immune cell abundance and fibrogenic signature by CTAP
a, Quantification of the relative abundance of immune cell types pre- and post-treatment, separated by treatment type. b, Violin plot representing the distribution of fibrogenic gene signature score and COMP expression of synovial fibroblasts from each CTAP. Wilcoxon test was used for comparison between groups. c, Volcano plot of differentially abundant serum proteins in CTAP-EFM patients compared to patients assigned to other CTAPs with selected genes highlighted. P-values are unadjusted and were calculated using the limma package.
Figure 1.
Figure 1.. Identification of fibroblastic and immune niches in the treatment-naïve RA synovium.
a, Schematic representing an overview of the study. b, Visualization of niches in a single synovial biopsy. Representative examples for each individual niche type with component cell types labelled are shown below with corresponding DAPI and H&E images. Scale bar indicates 50 μm. c, Heatmap representing the abundance of tissue niches, by tissue area, in each treatment naïve biopsy and the associated clinical metadata. Baseline DAS and ΔDAS represent the DAS28 ESR pre-treatment and the change at 6-months, respectively. d, Stacked bar plot representing the proportion of cell types per niche. e, Correlation plot showing the relationship between relative area of immune niches (immuneT and immuneP) and the total area of fibroblast-rich niches per sample. f, Volcano plot representing differentially expressed genes in non-responders versus responder from bulk RNA-sequencing analysis of synovial tissue derived from treatment naïve patients. Selected genes, including those in the non-responder gene set, are highlighted. g, Violin plot representing the distribution of non-response scores per niche type, with the number of niches analyzed indicated. Statistical comparison by two-sided Mann-Whitney U comparing a down-sampled selection of non-response scores in 500 niches from each niche type to a random selection of scores from 500 other niches. Horizontal line represents the median non-response score across all niches analyzed. h, Uniform Manifold Approximation and Projection (UMAP) plot of fibroblasts annotated by subtype, and stacked bar plot representing the proportion of each subtype within the fibroblast compartment of each niche.
Figure 2.
Figure 2.. COMP and POSTN define spatially segregated fibrogenic subsets that co-localize with TGFβ activity.
a, UMAP projection of synovial fibroblasts with cluster annotations (ref.) and projection of the fibrogenic gene signature score onto the UMAP as calculated by UCell. Fibroblasts with signature scores in the top 10% (>0.6713282) are colored. b, UMAP projection of subsetted and re-clustered fibroblasts that had fibrogenic signature scores in the top decile. Dotplot of selected genes differentially expressed across clusters with the color representing scaled expression and size of the dot representing percent of cells expressing the gene. Non-fibrogenic refers fibroblasts from the full synovial dataset that had fibrogenic signature scores in the bottom 90 percentile. c, Violin plot displaying the distribution of the non-responder signatures (n = 290 genes) in COMPhi and POSTNhi cells, as calculated by Ucell. Wilcoxon test was used for statistical comparisons between the groups. d, Quantification of normalized COMP transcript expression in baseline non-remission and remission biopsies, with representative images of COMP transcript expression. Scale bar indicates 2 mm e, Visualization of kernel density estimates showing correlation between POSTN and COMP expression within a representative COL1A1-high region. f, Heatmap showing mean pixel correlations across synovial samples (n = 4) between kernel densities for selected fibrogenic genes within COL1A1-high regions. g, Representative examples of COMP transcript expression in perivascular and pauci-cellular regions. Scale bar indicates 50 μm. h, Mean pixel correlations across samples (n = 4) for TGFB isoform expression compared to selected fibroblast and endothelial markers. i, Heatmap representing relative expression of TGFB isoforms across different cell types synovial samples (n = 17) analyzed with a 5101-gene panel. j, Example of data in (i) showing TGFB transcripts overlaid on cell types. Scale bar indicates 50 μm. k, Immunofluorescence staining of RA synovial tissue showing protein expression of TGFβ isoforms relative to endothelial cell marker VWF. TGFβ3 and VWF staining were on serial sections. l, IF data showing NOTCH3, Collagen 1, and pSMAD3 staining in perivascular and pauci-cellular regions of the RA synovium. Scale bars are 200 μm.
Figure 3.
Figure 3.. Endothelial cells generate a proximal to distal gene expression pattern in surrounding fibroblasts.
a, Representative visualization of spatially profiled co-culture with transcripts for fibroblast marker, PDGFRB, and endothelial marker, PECAM1, overlaid on DAPI. Scale bar indicates 200 μm. b, Schematic summarizing the spatial distribution of fibroblast transcripts based on endothelial cell proximity. c,f,j,m, Example images of gene expression distribution overlaid on labelled cell types, to a maximum of randomly selected 1500 transcripts per gene, with Notch target genes shown in (c), fibrogenic markers in (f), TGFB ligands in (j), and TGFB receptors in (m). d,g,k,n, Line plot representing average expression of transcripts per fibroblast relative to the EC distance, with Notch target genes shown in (d), fibrogenic markers in (g), TGFB ligands in (k), and TGFB receptors in (n). Solid line shows mean, shaded regions show one standard deviation. e,h,l,o, Distance to the nearest EC in the top vs. bottom quantile of cells by expression of each gene, with Notch target genes shown in (e), fibrogenic markers in (h), TGFB ligands in (l), and TGFB receptors in (o). i, Heatmap representing expression of TGFB ligands and receptors by cell type in the co-culture.
Figure 4.
Figure 4.. Notch signaling controls TGFβ isoform and receptor expression in synovial fibroblasts.
a-b, Schematic of experimental workflow and UMAP plot of isolated single cells from the indicated micromass organoid conditions (ref). Fibroblast Monoculture: organoid containing fibroblasts only; Fibroblasts + ECs: organoids containing fibroblasts and ECs; Fibroblasts + ECs + DAPT: organoids containing fibroblasts and ECs treated with a NOTCH inhibitor. c, UMAP plot of cells from organoid culture shaded by level of fibrogenic gene signature score as calculated with UCell. d, Heatmap of selected genes grouped by experimental condition. e-f, RT-qPCR analysis of TGFB isoform and receptor gene expression on unstimulated or DLL4 stimulated fibroblasts treated with or without DAPT (10 uM) for 72 hours. g-h, Immunoblots of TGFβ isoforms and receptors with lysates from unstimulated or DLL4 stimulated fibroblasts (72h). i, RT-qPCR analysis of COL1A1, COL3A1 and COL6A1 gene expression on unstimulated or DLL4 stimulated fibroblasts treated with or without TGFβ inhibitor (SB431542; 10 uM) or DAPT (10 uM) for 72h. j, ELISA quantification of fibroblast production of pro-collagen I alpha 1 over 24h after 5 days of treatment with siRNA (20nM) during or without DLL4 stimulation. k-l, RT-qPCR and ELISA quantification of POSTN (k) and COMP (l) after 72 hours of stimulation with recombinant TGFβ1 (10 ng ml−1) (left) or with DLL4 stimulation and siRNA targeting of TGFBR2 (right). For e,f,i each data point represents an independent cell line (n = 6) and for j-l each data point represents biological replicates (n = 3) from a single cell line and are representative of at least two independent experiments. Data are shown as mean +/− s.d. Statistical analysis was performed by a two-sided ratio paired t-test for e, f, i and unpaired two-sided Student’s t-test for j-l.
Figure 5.
Figure 5.. Endothelial-derived Notch signaling dictates fibroblast TGFβ responsiveness via regulation of TGFβ receptor III.
a-d, A fixed number of fibroblasts were seeded with varying numbers of HUVECs. Monoculture: 5,000 fibroblasts, 5:1 ratio: 5,000 fibroblasts and 1,000 HUVECs, 2:1 ratio: 5,000 fibroblasts and 2,500 HUVECs, 1:1 ratio: 5,000 fibroblasts and 5,000 HUVECs. a-b, ELISA quantification of POSTN (a) and COMP (b) production over the course of co-culture. P-values in the line graph are displayed for the comparisons between monoculture and 1:1 ratio. The respective bar charts to the right represent the area under the curve. c-d, Flow cytometric quantification of fibroblast TGFβRII (c) and TGFβRIII (d) at the indicated days during co-culture with endothelial cells. P-values are shown for comparisons between monoculture and 1:1 ratio. Representative flow cytometry histograms and MFI quantification for day 7 of co-culture are shown. e, Gating strategy for classifying COMPhi and POSTNhi fibroblasts from the Xenium-profiled co-culture (mutually exclusive top quantile of cells expressing each gene, with POSTN ≤ 3.5 for COMPhi in this experiment). f, Representative examples of COMPhi and POSTNhi fibroblasts are shown with transcripts. g, Violin plot showing the distribution of TGFBR2 and TGFBR3 transcripts on POSTNhi and COMPhi gated fibroblasts in co-culture. h, Violin plot showing the distribution of TGFBR2 and TGFBR3 transcript expression in gated POSTNhi and COMPhi fibroblasts in synovial tissue. i, Representative example of gated (mutually exclusive top quantiles of expressing cells) COMPhi and POSTNhi synovial fibroblasts with transcr. j-k, ELISA quantification of COMP and POSTN production from co-culture of fibroblasts over-expressing (OE) GFP, TGFBR2 or TGFBR3 with endothelial cells in a 1:1 ratio. P-values are shown for the comparison between TGFBR3-OE and GFP-OE data points. The bar plot on the right represents the area under the curve. For a-d,j-k, Data points are shown as mean +/− s.d., represent n =3 biological replicates, and are representative of at least two independent experiments. For statistical analysis, two-tailed student’s t-test was used for a-d, j-k and two-sided Mann-Whitney U test was used for f-i.
Figure 6.
Figure 6.. Disruption of steady-state Notch patterning activates a COMPhi fibrogenic program.
a-b, ELISA quantification of POSTN (a) and COMP (b) production from fibroblasts and endothelial cell co-culture (1:1 ratio) treated with the indicated siRNAs (20 nM). P-values are shown for the comparison between DLL4 siRNA and control siRNA conditions. The bar plots to the right represent the area under the curve. c-n, RNAscope quantification of fibrogenic program in response to Notch perturbation. Representative images of siControl-treated and siDLL4-treated co-cultures are shown for the indicated genes with PECAM1 and DLL4 as endothelial markers; scale bar indicates 200 μm. d,f,h,j,l,n, Boxen plots represent the distribution of mean fluorescent intensities of the corresponding genes in siControl and siDLL4 conditions on the indicated number of cells selected for quantification. d,f,l,n Ribbon plots showing spatial gene expression patterns in relation to EC proximity for indicated genes between siRNA conditions. Solid line shows mean, shaded regions show one standard deviation. d,f Violin plots showing the distance to the nearest EC (in μm) for POSTNhi and COMPhi cells, defined as cells with the highest quantile of POSTN and COMP fluorescence intensity respectively. The data in a-b are shown as means ± s.d. and, represent n = 3 biological replicates and are representative of at least two independent experiments. A two-tailed unpaired student’s t-test was performed for a,b and two-tailed unpaired Mann-Whitney U tests for d,f,h,g,l,n.
Figure 7.
Figure 7.. Spatiotemporal evolution of the COMPhi fibrogenic program pre- and post-treatment.
a, Representative pre- and post-treatment gene expression from patients in remission (patient 10) or non-remission (patient 5) at 6 months. MZB1 marks plasma cells, CD3E T cells and MS4A1 B cells; scale bar indicates 2 mm. b, Quantification of the relative abundance of immune cell types pre- and post-treatment. Line colors indicate remission status. Patient 5 is highlighted in magenta, and Patient 10 is highlighted in yellow. c, Representative examples of COMP transcript expression in pre- and post-treatment synovial biopsies for remission and non-remission. d, Percent of fibroblasts expressing COMP per patient, pre- and post-treatment, separated by treatment type. e, Representative COMP gene expression and paired H&E for a pre- and post-treatment biopsy from a non-remission patient. VWF marks vasculature; scale bar indicates 50 uM. f, Cell density of COMPhi regions of the synovium (defined by kernel density estimate) per patient, pre- and post-treatment. g, Correlation between changes in the percent of fibroblasts that express COMP and the cell density of COMPhi regions per patient after 6 months of treatment. h, Violin plot representing the distribution of disease duration in RA patients classified as CTAP-EFM (n = 7) versus RA patients classified as other CTAPs (n = 63) and a violin plot representing the distribution of fibrogenic score, as calculated with UCell, of synovial fibroblasts from CTAP-EFM patients compared to fibroblasts from RA patients classified as other CTAPs. P-value was calculated with two-sided Mann Whitney U test for RA duration and a two-sided Wilcoxon test was used for comparison of fibrogenic score between groups. i, Bar plot of selected serum proteins that are differentially abundant in RA patients classified as CTAP-EFM compared to RA patients classified as other CTAPs. The height of the bar represents the log-fold change, and the shading of the bar represents unadjusted p-values.

References

    1. Gravallese E. M. & Firestein G. S. Rheumatoid Arthritis - Common Origins, Divergent Mechanisms. N Engl J Med 388, 529–542 (2023). - PubMed
    1. Smolen J. S., Aletaha D. & McInnes I. B. Rheumatoid arthritis. Lancet 388, 2023–2038 (2016). - PubMed
    1. Nagy G. et al. EULAR definition of difficult-to-treat rheumatoid arthritis. Ann Rheum Dis 80, 31–35 (2021). - PMC - PubMed
    1. Hofman Z. L. M. et al. Difficult-to-treat rheumatoid arthritis: what have we learned and what do we still need to learn? Rheumatology (Oxford) 64, 65–73 (2025). - PMC - PubMed
    1. Chatzidionysiou K. & Sfikakis P. P. Low rates of remission with methotrexate monotherapy in rheumatoid arthritis: review of randomised controlled trials could point towards a paradigm shift. RMD Open 5, e000993 (2019). - PMC - PubMed

Publication types

LinkOut - more resources