[Preprint]. 2025 Mar 19:2025.03.18.643855.
doi: 10.1101/2025.03.18.643855.

GMCL1 Controls 53BP1 Stability and Modulates Paclitaxel Sensitivity in Cancer

Affiliations

GMCL1 Controls 53BP1 Stability and Modulates Paclitaxel Sensitivity in Cancer

Yuki Kito et al. bioRxiv. .

Abstract

The Mitotic Surveillance Pathway (MSP) monitors the duration of M-phase. Prolonged mitosis, caused by spindle attachment defects or microtubule-targeting drugs such as the taxane paclitaxel, induces the formation of the ternary "mitotic stopwatch" complex consisting of 53BP1, USP28, and p53. This event protects p53 from degradation, resulting in cell cycle arrest or apoptosis in daughter cells. In paclitaxel-resistant cancers, cells bypass the MSP, enabling unchecked proliferation and survival, although the underlying mechanisms remain unknown. Here, we demonstrate that 53BP1 physically interacts with GMCL1 but not its paralog, GMCL2, and we mapped the interaction regions on both proteins. CRL3GMCL1 functions as a ubiquitin ligase that targets 53BP1 for degradation during M phase, impacting p53 levels in daughter cells. High GMCL1 expression significantly correlates with resistance to paclitaxel in cancer cell lines with wild-type p53, including endometrial, breast, and upper aerodigestive tract cancer cells. Loss of GMCL1 restores paclitaxel sensitivity in p53 expressing cells but not in p53 deficient cells. We propose that in cancers with high GMCL1 levels, the CRL3GMCL1-mediated degradation of 53BP1 prevents the formation of the mitotic stopwatch complex, leading to p53 degradation and sustained proliferation. Finally, our results indicate that GMCL1 inhibition represents a novel strategy to restore taxane sensitivity in resistant cancers.

Keywords: 53BP1; GMCL1; mitotic stopwatch; p53; prolonged mitosis; protein degradation; ubiquitin.


Conflict of interest statement

DECLARATION OF INTERESTS MP is or has been an advisor for SEED Therapeutics, CullGen, Deargen, Kymera Therapeutics, Lumanity, Serinus Biosciences, Sibylla Biotech, Triana Biomedicines, and Umbra Therapeutics. He also has financial interests in CullGen, Kymera Therapeutics, SEED Therapeutics, Thermo Fisher Scientific, and Triana Biomedicines. The other authors declare no conflict of interest.

Figures
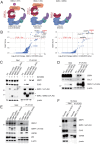
Figure 1.
Figure 1.. Identification of 53BP1 as a GMCL1 interactor
A) Schematics for the immunoprecipitation-mass spectrometry (IP-MS) workflow using wild-type GMCL1 (GMCL1 WT) and mutants (GMCL1 EK and GMCL1 BBO). Color coding: Red, GMCL1; orange, putative substrates/interacting partners; blue, CUL3; green, RBX1; purple, E2 ubiquitin-conjugating enzyme. B) HEK293T cells were transfected with FLAG-GMCL1 WT, FLAG-GMCL1 EK, or FLAG-GMCL1 BBO. After 24 hours, FLAG-tagged proteins were immunoprecipitated and analyzed by MS/MS. Left panel: proteins enriched with GMCL1 WT vs. BBO; right panel: proteins enriched withGMCL1 EK vs. BBO. Significant interactors were identified using SAINT scores > 0.70 and FDR < 5%. C) HEK293T cells transfected with empty vector (EV), FLAG-GMCL1 WT, FLAG-GMCL1 BBO, FLAG-GMCL1 WKE_AAA (broadly disrupts the binding to CUL3) and FLAG-GMCL1 EK were treated with MLN4924 (3h). 53BP1 and CUL3 were immunoprecipitated with FLAG beads and analyzed by western blot. Asterisk indicates non-specific bands. D) HEK293T cells were transfected with EV, FLAG-GMCL1 WT, FLAG-GMCL1 EK, or FLAG-GMCL1 RA. FLAG immunoprecipitations were probed for 53BP1 and CUL3. E) HEK293T cells were transfected with EV, FLAG-53BP1 WT, FLAG-53BP1 ΔMFF and FLAG-53BP1 IEDI_AAAA. After MLN4924 treatment (3h), GMCL1 was immunoprecipitated and immunoblotted. F) M phase-synchronized GMCL1 FLAG knock-in HCT116 cells were collected. GMCL1 was immunoprecipitated using FLAG-beads and analyzed by immunoblotting.
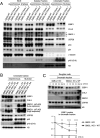
Figure 2.
Figure 2.. GMCL1 targets 53BP1 for degradation during M phase
A) Asynchronous or M phase-synchronized WT or GMCL1 knockout (KO) U2OS cells were collected. Whole-cell extracts (WCE) were prepared using RIPA buffer, and other lysates were fractionated into soluble and chromatin-bound fractions for immunoblotting. Arrow indicates GMCL1-specific bands. Asterisk indicates non-specific bands. B) Stable U2OS cell lines expressing EV, FLAG-GMCL1 WT, FLAG-GMCL1 EK, or FLAG-GMCL1 RA in a GMCL1 KO background were synchronized into M phase and fractionated for chromatin immunoblotting. C) Mitotic-synchronized FLAG-GMCL1-expressing cells were collected by shake-off and cultured in fresh FBS-containing medium for 7 h. Daughter cells were treated with CHX at the indicated time points and collected within 7 hours, fractionated into soluble and chromatin-bound fractions, and analyzed by immunoblotting.
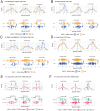
Figure 3.
Figure 3.. GMCL1 expression shows positive correlation with Taxol resistance in cancel cell lines
For each cancer type (A-D) and p53 status (E-F), two visualization methods are presented: Upper panels: Density plots show the distribution of drug responses (log2[cell viability]) to the indicated taxane. Each curve represents the frequency of cell lines exhibiting specific response values. Blue curves represent high GMCL1 expression, while orange curves show low GMCL1 expression. Vertical dashed lines indicate median response values for each group. Rightward shifts of blue curves (high GMCL1) indicate greater resistance. Lower panels: Boxplots of the same data showing median (horizontal line), interquartile range (box), and distribution range (whiskers). Higher values on the y-axis indicate greater resistance to the drug. Statistical significance is indicated (*p < 0.05; ns: not significant) using Wilcoxon rank-sum test. In panels E-F, cell lines are stratified by both GMCL1 mRNA and 53BP1 protein levels as ‘Low_High’ (low GMCL1/high 53BP1, red) or ‘High_Low’ (high GMCL1/low 53BP1, green). Note the significant differences in panels E (wild-type p53) but not in panels F (mutant p53), demonstrating that GMCL1-mediated taxane resistance requires functional p53 signaling.
Figure 4.
Figure 4.. GMCL1 deficiency sensitizes cancers with wild-type p53 to Taxol-induced apoptosis
MCF7 (A), U2OS (C), HeLa (E), HEC-1-A (G) cells were transfected with GMCL1-targeting siRNAs or non-targeting (NT) control for 72 h. Cells were treated with DMSO or Taxol for 48 h, and cell viability was assessed using the CellTiter-Glo Cell Viability Assay. Error bars represent standard deviation. Apoptosis was measured in the same conditions, i.e., MCF7 (B), U2OS (D), HeLa (F), HEC-1-A (H), using the RealTime-Glo Annexin V Apoptosis and Necrosis Assay. Error bars represent standard deviation. (I) Overview of GMCL1’s function during the M phase. In cancers with high GMCL1 levels, the CRL3GMCL1-mediated degradation of 53BP1 prevents the formation of the mitotic stopwatch complex, leading to p53 degradation and sustained proliferation. Loss of GMCL1 stabilizes mitotic 53BP1 levels and restores paclitaxel sensitivity.

References

    1. Hosea R., Hillary S., Naqvi S., Wu S., and Kasim V. (2024). The two sides of chromosomal instability: drivers and brakes in cancer. Signal Transduct Target Ther 9, 75. 10.1038/s41392-024-01767-7. - DOI - PMC - PubMed
    1. Lens S.M.A., and Medema R.H. (2019). Cytokinesis defects and cancer. Nat Rev Cancer 19, 32–45. 10.1038/s41568-018-0084-6. - DOI - PubMed
    1. Lambrus B.G., and Holland A.J. (2017). A New Mode of Mitotic Surveillance. Trends Cell Biol 27, 314–321. 10.1016/j.tcb.2017.01.004. - DOI - PMC - PubMed
    1. Contadini C., Monteonofrio L., Virdia I., Prodosmo A., Valente D., Chessa L., Musio A., Fava L.L., Rinaldo C., Di Rocco G., and Soddu S. (2019). p53 mitotic centrosome localization preserves centrosome integrity and works as sensor for the mitotic surveillance pathway. Cell Death Dis 10, 850. 10.1038/s41419-019-2076-1. - DOI - PMC - PubMed
    1. Burigotto M., Vigorito V., Gliech C., Mattivi A., Ghetti S., Bisio A., Lolli G., Holland A.J., and Fava L.L. (2023). PLK1 promotes the mitotic surveillance pathway by controlling cytosolic 53BP1 availability. EMBO Rep 24, e57234. 10.15252/embr.202357234. - DOI - PMC - PubMed

Publication types