

This is a preprint.
It has not yet been peer reviewed by a journal.
The National Library of Medicine is
running a pilot
to include preprints that result from research funded by NIH in PMC and PubMed.
[Preprint]. 2025 Mar 18:2025.03.18.643859.
doi: 10.1101/2025.03.18.643859.
Functional and structural profiling of circulation via genetically encoded modular fluorescent probes
Affiliations
- PMID: 40166224
- PMCID: PMC11956918
- DOI: 10.1101/2025.03.18.643859
Item in Clipboard
Functional and structural profiling of circulation via genetically encoded modular fluorescent probes
bioRxiv.
.
Abstract
Sustained labeling of fluids is crucial for their investigation in animal models. Here, we introduce a mouse line (Alb-mSc-ST), where blood and interstitial fluid are labeled with the red fluorescent protein mScarlet and SpyTag. The SpyTag-SpyCatcher technology is exploited to monitor circulating fluid properties by biosensors or detect blood-brain barrier disruption. This approach represents a valuable tool for studying vascular structure, permeability and microenvironment in body organs in vivo.
Conflict of interest statement
Declaration of Interests The authors declare no competing financial interests.
Figures

Alb-mSc-ST mice exhibit vascular and interstitial fluid suitable for in vivo tissue cytoarchitecture imaging. (a) Genomic map of Alb-mSc-ST knock-in locus. mScarlet and SpyTag003 were knocked into exon 14 of the albumin gene. (b) In heterozygous Alb-mSc-ST mice, Alb-mSc-ST is produced in hepatocytes secreted into liver blood vessels through fenestrations. (c) Optogenotyping of Alb-mSc-ST mice. (d) Blood samples collected from Alb-mSc-ST knock-in (KI) mice, wild-type (WT) littermates and mice injected with AAV8/P3-Alb-mScarlet 3 weeks before collection (left) and their fluorescence intensities (right) with y-axis in log10 scale (n = 4–5 mice). Unpaired t-test: ****p < 0.0001. (e) Experiment timeline. (f) Blood plasma fluorescence intensity in the first 8 weeks after birth of KI and WT littermates (n = 6–8 mice). (g) Weights of KI and WT littermates at 5 weeks of age (n = 7–19 mice per group). Mixed-effects analysis using a REML model: no significant effect of genotype (F1, 52 = 0.5178, p = 0.475). (h) Example traces of mouse trajectory (left) and total distance traveled (right) for the last 6 min of 10 min recording (n = 6–8 mice). Unpaired t-test: p = 0.5076. (i) Example images of brain slices of KI and WT littermates immunostained for microglia by Iba1. Scale bar, 100 μm. (j) Volumetric imaging of brain vasculature covering 950 μm below the pial surface of Alb-mSc-ST mouse (left) and representative images at various depth (right). Scale bar, 50 μm. (k) Cross-section of thinned skull and meninges from an Alb-mSc-ST x Prox1-EGFP+ mouse (top) and representative images of various subcranial structures (bottom). Scale bar, 50 μm. (l) Representative image of dural blood vessels (red), lymph vessels (green) and collagen fibers (blue) in an Alb-mSc-ST x Prox1-EGFP+ mouse. Scale bar, 50 μm. (m) Representative image of brain parenchyma of Alb-mSc-ST mouse with normal (left, top) and high (left, bottom) contrast adjustment, the latter displaying dark spots for cellular elements. Volumetric reconstruction with an inverted scale, visualizes the neural cytoarchitecture (right). Scale bar, 50 μm. All graphs show means ± SEM.
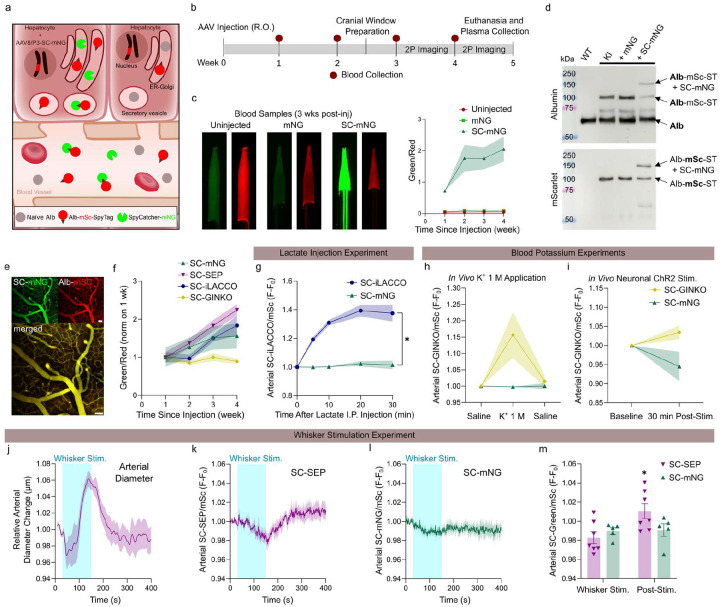
Biosensor attachment to Alb-mSc-ST enables investigation of biochemical properties of blood. (a) Expression of secretory SC-mNG in hepatocytes of Alb-mSc-ST mice leads to irreversible formation of AlbmSc-ST-SC-mNG through the SC-ST covalent bond. (b) Experiment timeline. (c) Blood samples collected 3 weeks post-injection from Alb-mSc-ST mice injected with AAV8/P3-mNG or AAV8/P3-SC-mNG or uninjected (left). Longitudinal plot of blood green/red fluorescence signal ratio for the first 4 weeks of post-injection (right) (n = 4–5 mice). Two-way ANOVA: significant effect of injection type (F2, 12 = 18.22, ***p = 0.0002). (d) Western blot for albumin (top) and mScarlet (bottom) with plasma protein samples from WT littermates and Alb-mSc-ST KI mice injected with AAV8/P3-mNG, AAV8/P3-SC-mNG, or uninjected. (e) Average intensity projection of a 100-μm z-stack showing cortical vasculature of an Alb-mSc-ST mouse injected with AAV8/P3-SC-mNG. Scale bar, 50 μm. (f) Green/red signal ratio in blood samples collected from Alb-mSc-ST mice injected with AAV8/P3-SC-mNG, AAV8/P3-SC-SEP, or AAV8/P3-SC-iLACCO for the first 4 weeks of post-injection (n = 5–7 mice). (g) Green/red signal ratios in cortical arterioles of awake Alb-mSc-ST mice injected with AAV8/P3-SC-iLACCO or AAV8/P3-SC-mNG and imaged after intraperitoneal injection of lactate (2 mg/g, n = 5–6 mice). Two-way ANOVA: significant effect of biosensor (F1, 9 = 97.89, ****p < 0.0001). (h) Green/red signal ratios in cortical arterioles of anesthetized Alb-mSc-ST mice injected with AAV8/P3-SC-GINKO or AAV8/P3-SC-mNG following application of either saline or 1 M KCl to a distantcortical site (n = 1–2 recordings from 2–3 mice). Two-way ANOVA: significant effect of applied solution x AAV type interaction (F2,8 = 4.726, p = 0.0442). (i) Green/red signal ratios in cortical arterioles of anesthetized Alb-mSc-ST mice injected with AAV8/P3-SC-GINKO or AAV8/P3-SC-mNG following optogenetically induced CSD (n = 1–2 recordings from 2–3 mice). Two-way ANOVA: no significant effect of time x AAV type interaction (F1, 3 = 5.785, p = 0.0952). (j–m) Whisker stimulation experiment in anesthetized Alb-mSc-ST mice injected with AAV8/P3-SC-mNG, AAV8/P3-SC-SEP (n = 5–7 mice). Relative diameter change of arterioles in SEP mice (j). Green/red signal ratios in cortical arterioles of SEP and mNG mice (k–l). Quantification of normalized arterial signals (green/red) during and after whisker stimulation (m). Two-way ANOVA: significant effect of stimulation x biosensor interaction (F1, 10 = 5.855, *p = 0.0361). All graphs show means ± SEM.

Extravasated Alb-mSc-ST is captured by ECS-facing SC in astrocytes through ST–SC binding. (a) Alb-mSc-ST mice injected with AAVs for astrocyte-targeted expression of ECS-facing SC are used for detecting BBB leakage, as extravasated Alb-mSc-ST will be bound by available ECS-SC at astrocytic endfeet. (b) HEK293T cells expressing either ECS-SC or degradable ECS-dSC were exposed to Alb-mSc-ST plasma and imaged 2h and 28 h post-plasma addition (top). Fluorescence intensity at 2h and 28h (bottom, left) and their ratio (bottom, right) for ECS-SC- and ECS-dSC-expressing cells, showing faster turnover of ECS-dSC. (c) Experiment timeline. (d) Example images of vessels before and after laser irradiation in naïve Alb-mSc-ST mice and Alb-mSc-ST mice expressing ECS-SC or ECS-dSC in astrocytes. Scale bar, 10 μm. (e) Example images of laser-irradiated and contralateral hemispheres in a brain slice from an Alb-mSc-ST mouse expressing astrocytic ECS-dSC (left). Scale bar, 100 μm. Quantification of the fluorescence intensity in the two hemispheres (right). Unpaired t-test: ****p < 0.0001 (n = 3 mice). (f) Entropy levels of cortex and striatum in brain slices from ECS-dSC-expressing Alb-mSc-ST mice injected with the BBB-leakage inducer mannitol or saline. Mann Whitney test: **p = 0.0022 (n = 3 mice, 4 regions each). All graphs show means ± SEM, apart for violin plots in (d, right).
References
-
- Quinlan G. J., Martin G. S. & Evans T. W. Albumin: Biochemical properties and therapeutic potential†. Hepatology 41, 1211–1219 (2005). - PubMed
Publication types
Grants and funding
LinkOut - more resources
Full Text Sources
Miscellaneous