[Preprint]. 2025 Mar 21:2025.03.20.644389.
doi: 10.1101/2025.03.20.644389.

In vivo validation of the palmitoylation cycle as a therapeutic target in NRAS-mutant cancer

Affiliations

In vivo validation of the palmitoylation cycle as a therapeutic target in NRAS-mutant cancer

Matthew Decker et al. bioRxiv. .

Abstract

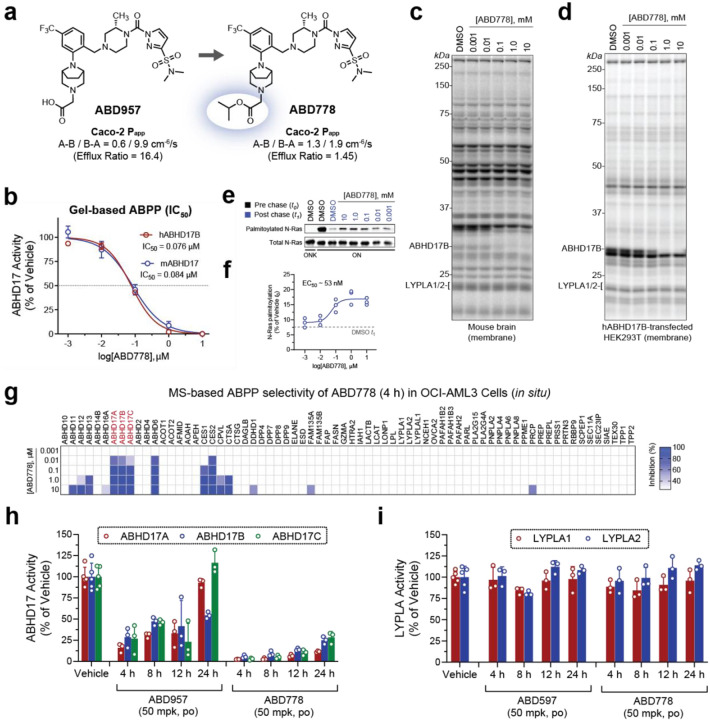
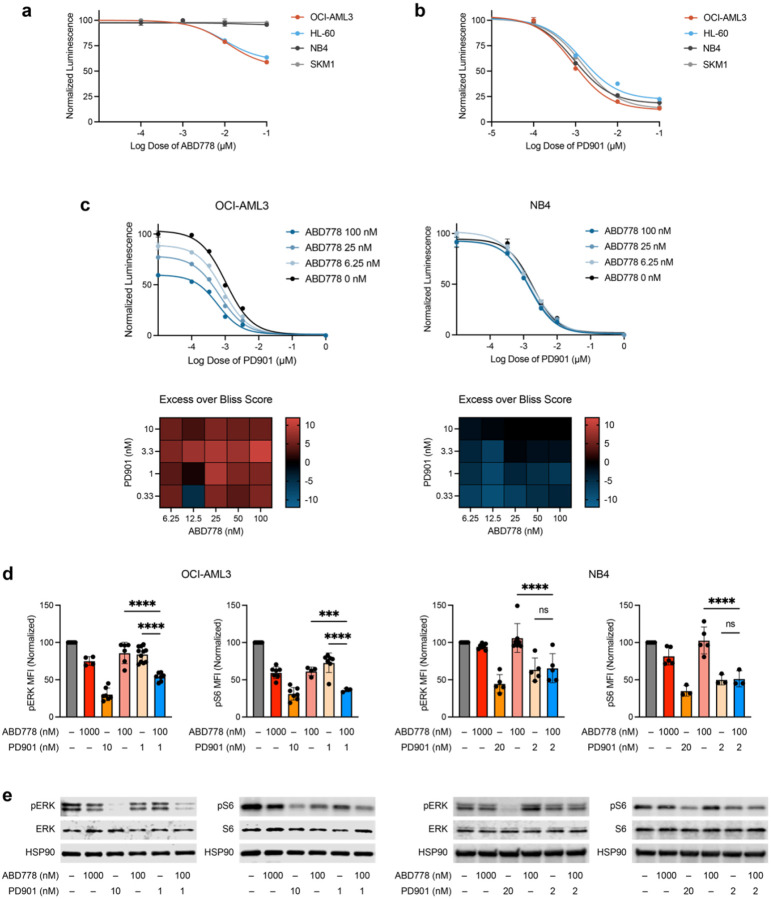
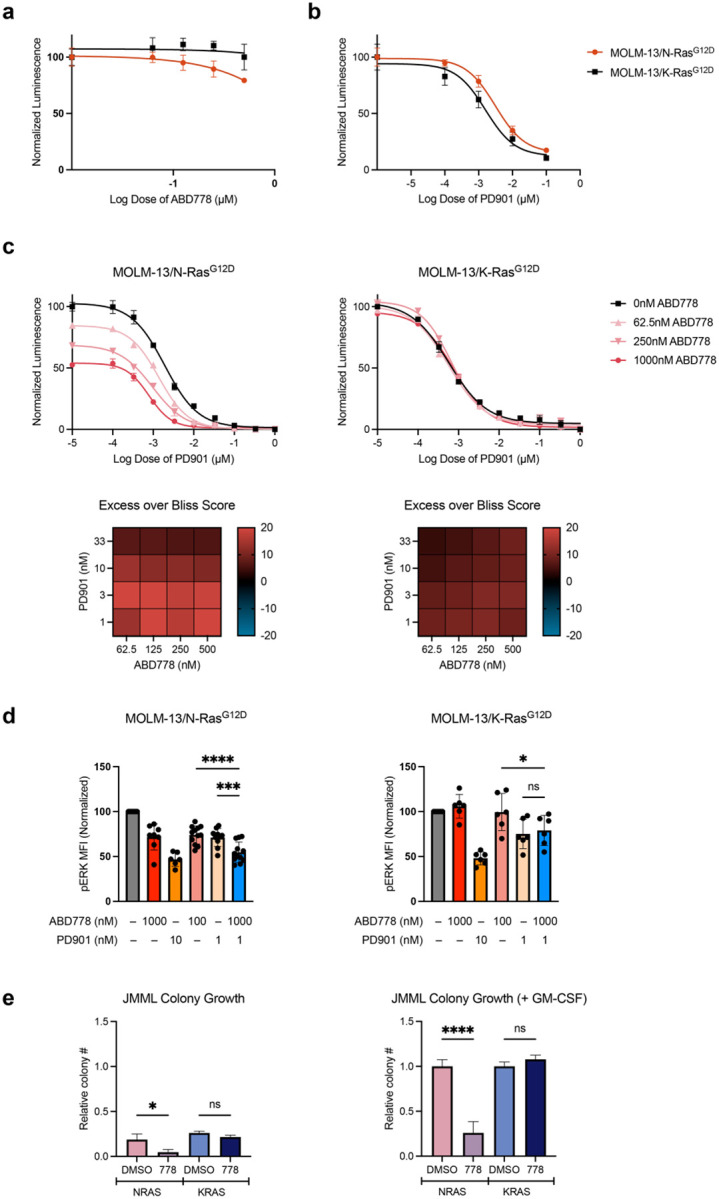
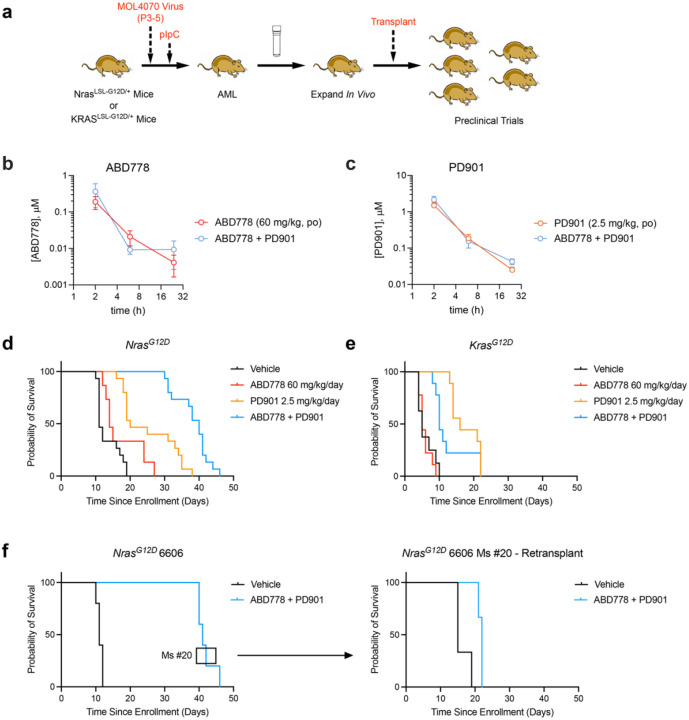
Normal and oncogenic Ras proteins are functionally dependent on one or more lipid modifications1,2. Whereas K-Ras4b farnesylation is sufficient for stable association with the plasma membrane, farnesylated H-Ras, K-Ras4a, and N-Ras traffic to the Golgi where they must undergo palmitoylation before regulated translocation to cell membranes. N-Ras palmitoylation by the DHHC family of palmitoyl acyl transferases (PATs) and depalmitoylation by ABHD17 serine hydrolases is a dynamic process that is essential for the growth of acute myeloid leukemias (AMLs) harboring oncogenic NRAS mutations3-6. Here, we have tested whether co-targeting ABHD17 enzymes and Ras signal output would cooperatively inhibit the proliferation and survival of NRAS-mutant AMLs while sparing normal tissues that retain K-Ras4b function. We show that ABD778, a potent and selective ABHD17 inhibitor with in vivo activity, selectively reduces the growth of NRAS-mutant AML cells in vitro and is synergistic with the allosteric MEK inhibitor PD0325901 (PD901)7,8. Similarly, ABD778 and PD901 significantly extended the survival of recipient mice transplanted with three independent primary mouse AMLs harboring an oncogenic Nras G12D driver mutation. Resistant leukemias that emerged during continuous drug treatment acquired by-pass mutations that confer adaptive drug resistance and increase mitogen activated protein kinase (MAPK) signal output. ABD778 augmented the anti-leukemia activity of the pan-PI3 kinase inhibitor pictilisib9, the K/N-RasG12C inhibitor sotorasib10, and the FLT3 inhibitor gilteritinib11. Co-treatment with ABD778 and gilteritinib restored drug sensitivity in a patient-derived xenograft model of adaptive resistance to FLT3 inhibition. These data validate the palmitoylation cycle as a promising therapeutic target in AML and support exploring it in other NRAS-mutant cancers.


Conflict of interest statement

Competing interests Nhi Ngo, Dylan M. Herbst, Radu M. Suciu, Carlos Guijas, Kimia Sedighi, Taylor Andalis, Elysia Roche, Boer Xie, and Micah J. Niphakis are full-time employees of Lundbeck. The authors declare no other competing interests.

Figures

Figure 1.
Figure 1.. Discovery and characterization of ABD778 as an ABHD17 inhibitor with in vivo activity.
a, Structures of ABD957 and ABD778 and corresponding Caco-2 permeability data highlighting improved passive permeability and reduced efflux of ABD778. b, Half maximal inhibitor concentration (IC50) curves for ABD778 against endogenous mouse ABHD17 and recombinantly expressed human ABHD17B was measured by gel-based activity based proteomic profiling (ABPP). Data presented as mean values ± s.e.m (n = 2–3). c,d, Competitive gel-based ABPP profiling of ABD778 (0.001–10 μM) in mouse brain membrane (panel c) and in HEK293T cells transduced with a cDNA encoding human ABHD17B (panel d) showing selective inhibition of ABHD17 over FP-Rh-labeled mouse and human serine hydrolases. e, ABD778 partially inhibits N-Ras depalmitoylation. Representative gel measuring N-RasG12D palmitoylation by 17-ODYA in the presence of varying concentrations of ABD778 (upper panel). N-RasG12D was immunoprecipitated via GFP and the degree of palmitoylation visualized by rhodamine azide attached via copper(I)-catalyzed click chemistry to the alkyne of 17-ODYA. Total N-Ras content was measured by western blotting of GFP enrichments (bottom panel). As expected, 17-ODYA labeling was not observed in OCI-AML3/ONK cells in which the N-Ras hypervariable domain (HVR) was replaced by the K-Ras4b HVR. f, Calculated IC50 values for ABD778 stabilization of N-RasG12D palmitoylation as measured in e (n = 3 per group). g, In situ MS-based ABPP data from OCI-AML3 cells that were exposed to ABD778 (0.001–10 μM) for 4 h demonstrating ABHD17A/B/C inhibition at low nanomolar concentrations and selectivity across depalmitoylases LYPLA1, LYPLA2 and ABHD10. Data plotted represent mean competition from three biological replicates. h,i, In vivo target engagement for ABHD17A/B/C (panel h) and LYPLA1/2 (panel i) following ABD957 or ABD778 administration. C57Bl/6 mice were dosed with vehicle, ABD957 (50 mg/kg, po) or ABD778 (50 mg/kg, po). Spleen tissue was collected 4, 8, 12 and 24 h after compound administration and analyzed by targeted MS-ABPP using FP-biotin enrichment of serine hydrolase enzymes and parallel reaction monitoring (PRM) to detect and quantify unique diagnostic peptides from each ABHD17 and LYPLA enzyme. ABD778 provided near complete and sustained blockade of ABHD17 enzymes over 24 h whereas ABD957 showed transient inhibitory activity. Both compounds maintained selectivity over LYPLA1 and LYPLA2. Data plotted represent the median from biological replicates, and error bars represent s.d. (n = 3–5).
Figure 2.
Figure 2.. Selective activity of ABD778 and synergy with PD901 in NRAS-mutant AML cell lines.
a, b, The proliferation of NRAS mutant OCI-AML3 and HL-60 cells and of KRAS mutant NB4 and SKM1 cells were assessed 72 h after exposure to ABD778 (panel a) or PD901 (panel b) using Cell Titer-Glo. c, Bliss independence analysis demonstrating synergistic growth inhibition over a broad range of ABD778 and PD901 concentrations in OCI-AML3 (left), but not NB4 (right), cells. Heatmaps display calculated synergy scores from strongly positive (red) to negative (blue). The data presented in panels a–c data generated in triplicate and were replicated in at least two additional independent experiments. d, Phosphorylated ERK (pERK) and S6 (pS6) levels were measured using phospho-flow cytometry in OCI-AML3 (left) and NB4 (right) cells exposed to ABD778 and/or PD901 for 4h at the doses shown. Mean fluorescence index (MFI) values were normalized to 100% of the DMSO control and pooled for statistical analysis. n = 4–11; *** - p < 0.001; **** - p < 0.0001. e, pERK and pS6 levels were measured by Western blotting in OCI-AML3 (left) and NB4 (right) cells that were exposed to DMSO, ABD778, PD901, or both drugs as in panel d. The data presented were generated in (panel d) or are representative of (panel e) at least three independent experiments.
Figure 3.
Figure 3.. Activity of ABD778 in isogenic MOLM-13 cells expressing oncogenic N-RasG12D or K-RasG12D and JMML patient samples.
a,b, MOLM-13 cells that were treated with doxycycline (Dox) for 24h to induce exogenous N-RasG12D or K-RasG12D expression as described previously,. were exposed a range of ABD778 and PD901 doses for 72h. Proliferation was assessed by Cell Titer-Glo. c, Bliss independence analysis of MOLM-13/N-RasG12D (left) and MOLM13/K-RasG12D (right) cells that were treated with doxycycline (Dox) for 24h and then exposed a range of ABD778 and PD901 doses for 72h as described in Figure 2. Heatmaps display calculated synergy scores from strongly positive (red) to negative (blue). d, pERK levels were measured by phospho-flow cytometry in MOLM13/N-RasG12D (left) and MOLM13/K-RasG12D (right) cells that were exposed to the ABD778 and/or PD901 doses shown for 4h. Mean fluorescence index (MFI) values were normalized to 100% in cells that were treated with the DMSO vehicle and were pooled for statistical analysis. The data shown in Figures 3a–3d are from at least three independent experiments. n = 6–12; *- p < 0.05; ***- p < 0.001; **** - p < 0.0001. e, CFU-GM colonies were grown in methylcellulose medium from JMML patient samples harboring NRAS or KRAS mutations (n = 3 of each genotype) with and without ABD778 (1 μM). Cytokine independent CFU-GM colony growth is shown on the left and the number of CFU-GM colonies observed in cultures containing a saturating dose of GM-CSF (10 ng/mL) is shown on the right. Colony growth was normalized to 100% (1.0) for NRAS-mutant and KRAS-mutant patient samples grown in GM-CSF, respectively. Note that the GM-CSF markedly augmented CFU-GM growth in JMML cells of both genotypes and that ABD778 robustly suppressed the growth of NRAS mutant leukemias.
Figure 4.
Figure 4.. Efficacy of in vivo ABD778 and PD901 treatment in primary NrasG12D and KrasG12D AMLs.
a, Transplantable primary AMLs were generated by injecting neonatal wild-type (WT), Mx1-Cre; NrasLSL-G12D/+, or Mx1-Cre; KrasLSL-G12D/+, mutant mice with the MOL4070LTR retrovirus followed by a single dose of polyI-polyC at weaning to induce NrasG12D or KrasG12D expression from the endogenous loci as described previously,. Preclinical trials are performed by expanding cryopreserved leukemia cells in vivo and transplanting 1–2 ×10⁶ bone marrow cells into 10–20 congenic recipients. b, c Blood concentrations of ABD778 (panel b) and PD901 (panel c) following a single dose of ABD778 (60 mg/kg, po), PD901 (2.5 mg/kg, po) or both compounds dosed 1 h apart in mice. Blood was collected 2, 6, and 24 h after compound administration and analyzed LC-MS/MS. Coadministration of ABD778 and PD901 (blue line) provides similar compound exposures compared with single-agent dosing (red and yellow lines for ABD778 and PD901, respectively). d, Cumulative probability of survival of mice transplanted with NrasG12D AMLs 6606, 6695, and 6768 that were treated with the control vehicle (black line), ABD778 (red line), PD901 (yellow line), or PD901 + ABD778 (blue line). GraphPad Prism software was used to generate Kaplan-Meier survival curves (primary endpoint) and statistical significance between individual trial arms was calculated using a two-tailed Log-Rank test. These values are presented in the text. e, Cumulative probability of survival of mice transplanted with KrasG12D AMLs 21B and 63A that received the control vehicle (black line), ABD778 (red line), PD901 (yellow line), or PD901 + ABD778 (blue line). Statistical analysis was performed as described in panel b and significant differences reported in the text. f, The left panel shows the survival of 5 recipient mice of NrasG12D AML 6606 that were treated with ABD778 + PD901 in the initial trial. Leukemia cells collected at euthanasia from the recipient shown in the black box were transplanted into secondary recipients and re-treated with either control vehicle or ABD778 + PD901 (n = 3 mice per group). The right panel shows the survival of these mice.
Figure 5.
Figure 5.. Mutations detected at euthanasia in recipient of NrasG12D AMLs confer resistance to ABD778 and PD901.
a, Percentages of mCherry-positive (mCherry+) OCI-AML3 cells that were transduced with a mCherry-KRASA146T expression vector and tracked over 10 days of exposure to either DMSO (black), PD901 (orange), ABD778 (red), or PD901 and ABD778 (blue). Cells were analyzed and replated with fresh drug added every 48h. These data were generated from three independent biological replicates. Day 10 time points were pooled for statistical analysis. **** p < 0.0001; * p < 0.05. b. Relative pERK levels of mCherry-KRASA146T -transduced OCI-AML3 cells compared to non-transduced cells within the same drug treatment well. Cells in treatment wells were exposed to DMSO, PD901, ABD778, or both drugs for 4h. n = 5; * p < 0.05. c. Percentages of mCherry+ OCI-AML3 cells that were transduced with a mCherry-BRAFG466E and monitored for 10 days as in panel a. Data from three independent biological experiments. Day 10 time points were pooled for statistical analysis. *** p < 0.001; ** p < 0.01. d, Relative pERK levels of mCherry-BRAFG466E-transduced OCI-AML3 cells compared to non-transduced cells within the same drug treatment well as in panel c. n = 5; *** p < 0.001; ** p < 0.01.
Figure 6.
Figure 6.. ABD778 cooperates with chemical inhibitors of PI3 kinase, RasG12C, and FLT3 to suppress the growth of NRAS-mutant AML cells.
a, Bliss independence analysis of MOLM-13/N-RasG12C (left) and MOLM13/K-RasG12C (right) cells that were treated with doxycycline (Dox) for 24 h to induce N-RasG12C, N-RasG12D, K-RasG12C or K-RasG12D expression were exposed to a range of ABD778 and sotorasib doses. b, pERK levels were measured by phospho-flow cytometry in MOLM13/N-RasG12C (left) and MOLM13/K-RasG12C (right) cells that were exposed to the ABD778 and/or sotorasib doses shown for 4h (n = 6–14). c, Bliss independence analysis of MOLM-13/N-RasG12D and MOLM13/K-RasG12D cells that were treated with a range of ABD778 and gilteritinib concentrations was performed as described above. d, pERK levels were measured by phospho-flow cytometry in MOLM13/N-RasG12D (left) and MOLM13/K-RasG12D (right) cells that were exposed to the ABD778 and/or gilteritinib doses shown for 4h (n = 6–7). e, NSG mice were transplanted with 1 million human AML PDX cells. After confirming the presence of human CD34+ cells on day 4 post-transplant, recipient mice were treated daily with vehicle, ABD778, gilteritinib, or ABD778 + gilteritinib combination (n = 6 mice per group). Mice in all four cohorts were euthanized in days 21–22 due to weight loss in mice assigned to ABD778 treatment. f, The percentage of human hematopoietic cells in the spleens and bone marrows of NSG mice were determined at the end of the trial by flow cytometry using an antibody to human CD45. **** p < 0.0001, ** p < 0.001, * p < 0.05.

Similar articles

References

    1. Rocks O. et al. An acylation cycle regulates localization and activity of palmitoylated Ras isoforms. Science 307, 1746–1752, (2005). - PubMed
    1. Yeste-Velasco M., Linder M. E. & Lu Y. J. Protein S-palmitoylation and cancer. Biochim Biophys Acta 1856, 107–120, (2015). - PubMed
    1. Cuiffo B. & Ren R. Palmitoylation of oncogenic NRAS is essential for leukemogenesis. Blood 115, 3598–3605, (2010). - PMC - PubMed
    1. Lin D. T. & Conibear E. ABHD17 proteins are novel protein depalmitoylases that regulate N-Ras palmitate turnover and subcellular localization. Elife 4, e11306, doi:10.7554/eLife.11306 (2015). - DOI - PMC - PubMed
    1. Remsberg J. R. et al. ABHD17 regulation of plasma membrane palmitoylation and N-Ras-dependent cancer growth. Nat Chem Biol, 8:856–864 (2021). - PMC - PubMed

Methods References

    1. Liu Y., Patricelli M. P. & Cravatt B. F. Activity-based protein profiling: the serine hydrolases. Proc Natl Acad Sci U S A 96, 14694–14699, doi:10.1073/pnas.96.26.14694 (1999). - DOI - PMC - PubMed
    1. UniProt C. UniProt: the Universal Protein Knowledgebase in 2023. Nucleic acids research 51, D523–D531, doi:10.1093/nar/gkac1052 (2023). - DOI - PMC - PubMed
    1. Hulstaert N. et al. ThermoRawFileParser: Modular, Scalable, and Cross-Platform RAW File Conversion. J Proteome Res 19, 537–542, doi:10.1021/acs.jproteome.9b00328 (2020). - DOI - PMC - PubMed
    1. Eng J. K., Jahan T. A. & Hoopmann M. R. Comet: an open-source MS/MS sequence database search tool. Proteomics 13, 22–24, doi:10.1002/pmic.201200439 (2013). - DOI - PubMed
    1. Tyanova S., Temu T. & Cox J. The MaxQuant computational platform for mass spectrometry-based shotgun proteomics. Nat Protoc 11, 2301–2319, doi:10.1038/nprot.2016.136 (2016). - DOI - PubMed

Publication types