[Preprint]. 2025 Mar 19:2025.03.18.643977.
doi: 10.1101/2025.03.18.643977.

Decoupling Phase Separation and Fibrillization Preserves Activity of Biomolecular Condensates

Affiliations

Decoupling Phase Separation and Fibrillization Preserves Activity of Biomolecular Condensates

Tharun Selvam Mahendran et al. bioRxiv. .

Abstract

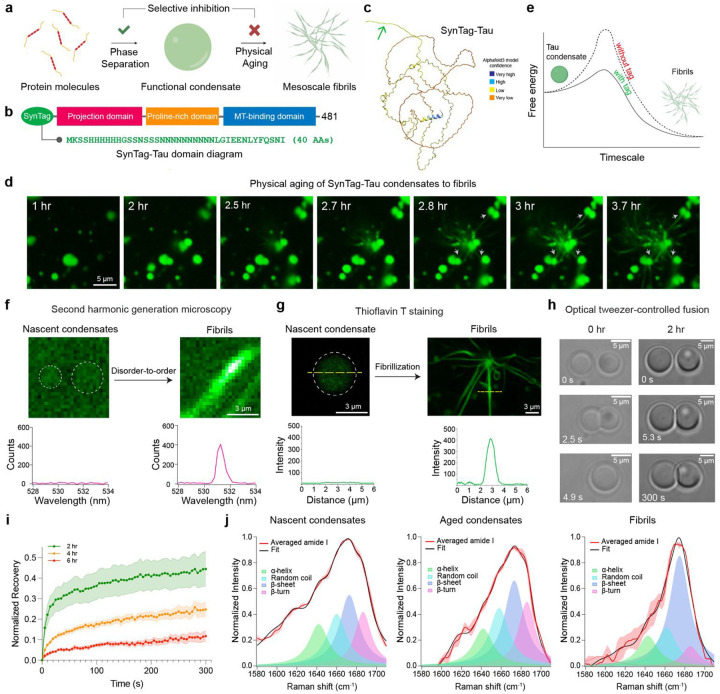
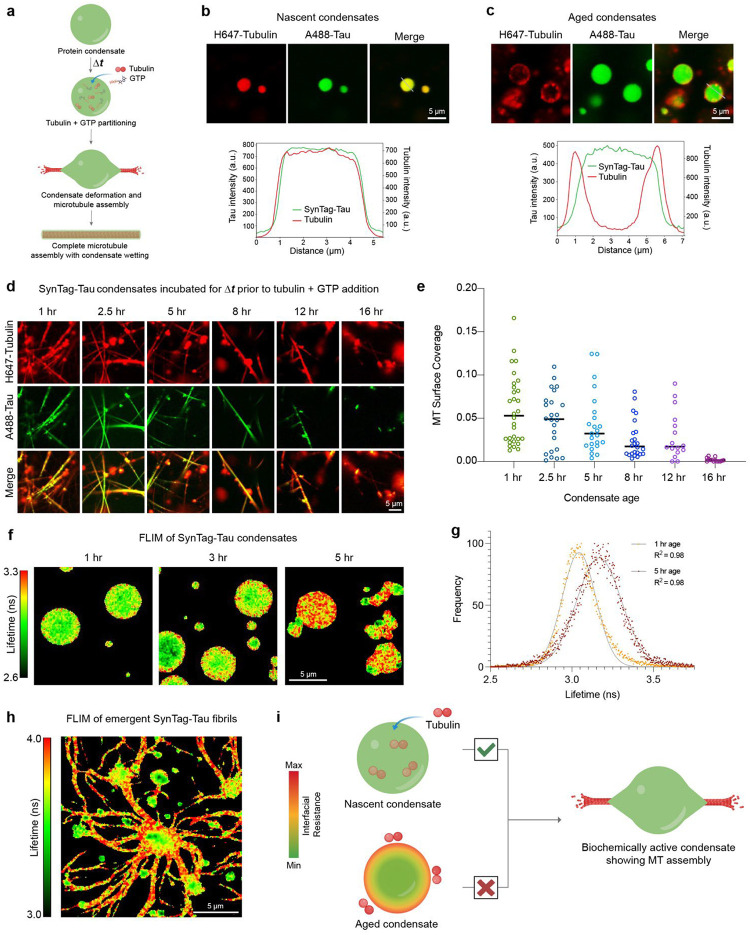
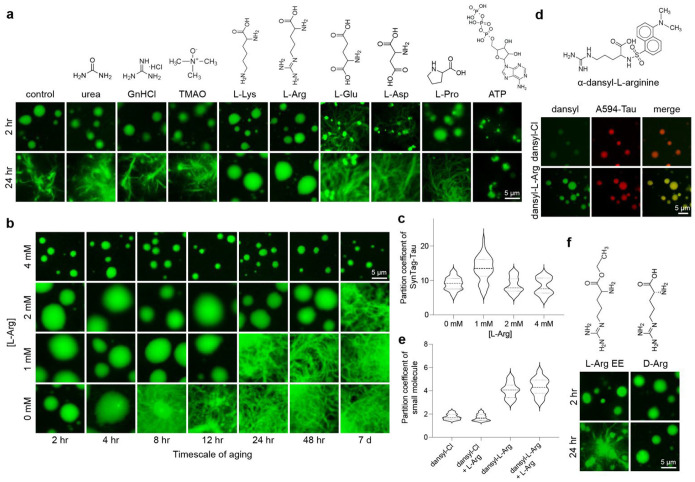
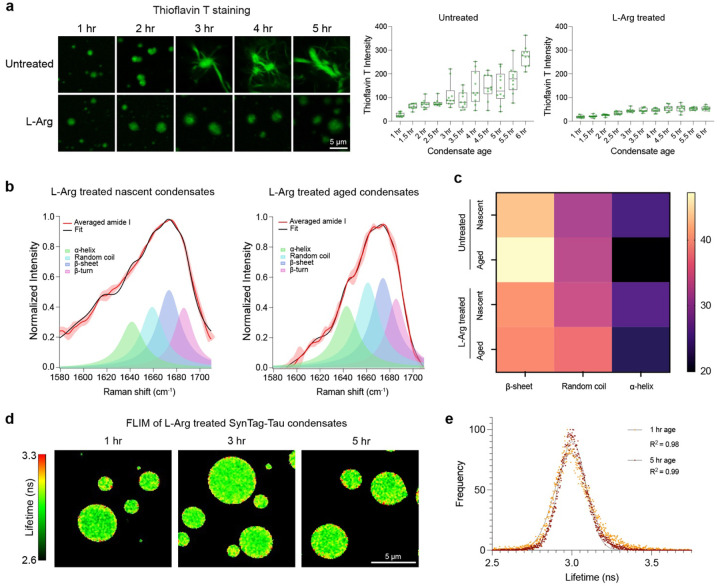
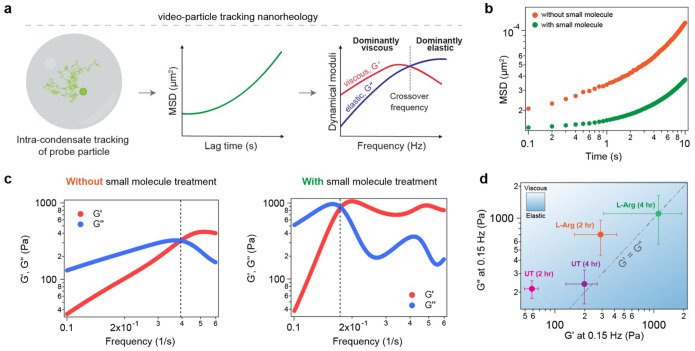
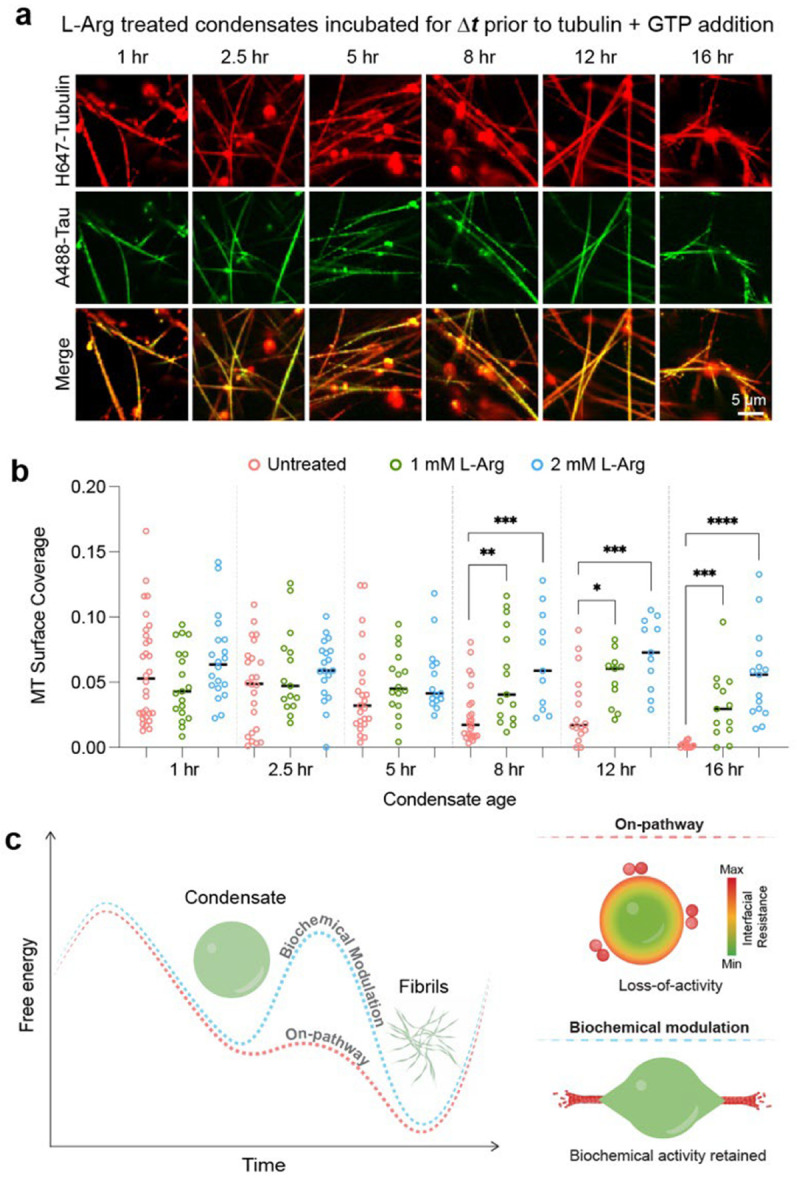
Age-dependent transition of metastable, liquid-like protein condensates to amyloid fibrils is an emergent phenomenon of numerous neurodegeneration-linked protein systems. A key question is whether the thermodynamic forces underlying reversible phase separation and maturation to irreversible amyloids are distinct and separable. Here, we address this question using an engineered version of the microtubule-associated protein Tau, which forms biochemically active condensates. Liquid-like Tau condensates exhibit rapid aging to amyloid fibrils under quiescent, cofactor-free conditions. Tau condensate interface promotes fibril nucleation, impairing their activity to recruit tubulin and catalyze microtubule assembly. Remarkably, a small molecule metabolite, L-arginine, selectively impedes condensate-to-fibril transition without perturbing phase separation in a valence and chemistry-specific manner. By heightening the fibril nucleation barrier, L-arginine counteracts age-dependent decline in the biochemical activity of Tau condensates. These results provide a proof-of-principle demonstration that small molecule metabolites can enhance the metastability of protein condensates against a liquid-to-amyloid transition, thereby preserving condensate function.


Conflict of interest statement

Competing interests P.R.B. is a member of the Biophysics Reviews (AIP Publishing) editorial board. This affiliation did not influence the work reported here. All other authors have no conflicts to report.

Figures

Figure 1.
Figure 1.. Engineered SynTag-Tau with a prionogenic tag undergoes phase separation coupled to fibril formation under cofactor-free quiescent conditions.
(a) Schematic depicting the formation of phase-separated protein condensates and their time-dependent transition to form mesoscale amyloid fibrils. (b) Domain diagram of SynTag-Tau consisting of full-length Tau (2N4R isoform) with an N-terminal synthetic prionogenic tag (sequence provided in green). (c) Alphafold3 predicted structure of SynTag-Tau. The green arrow marks the location of the tag. (d) Time-lapse imaging of Atto488-labeled SynTag-Tau condensates shows time-dependent morphological changes of the condensates to mesoscale fibrils. Grey arrows indicate the attachment of fibrils emerging from one condensate to neighboring condensates. Also, see Supplementary Video 1. (e) Schematic of a free energy diagram showing condensate-to-fibril transition with and without the prionogenic tag fused at the N-terminus of full-length Tau. (f) Second harmonic generation (SHG) microscopy shows the absence of molecular ordering in nascent SynTag-Tau condensates (indicated by dashed circles; sample age = 2 hours) and the presence of spatial orders in fibrils (sample age = 10 hours). (g) Thioflavin T (ThT) fluorescence line profiles from nascent SynTag-Tau condensates (indicated by a dashed circle; sample age = 2 hours) and fibrils (sample age = 10 hours). (h) Optical tweezer-controlled fusion of nascent SynTag-Tau condensates (sample age = 30 mins, indicated as the 0-hour time point) and condensates at 2 hours of age. (i) FRAP measurements of SynTag-Tau condensates at various time points as indicated. Intensity error bars were plotted based on the standard error of the mean (S.E.M.) at each time point and are represented as the shaded regions. (j) Peak fitting of averaged amide I spectra obtained from broadband coherent anti-Stokes Raman (BCARS) hyperspectral imaging shows the structural profile of SynTag-Tau in condensates at 2 hours of age (nascent condensates) and at 6 hours of age (aged condensates), as well as fibrils formed at 10 hours of age. For panel (d), the concentration of SynTag-Tau used is 24 μM with 10% PEG 8000. For panels (f), (g), and (j), the concentration of SynTag-Tau used is 12 μM with 10% PEG8000. For panels (h) and (i), the concentration of SynTag-Tau used is 12 μM with 7.5% PEG8000. The buffer composition in all samples here is 10 mM HEPES (pH 7.4), 50 mM NaCl, 0.1 mM EDTA, and 2 mM DTT. Wherever applicable, the concentration of Atto488-labeled SynTag-Tau is 250 nM, and the concentration of ThT is 50 μM. Each experiment was independently repeated at least three times.
Figure 2.
Figure 2.. Age-dependent liquid-to-amyloid transition impairs SynTag-Tau condensate activity in microtubule assembly.
(a) Schematic of tubulin recruitment and microtubule (MT) polymerization in Tau condensates. (b) Nascent SynTag-Tau condensates (age = 2 hours) in the presence of 50 nM HiLyte647-labeled tubulin show enrichment of tubulin in the dense phase. Corresponding line profiles are shown below. (c) Aged SynTag-Tau condensates (age = 4 hours) with the addition of 50 nM HiLyte647-labeled tubulin show altered tubulin partitioning to the condensate interface. Corresponding line profiles are shown below. (d) Condensate age-dependent microtubule polymerization assay in SynTag-Tau condensates. (e) Microtubule surface coverage plot corresponding to panel (d). Horizontal lines at each time point represent the median value. The individual data points from replicate experiments are shown. (f) Frequency-domain (FD) FLIM images of SynTag-Tau condensates at various timepoints highlight the age-dependent increase in the lifetime of Atto488-labeled SynTag-Tau molecules at the condensate interface, which eventually spreads to the condensate core. (g) Representative fluorescence lifetime distributions at 1 hr and 5 hr time points (since sample preparation). The points are the data, and the lines are Gaussian fittings with the corresponding goodness of fit (R2) indicated. (h) FD-FLIM map of aged SynTag-Tau condensates with emergent fibrillar assemblies (sample age = 8 hours). (i) Schematic of condensate physical aging induced interfacial resistance in SynTag-Tau condensates, which perturbs partitioning of tubulin to the condensate dense phase and impairs MT assembly. The concentration of SynTag-Tau protein used in (b, c) is 24 μM with the following buffer composition, 10 mM HEPES (pH 7.4), 50 mM NaCl, 0.1 mM EDTA, and 2 mM DTT along with 10% PEG8000. In (f-h), the concentration of SynTag-Tau protein is 12 μM with the same buffer composition as (b, c). In (d), the concentration of SynTag-Tau used is 12 μM with the following buffer composition, 80 mM PIPES (pH 6.9), 2 mM MgCl2, 0.5 mM EGTA, and 2 mM DTT along with 5% PEG8000 crowder. In (d), the tubulin concentration is 5 μM, and the concentration of GTP is 1 mM. Wherever applicable, the concentrations of Atto488-labeled SynTag-Tau and HiLyte647-labeled tubulin are 250 nM and 500 nM (unless specified otherwise), respectively. Each of these experiments was independently repeated at least three times.
Figure 3.
Figure 3.. Small molecule metabolites can decouple phase separation and fibril formation in a chemistry-specific manner.
(a) Effect of naturally occurring small molecule metabolites, chaotropic compounds, and small molecule modulators of protein-protein interactions on phase separation and fibrillization of SynTag-Tau. (b) Dose-dependent effect of L-Arg in inhibition of SynTag-Tau condensate-to-amyloid transition. (c) The corresponding partition coefficient analysis from fluorescence images as shown in (b). The thick dashed line represents the median, whereas the thinner dotted lines above and below represent the upper and lower quartiles, respectively. (d) (top) Chemical structure of α-dansyl-L-arginine (dansyl-L-Arg), a fluorescently labeled analog of L-Arg. (bottom) Partitioning of α-dansyl chloride (dansyl-Cl) or dansyl-L-Arg doped along with L-Arg into SynTag-Tau condensates, visualized using Alexa594- (A594) labeled SynTag-Tau, at 2 hours sample age. (e) Partition coefficient analysis of dansyl-Cl or dansyl-L-Arg with/without L-Arg to SynTag-Tau condensates. The thick dashed line represents the median, whereas the thinner dotted lines above and below represent the upper and lower quartiles, respectively. (f) L-Arg ethyl ester (L-Arg EE), a derivative of L-Arg that lacks a carboxyl group, failed to prevent condensate aging to fibrils. D-arginine (D-Arg) treated condensates do not transition to fibrils, similar to the L-Arg condition shown in (a). The composition of these samples is 12 μM SynTag-Tau in buffer containing 10 mM HEPES (pH 7.4), 50 mM NaCl, 0.1 mM EDTA, and 2 mM DTT along with 7.5% PEG8000. Small molecules were introduced prior to the induction of protein phase separation, and their concentrations used in these experiments are 2 mM unless specified otherwise. Wherever applicable, the concentration of Atto488-/Alexa594-labeled SynTag-Tau is 250 nM, and the concentration of dansyl-L-Arg/dansyl-Cl is 500 nM (doped with/without L-Arg to make up a total small molecule concentration of 2 mM). Each of these experiments was independently repeated three times.
Figure 4.
Figure 4.. L-Arg prevents cross β-sheet formation and nucleation of fibrils at the condensate interface.
(a) ThT fluorescence of condensates at different sample ages without (untreated) and with 2 mM L-Arg. Corresponding plots of ThT fluorescence intensities are shown on the right. The center line represents the median and the individual data points from replicate experiments are shown. (b) Peak fitting of averaged amide I spectra obtained from BCARS hyperspectral imaging of L-Arg-treated SynTag-Tau condensates reveals changes in protein molecular conformations from 2 hours of age (nascent condensates) to 6 hours of age (aged condensates). (c) Heat map based on the amide I spectra obtained through BCARS hyperspectral imaging showing the mean percentages of protein conformations in untreated versus 2 mM L-Arg treated SynTag-Tau condensates at 2 hours (nascent) and 6 hours (aged) of age. The mean percentages represent the quotient of each conformation’s peak fitted area divided by the cumulative area of β-sheet, random coil, and α-helix. (d) FD-FLIM map of L-Arg treated condensates at various time points (since sample preparation). (e) Representative fluorescence lifetime distributions at 1 hr and 5 hr time points (since sample preparation). The points are the data, and the lines are Gaussian fittings with the corresponding goodness of fit (R2) indicated. The composition of these samples is 12 μM SynTag-Tau in buffer containing 10 mM HEPES (pH 7.4), 50 mM NaCl, 0.1 mM EDTA, and 2 mM DTT along with 10% PEG8000 crowder. The L-Arg concentration used in these experiments is 2 mM. Wherever applicable, the concentration of Atto488 labeled SynTag-Tau is 250 nM, and the concentration of ThT is 50 μM. Each of these experiments was independently repeated three times.
Figure 5.
Figure 5.. Small molecule-mediated enhancement of condensate viscoelasticity.
(a) Schematic of VPT nanorheology measurements using 200 nm probe particles passively embedded within Tau condensates. (b) Representative mean squared displacement (MSD) measurements of probe particles inside Tau condensates with or without small molecule treatment (2 mM L-Arg). The measurements were conducted 2 hours after sample preparation. (c) Estimated dynamical moduli of Tau condensates in the absence (left) or presence (right) of 2 mM L-Arg. The measurements were conducted 2 hours after sample preparation. The dashed line represents the crossover frequency. (d) Reports a diagram-of-states for untreated (UT) and small molecule treated (L-Arg) Tau condensates at the indicated sample age, based on the measured moduli at 0.15 Hz. The experimentally determined data are represented as mean values with standard deviations. The composition of the samples used here is 40 μM Tau in buffer containing 10 mM HEPES (pH 7.4), 50 mM NaCl, 0.1 mM EDTA, and 2 mM DTT along with 7.5% PEG8000, and 6.25 μM heparin. Wherever applicable, the L-Arg concentration used in experiments is 2 mM. Each of these experiments was independently repeated three times.
Fig. 6.
Fig. 6.. Selective inhibition of condensate age-dependent fibril formation preserves condensate biochemical activity.
(a) Microtubule polymerization assay of SynTag-Tau condensates treated with 1 mM L-Arg at various time points. (b) A comparison of MT surface coverage as a function of condensate age between untreated SynTag-Tau condensates (Fig. 2e) and L-Arg treated SynTag-Tau condensates (images shown in Supplementary Fig. 16). Horizontal black lines represent the median value. The individual data points from replicate experiments are shown. Statistical significance was determined using an unpaired two-sided Student’s t-test between the MT surface coverages of untreated condensates (orange) and either 1 mM L-Arg treated condensates (green) or 2 mM L-Arg treated condensates (blue) (* means p<0.05, ** means p<0.01, *** means p<0.001, **** means p<0.0001). The associated P values are shown from left to right: 0.0028, 0.0003, 0.0264, 0.0006, 0.0002, and 0.00009. (c) Schematic representing the proposed model for the biochemical modulation of energy barrier governing protein condensate-to-fibril transition and their impact on the condensate biochemical activity. The composition of samples used in panels (a) and (b) is 12 μM SynTag-Tau protein in buffer containing 80 mM PIPES (pH 6.9), 2 mM MgCl2, 0.5 mM EGTA, and 2 mM DTT along with 5% PEG8000 crowder. The tubulin concentration used here is 5 μM, and the concentration of GTP is 1 mM. The concentrations of Atto488-labeled SynTag-Tau and HiLyte647-labeled tubulin are 250 nM and 500 nM, respectively. These experiments were independently repeated three times.

Similar articles

References

    1. Martin EW, Holehouse AS, Peran I, Farag M, Incicco JJ, Bremer A, et al. Valence and patterning of aromatic residues determine the phase behavior of prion-like domains. Science 2020, 367(6478): 694–699. - PMC - PubMed
    1. Ginell GM, Holehouse AS. An Introduction to the Stickers-and-Spacers Framework as Applied to Biomolecular Condensates. In: Zhou H-X, Spille J-H, Banerjee PR (eds). Phase-Separated Biomolecular Condensates: Methods and Protocols. Springer; US: New York, NY, 2023, pp 95-116. - PubMed
    1. Pappu RV, Cohen SR, Dar F, Farag M, Kar M. Phase Transitions of Associative Biomacromolecules. Chemical Reviews 2023, 123(14): 8945–8987. - PMC - PubMed
    1. Dignon GL, Best RB, Mittal J. Biomolecular Phase Separation: From Molecular Driving Forces to Macroscopic Properties. Annual Review of Physical Chemistry 2020, 71(Volume 71, 2020): 53–75. - PMC - PubMed
    1. Rekhi S, Garcia CG, Barai M, Rizuan A, Schuster BS, Kiick KL, et al. Expanding the molecular language of protein liquid–liquid phase separation. Nature Chemistry 2024, 16(7): 1113–1124. - PMC - PubMed

Publication types

LinkOut - more resources