[Preprint]. 2025 Mar 18:2025.03.17.643805.
doi: 10.1101/2025.03.17.643805.

Human Neonatal MR1T Cells Have Diverse TCR Usage, are Less Cytotoxic and are Unable to Respond to Many Common Childhood Pathogens

Affiliations

Human Neonatal MR1T Cells Have Diverse TCR Usage, are Less Cytotoxic and are Unable to Respond to Many Common Childhood Pathogens

Dylan Kain et al. bioRxiv. .

Abstract

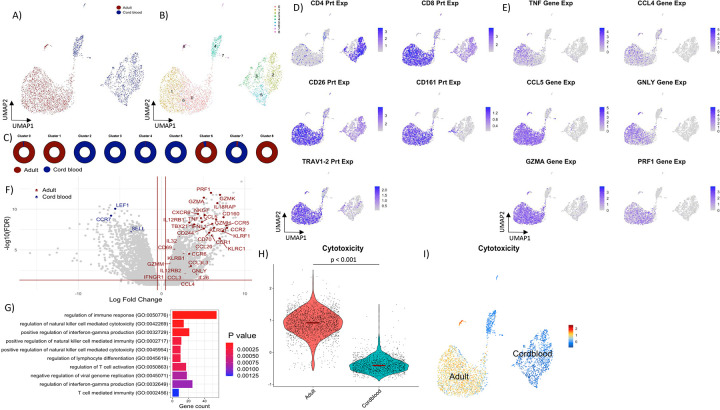
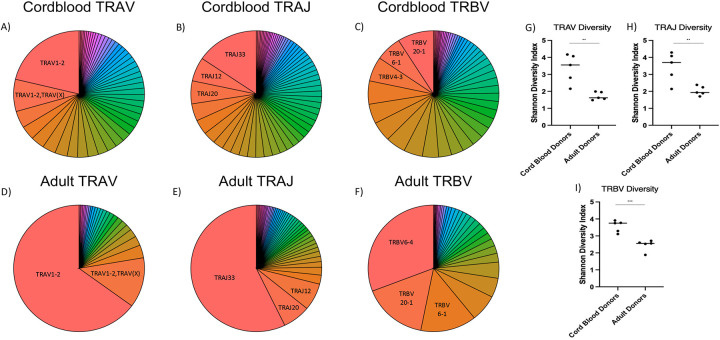
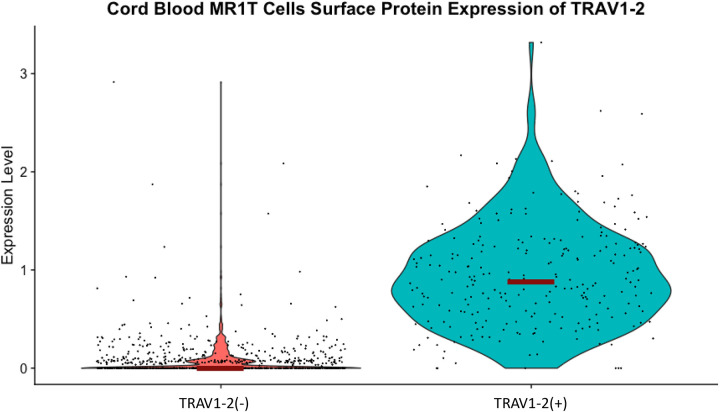
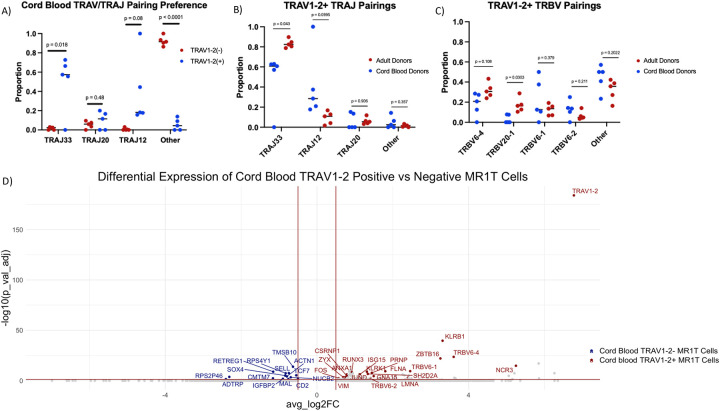
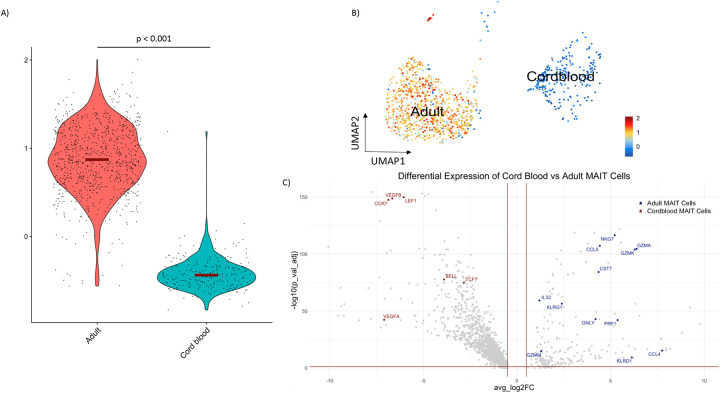
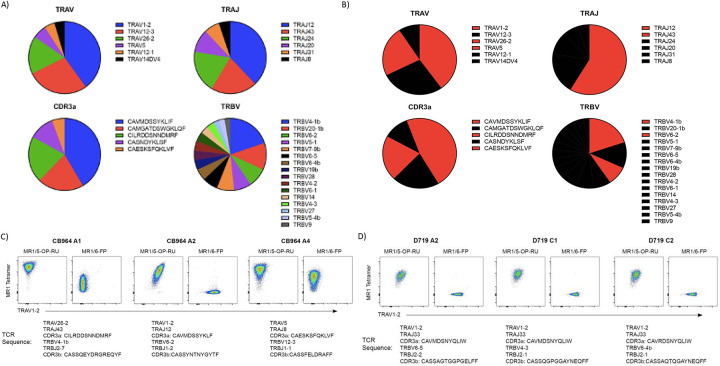
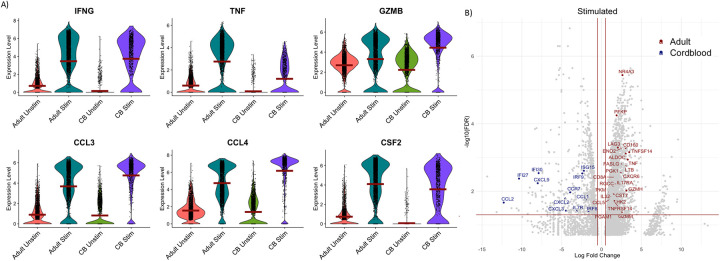
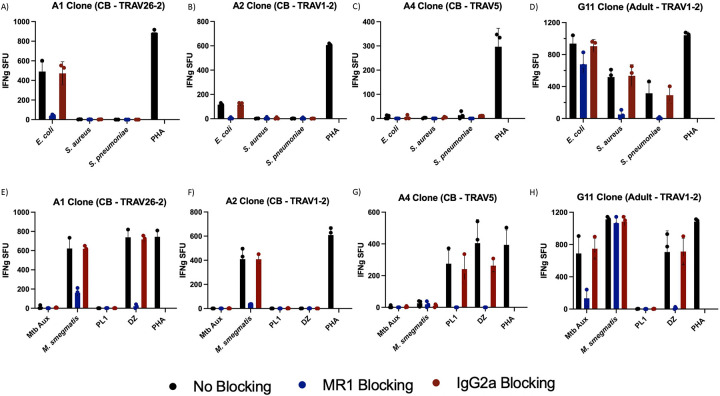
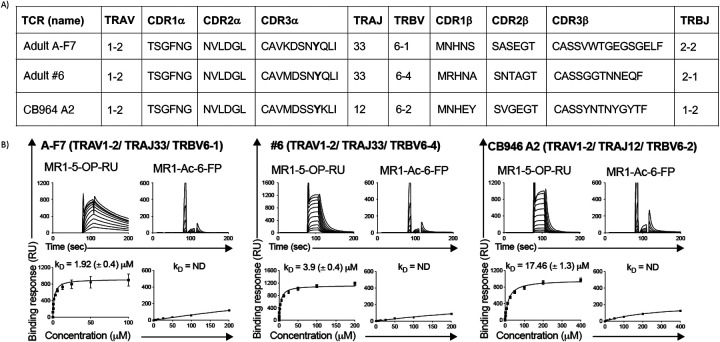
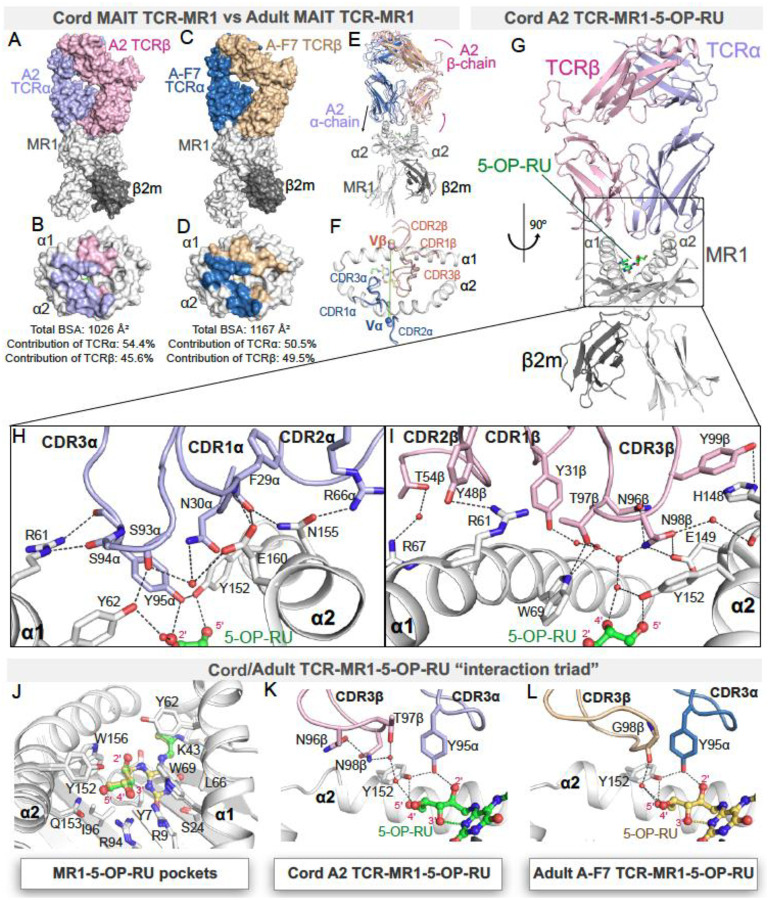
Neonatal sepsis is a leading cause of childhood mortality. Understanding immune cell development can inform strategies to combat this. MR1-restricted T (MR1T) cells can be defined by their recognition of small molecules derived from microbes, self, and drug and drug-like molecules, presented by the MHC class 1-related molecule (MR1). In healthy adults, the majority of MR1T cells express an invariant α-chain; TRAV1-2/TRAJ33/12/20 and are referred to as mucosal-associated invariant T (MAIT) cells. Neonatal MR1T cells isolated from cord blood (CB) demonstrate more diversity in MR1T TCR usage, with the majority of MR1-5-OP-RU-tetramer(+) cells being TRAV1-2(-). To better understand this diversity, we performed single-cell-RNA-seq/TCR-seq (scRNA-seq/scTCR-seq) on MR1-5-OP-RU-tetramer(+) cells from CB (n=5) and adult participants (n=5). CB-derived MR1T cells demonstrate a less cytotoxic/pro-inflammatory phenotype, and a more diverse TCR repertoire. A panel of CB and adult MAIT and TRAV1-2(-) MR1T cell clones were generated, and CB-derived clones were unable to recognize several common riboflavin-producing childhood pathogens (S. aureus, S. pneumoniae, M. tuberculosis). Biochemical and structural investigation of one CB MAIT TCR (CB964 A2; TRAV1-2/TRBV6-2) showed a reduction in binding affinity toward the canonical MR1-antigen, 5-OP-RU, compared to adult MAIT TCRs that correlated with differences in β-chain contribution in the TCR-MR1 interface. Overall, this data shows that CB MAIT and TRAV1-2(-) MR1T cells, express a diverse TCR repertoire, a more restricted childhood pathogen recognition profile and diminished cytotoxic and pro-inflammatory capacity. Understanding this diversity, along with the functional ability of TRAV1-2(-) MR1T cells, could provide insight into increased neonatal susceptibility to infections.

Keywords: MAIT cells; MR1; MR1T cells; Neonatal sepsis; Single-cell sequencing; T cell development; Tuberculosis.


Conflict of interest statement

Competing Interests J.R. is an inventor on patent applications (PCT/AU2013/000742, WO2014005194; PCT/AU2015/050148, WO2015149130) describing MR1 ligands and MR1-tetramer reagents. The other authors declare no competing interests.

Figures

Figure 1:
Figure 1:. CB MR1T cells have a distinct, less cytotoxic gene expression profile compared to adult MR1T cells
a) Dimensionality reduction of all MR1/5-OP-RU sorted MR1T cells from 5 adult donors and 5 CB donors (n = 2,200 adult MR1T cells and 1,513 CB MR1T cells). b) Unsupervised clustering of all MR1T cells c) Percent of each cluster that is made up by each donor type (adult vs CB) d) Cell surface protein expression by CITE-seq staining. e) Gene expression of common inflammatory/cytotoxic genes f) Volcano plot of differentially expressed genes in CB vs adult MR1T cells. Horizontal red line represents Bonferroni-adjusted p-value of 0.05 and vertical red line represents log fold change of −0.5 or 0.5. g) Top 10 upregulated gene ontology pathways in adult MR1T cells compared to CB MR1T cells. h,i) Cytotoxicity score (PRF1, GNLY, NKG7, GZMA, GZMB, GZMH, GZMK and GZMM) for adult compared to CB MR1T cells. p < 0.0001 using Wilcoxon test.
Figure 2:
Figure 2:. CB MR1T cells have a much more diverse TCR repertoire compared to adult MR1T cells
a-f) CB and adult MR1T cell TRAV, TRAJ and TRBV repertoire by TCR sequencing. TRAV1–2,TRAV(X) represents cells with dual expression of alpha chains, one being TRAV1–2 and TRAV(X) representing any TRAV1–2(−). g-i) Shannon diversity index of TRAV, TRAJ and TRBV repertoire of CB and adult MR1T cells. Unpaired t-test with p-value < 0.01 denoted by ** and p-value < 0.001 denoted by ***
Figure 3:
Figure 3:. TRAV1–2 cell surface protein expression matches TRAV1–2 gene expression for CB MR1T cells
CB MR1T cells were sorted into TRAV1–2(+) or TRAV1–2(−) based on gene expression, and violin plot of cell surface protein expression is displayed based on CITE-seq staining (cell surface protein expression) for TRAV1–2 (TCR Vα7.2)
Figure 4:
Figure 4:. Pairing preferences more diverse for CB MR1T cells
a) Pairing preferences of CB MR1T cells based on gene expression of TRAV1–2(+) vs TRAV1–2(−). Unpaired t-test. b) TRAJ pairing preference for TRAV1–2(+) MR1T cells from adult and CB donors. Unpaired t-test. c) TRBV pairing preference for TRAV1–2(+) MR1T cells from adult and CB donors. Unpaired t-test. d) Volcano plot for differential gene expression of CB MR1T cells expressing TRAV1–2(+) or TRAV1–2(−). Labeled genes were greater than 0.5 or less than −0.5 log fold change and had a Bonferroni-adjusted p-value of < 0.05.
Figure 5:
Figure 5:. TRAV1–2(+) adult MAIT cells are more cytotoxic than TRAV1–2(+) CB MAIT cells
a-b) Cells were sorted for TRAV1–2(+) MR1T cells and then cytotoxicity score (PRF1, GNLY, NKG7, GZMA, GZMB, GZMH, GZMK and GZMM) was assessed for adult compared to CB MR1T cells. p-value < 0.0001 calculated using Wilcoxon test. c) Volcano plot for differential gene expression of CB MAIT vs Adult MAIT. Labeled genes were greater than 0.5 or less than −0.5 log fold change and had a Bonferroni-adjusted p-value of < 0.05.
Figure 6:
Figure 6:. MR1T cell generated clones can represent the diversity of TCR repertoire of CB donors
a) TCR repertoire of donor CB964 from which CB MR1T cell clones were generated. b) Red represents TCR repertoire from donor CB964 for which MR1T cell clones were generated. c) MR1/5-OP-RU and 6-FP tetramer staining by flow cytometry of CB MR1T cell clones along with TCR sequence obtained by single-cell sequencing below for each of CB964 A1, CB964 A2 and CB964 A4. d) MR1/5-OP-RU and 6-FP tetramer staining by flow cytometry of adult MR1T cell clones along with TCR sequence obtained by single-cell sequencing below for each of D719 A2, D719 C1 and D719 C2.
Figure 7:
Figure 7:. CB MR1T cell clones can produce typical inflammatory/cytotoxic cytokines by gene expression, but have distinct gene expression profiles from adult MR1T cell clones
a) Violin plot of gene expression of common inflammatory/cytotoxic genes from stimulated (PMA/Ionomycin) and unstimulated MR1T cell clones from adult compared to CB donors b) Volcano plot of differentially expressed genes of adult compared to CB MR1T cell clones when stimulated with PMA/Ionomycin. Horizontal red line represents Bonferroni-adjusted p-value of 0.05, and vertical red lines represent log fold change of 0.5 or −0.5.
Figure 8:
Figure 8:. CB and adult MR1T cell clones have distinct and diverse microbial recognition pattern
a-d) IFNγ ELISPOT of CB MR1T cell clones (A1, A2 and A4) and adult MR1T cell clone (G11) response to common childhood bacterial pathogens. Responses without blocking, anti-MR1 blocking antibody or isotype control blocking antibody are represented. Each clone was tested against DCs without microbes or antigens added, and this background was subtracted from IFNγ SFU shown. e-h) IFNγ ELISPOT of CB MR1T cell clones (A1, A2 and A4) and adult MR1T cell clone (G11) response to Mycobacteria and Mycobacterial antigens. Responses without blocking, anti-MR1 blocking antibody or isotype control blocking antibody are represented. SFU = spot forming units. PHA = phytohaemagglutin P. PL1 = photolumazine I. DZ = deazalumazine.
Figure 9:
Figure 9:. Steady-state affinity measurements of soluble TCRs for MR1-antigen complexes
a) TCR αβ gene names and CDR amino acid sequences of the TCR cell clones. b) The affinity of TCR-MR1-Ag interactions were determined using SPR, by measuring the binding of various concentrations of soluble adult MAIT TCRs of A-F7 (TRAV1–2/TRBV6–1; left panel) and #6 (TRAV1–2/TRBV6–4; middle panel), as well as cord CB946 A2 TCR clone (TRAV1–2/TRBV6–2; right panel) against human MR1 refolded with 5-OP-RU and Ac-6-FP antigens. The SPR runs were conducted as duplicate in two independent experiments using different batches of proteins. Experiments were conducted with serial dilutions of the TCRs. The SPR sensograms (upper panels), equilibrium curves (lower panels) and steady state KD values (μM) were prepared in GraphPad Prism 10. Error bars represent the mean and SD from technical replicates (two independent experiments). ND, not determined. RU, response unit
Figure 10:
Figure 10:. Structural comparison of ternary complexes of cord A2 and adult AF-7 typical MAIT TCRs with MR1–5-OP-RU
a-d) Crystal structures of ternary complexes of (a-b) cord A2 MAIT (TRAV1–2/TRBV6–2) TCR-MR1–5-OP-RU and (c-d) adult MAIT A-F7 (TRAV1–2/TRBV6–1) TCR-MR1–5-OP-RU (PDB ID: 6PUC). The top panels (a and c) are molecular surface representations of the ternary complexes; the lower panels (b and d) illustrate the respective TCR footprints on the molecular surface of MR1–5-OP-RU. The MR1 and β2-microglobulin molecules are colored white and dark grey, respectively and 5-OP-RU is presented as green and yellow sticks in A2 and A-F7 ternary structures, respectively. A2 TCRα, lavender; A2 TCRβ, light-pink; A-F7 TCRα, sky-blue; A-F7 TCRβ, wheat. The atomic footprint is colored according to the TCR chain making contact. e) Comparison of cord A2 TCR ternary complex relative to the adult A-F7 TCR docking positions. Arrows illustrate TCR rotation around the center of mass of the MR1, as well as displacement of the β-chain along the MR1 binding cleft. f) Superposition of the CDR loops of cord MAIT A2 and adult MAIT A-F7 TCRs sitting atop MR1. The center of mass of the respective TRAV and TRBV variable domains are shown as spheres in the same colors as the respective variable domains. g) Cartoon representation of the ternary structure of A2 TCR-MR1–5-OP-RU. h-i) Interactions between (h) the CDRα loops, (i) CDRβ loops of the cord A2 and MR1 residues. The interacting residues are represented as sticks. Hydrogen bond interactions are represented by black dashes. See also Supplemental Table 6. j) Comparison of the MR1 antigen-binding pocket and the position of MR1 residues in both the cord A2 and adult A-F7 ternary structures. k-l) Interactions of the CDR3α and CDR3β of the cord A2 (k) and adult (l) MAIT TCRs, depicting the ‘interaction triad’ between Tyr152 of MR1, Tyr95α of CDR3α and 5-OP-RU.

Similar articles

References

    1. World Health Organization. Global Report on the Epidemiology and Burden of Sepsis. 2020.
    1. World Health Organization. Global Tuberculosis Report. 2021
    1. Gold MC, Cerri SC, Smyk-Pearson S, et al. Human mucosal associated invariant T cells detect bacterially infected cells. PLoS Biol. 2010;8(6): e1000407. - PMC - PubMed
    1. Le Bourhis L, Martin E, Peguillet I, et al. Antimicrobial activity of mucosal-associated invariant T cells. Nat Immunol. 2010;11:701–708 - PubMed
    1. Harriff M, McMurtry C, Floyd CA, et al. MR1 displays the microbial metabolite driving selective MR1-resitricted T cell receptor usage. Science Immunology. 2018;3(25):eaao2556. - PMC - PubMed

Publication types